Circularly polarised radio emission from GRS 1915+105 and other X-ray binaries
Abstract
I report the detection of circular polarisation, associated with relativistic ejections, from the ‘microquasar’ GRS 1915+105. I further compare detections and limits of circular polarisation and circular-to-linear polarisation ratios in other X-ray binaries. Since in at least two cases the dominance of linear over circular polarisation or vice versa is a function of frequency, this seems to indicate that this is a strong function of depolarisation in the source. Furthermore, I note that circular polarisation has only been detected from sources whose jets lie close to the plane of the sky, whereas we have quite stringent limits on the circular polarisation of jets which lie close to the line of sight.
keywords:
polarization – ISM:jets and outflows – radio continuum:starsguessConjecture {article} {opening}
1 Introduction
Studies of circular polarisation from jets, and indeed of relativistic jets in general, have traditionally focussed on active galactic nuclei (AGN). However, in the past decade or so it has become clear that relativistic jets from X-ray binaries, also known as ‘microquasars’ (Mirabel et al. 1992), share many of the properties (observationally, and therefore almost certainly physically) of their extragalactic cousins. Furthermore, due to the huge mass ratio , we may probe timescales associated with accretion and jet formation by observing X-ray binaries which would be humanly impossible for AGN (e.g. Sams, Eckart & Sunyaev 1996). For recent reviews of jets from X-ray binaries, see Mirabel & Rodriguez (1999), Fender (2003). In this paper I shall first discuss in detail observations of circularly polarised radio emission from the ‘microquasar’ GRS 1915+105 (§2), and then compare it to observations of circularly polarised radio emission from other X-ray binaries (§3).
2 Circular polarisation from GRS 1915+105
In this section we present observations of circular polarisation associated with relativistic ejections from the X-ray binary jet source (‘microquasar’) GRS 1915+105, as well as some preliminary interpretations. These results have been published in Fender et al. (2002b).
2.1 Observations
In Fig 1 we show radio and soft X-ray monitoring of GRS 1915+105, over a 150-day period. The radio monitoring data were obtained with the Ryle Telescope (RT), at a frequency of 15 GHz; for a more detailed description of this monitoring program see Pooley & Fender (1997). The X-ray data are from the RossiXTE All-Sky Monitor (ASM) and measure the total flux in the 2-12 keV band. The RossiXTE ASM is described in Levine et al. (1996) and the public data can be obtained at http://xte.mit.edu.
Indicated in the top panels of Fig 1 are the times of our two ATCA and multiple MERLIN observations of GRS 1915+105.

2.1.1 ATCA
The Australia Telescope Compact Array (ATCA; Frater, Brooks & Whiteoak 1992) has a number of design features which enable very accurate circular polarization measurements. The low antenna cross-polarization and high polarization stability enable accurate calibration of polarization leakage terms, and the linearly-polarized feed design largely isolates Stokes V from contamination by Stokes I.
ATCA observed GRS 1915+105 twice, for six hours each, on 2001 January 17 and 2001 March 23. During the January observations, simultaneous observations at 1384 MHz and 2496 MHz were interleaved with observations at 4800 MHz and 8640 MHz; for the March observations, only 4800 MHz and 8640 MHz were observed. For both epochs the array was in a ‘6 km’ configuration, for which the lack of short baselines served to reduce confusion from other galactic sources. The observation and calibration procedures were similar to those described in Fender et al. (2000).
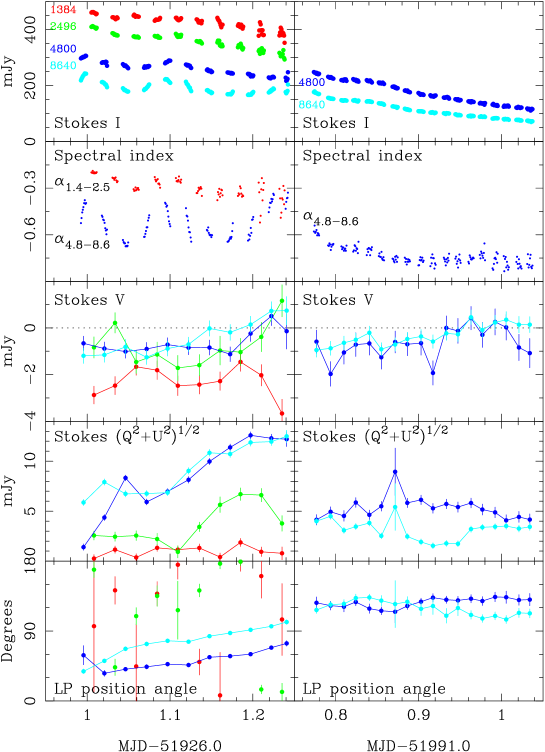
As discussed in Fender et al. (2000), calibration of circular polarization data requires the ”strongly-polarized” calibration equations (Sault, Killeen & Kesteven, 1991), using a point-source with a few percent linear polarization. This is needed to calibrate the leakage of linear polarization into circular. For the 4800 MHz and 8640MHz observations, the VLA calibrator 1923+210 was used as a polarization calibrator for both epochs. Calibrator confusion and low linear polarization, however, precluded the use of any of the observed calibrators as polarization calibrators for the January 1384 MHz and 2496 MHz observations. As a result, we were forced to use calibration solutions derived using the ”weakly-polarized” equations with the ATCA primary calibrator, 1934-638.
The use of the ”weakly-polarized” equations will cause a time-varying leakage of linear polarization into circular. In tests, peak leakages of 5% of the linear polarization into circular have been observed. For the 1384 MHz observations, the low linear polarization of GRS 1915+105 implies the effect of such leakage is negligible. Even for the 2496 MHz observations, where the linear polarization rises rapidly during the observation, in the worst-case the leakage would be only half the Stokes V error due to thermal noise. The full polarisation ATCA data for both epochs are presented in Fig 2.
2.1.2 MERLIN
The Multi Element Radio Linked Interferometer Network (MERLIN) consists of six individual antennae with a typical diameter of 25m and a maximum baseline of 217 km (Thomasson 1986). The observations presented here were undertaken in continuum mode at a frequency of 4994 MHz with a total bandwidth of 16 MHz. As MERLIN measures all four correlation products as a matter of course when in this mode, full polarimetric information can be derived from all images. Ongoing work is seeking to establish the reliability of Stokes V measurements with MERLIN; these will not be reported here.
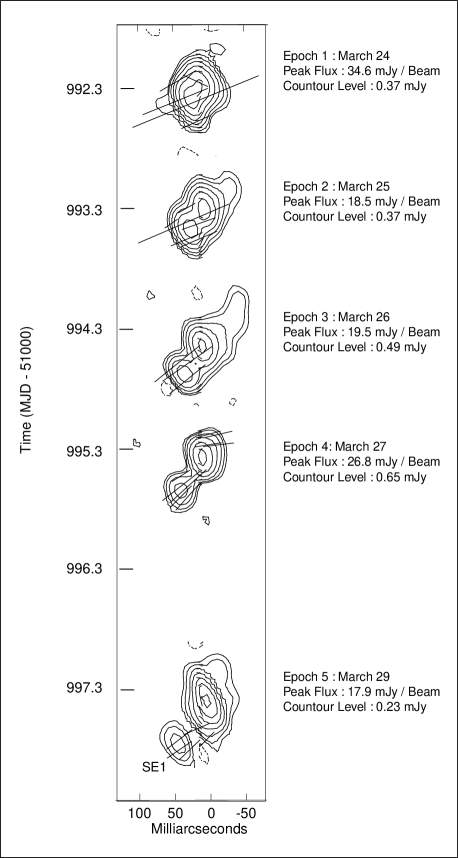
GRS 1915+105 was observed eleven times with MERLIN following the flare observed on 2001, March 22/23. The first five epochs, corresponding to daily observations between 2001 March 24 and March 27 and again on March 29, are presented in this paper (Fig 3); further details and analysis of the full set of MERLIN observations will be published in McCormick et al. (in prep). In each case a flux calibrator, 3C286, a point source, OQ208, and a phase calibrator, 1919+086 , were included in the observing schedule. The flux calibrator and point source calibrator were observed at the beginning and end of the run whilst the rest of the observation was devoted to a cycle of 1.5 minutes on the phase calibrator and 5 minutes on GRS 1915+105.
Initial data editing and calibration were performed using the standard MERLIN d-programs and the data were then transferred to the NRAO Astronomical Image Processing System (AIPS). Within AIPS the data were processed via the MERLIN pipeline, which calibrates and images the phase reference source and then applies these solutions to the target source. This process also derives instrumental polarisation corrections and calibrates the linear polarisation position angle, using 3C286 as the calibrator and assuming a position angle of for its E vector. The position angles measured by MERLIN and ATCA are consistent with the same value, independently confirming the position angle calibration of each array.
Further self calibration was then carried out within AIPS and GRS 1915+105 imaged in total intensity and stokes Q and U. These maps were then combined using the AIPS task PCNTR to produce the final maps with total intensity contours and vectors denoting the direction and strength of linear polarisation.
Note that we can be confident both from previous studies (e.g. Mirabel & Rodriguez 1994; Fender et al. 1999) and these data (McCormick et al. in prep) that the component(s) to the south east (labelled in Fig 3 as ‘SE1’) is ‘approaching’, and component(s) to the north west are ‘receding’ (although in fact both sides of the jet have Doppler factors ).
2.2 Variable circular polarisation
In both sets of ATCA observations, GRS 1915+105 is unambiguously detected as a source of circularly polarised radio emission (Stokes V).

2.2.1 2001 January 17
In 2001 January (Fig 2, left panels), significant CP is measured at all four ATCA frequencies, from 1–9 GHz. The total flux density is clearly declining, indicating the decay phase of a major flare, but there is also significant variability superposed on the relatively smooth decline, preferentially at higher frequencies. This is almost certainly indicative of repeated activity in the core, corresponding to fresh ejection events. The spectral indices support this interpretation; between 1.4–2.9 GHz the spectrum is significantly flatter than expected for optically thin synchrotron emission; between 4.8–8.6 GHz it is displaying the rapidly varying behaviour associated with ‘core’ ejection events (Fender et al. 2002a).
Inspection of the total flux and spectral index light curves indicates there were at least four separate ejection events contributing to the light curve at this epoch. Fig 1 also indicates that this outburst was more prolonged than that in 2001 March (see below).
The CP flux is clearly rising to lower frequencies, but the exact fractional spectrum is difficult to determine as the multiple components contributing to the observed emission are unresolved with ATCA. Table 1 lists the mean total, linearly polarised and circularly polarised flux densities, and Fig 4 plots these both as total and fractional spectra. We also note that there are measurements when the Stokes V flux is not significantly non-zero, and even a few points where it appears to have changed sign. However, (i) the mean Stokes V fluxes are significant, and negative (at both epochs), (ii) the apparent Stokes V sign change has a significance and so we do not consider it convincing.
| 2001 January | 2001 March | |||||
|---|---|---|---|---|---|---|
| (MHz) | I (mJy) | LP (mJy) | V (mJy) | I (mJy) | LP (mJy) | V (mJy) |
| 1384 | ||||||
| 2496 | ||||||
| 4800 | ||||||
| 8640 | ||||||
2.2.2 2001 March 23
In 2001 March, GRS 1915+105 was again observed to flare in our 15 GHz monitoring program, reaching mJy at MJD 51990.43. This time we triggered both ATCA and MERLIN – in fact the first epoch of MERLIN observations started at almost exactly the same time as the ATCA run concluded (Figs 3,5). As a result, we were able to definitively associate the outburst with relativistic ejections from the system (Fig 3).
The full polarisation ATCA data are presented in Fig 2 (right panels), and it is clear that there is less variability in the light curve than in 2001 January, with the smooth decay in radio flux at both frequencies only interrupted by the temporary increase around MJD 51991.82. Assuming the emission observed is associated with the radio event on which we triggered, our ATCA observations commence days after ejection (assuming a Doppler factor of – Fender et al. 1999 – this corresponds to only hr of evolution in the rest frame of the ejecta). The 4.8–8.6 GHz spectral index clearly demonstrates that the majority of the emission is coming from optically thin regions. The mean total intensity, linearly polarised and circularly polarised flux densities are presented in Table 1 and Fig 4.

2.3 A linear polarisation ‘rotator’ event
In the lower two panels of Fig 2 the linearly polarised flux densities and electric vector position angles are indicated. It is quite evident from the lower panel that over the hr of the observation in January 2001, both 4800 and 8640 MHz electric vectors rotate smoothly through degrees. Note that while there is evidence for changing absorption on the scales over which the ejecta from GRS 1915+105 can be tracked (Dhawan, Goss & Rodriguez 2000), variable Faraday rotation cannot be responsible for this effect since the separation between the vectors at the two frequencies remains constant (if Faraday rotation, which varies as , a rotation of degrees at 8.6 GHz should have a corresponding rotation of degrees at 4.8 GHz).
The smooth rotation in the electric vector position angle seems to be a little at odds with both the MERLIN observations of Fender et al. (1999) in which the electric vector was varying seemingly erratically from day-to-day, and the observations presented here (both ATCA and MERLIN) for 2001 March, in which the vector remains approximately constant. Such smooth rotation indicates either a genuinely rotating jet or, perhaps more likely, a smooth change in the (projected) position angle of the magnetic field in the emitting region – such as a global curved structure in the jet.
Similar behaviour, ‘polarisation rotator events’ – see Saikia & Salter (1988) and references therein - has also been observed in AGN. While initially interpreted as physical rotation of the magnetic field structure (which could directly link a jet to e.g. removal of angular momentum from an accretion flow) the more favoured interpretation is the formation of a shock inclined at some angle to the line of sight. The lack of the repeat of this phenomenon in 2001 March would seem to indicate it does not reflect physical rotation of the jet, which we would assume either always happens or never happens. However, more recently Gomez et al. (2001) have interpreted the steady rotation of the linear polarisation vector of a superluminal component in the jet of the AGN 3C120 as indicating an underlying twisted (helical) magnetic field structure.
2.4 Discussion
The origin of a circularly polarised component in the radio emission from AGN and X-ray binaries remains uncertain. However, in both classes of object the bulk of the radio emission can be confidently assumed to arise from similar physical processes, namely synchrotron emission from relativistic electrons in a magnetised plasma flowing away from the central black hole (or neutron star) in collimated jets. Since we have every reason to believe that the Stokes I, and probably Q and U, fluxes from these objects arise via the same processes, we can hope that by studying the origin of Stokes V in X-ray binaries we may shed light on its origin in AGN, and vice versa.
2.4.1 Association of CP with young ejections
What can we learn from these observations of GRS 1915+105 ? From analysis of the combined ATCA and MERLIN data sets for 2001 March, we are confident that the measured circularly polarised radio emission is associated with the relativistic ejection SE1. Our reasoning is as follows:
-
1.
The decreasing Stokes I flux measured at both epochs (most obviously 2001 March) arises from ejected components whose radio flux decays steadily, probably due to adiabatic expansion losses, with time. This can be inferred both from past experience and directly from the MERLIN observations which directly image the fading ejecta as they propagate away from the core. In Fig 5 we show the ATCA light curves, plus the total flux light curve from MERLIN and the fluxes of the two components (core and ejection SE1). The core stays at roughly the same flux level over all of the first five epochs of MERLIN imaging, whereas the flux of SE1 continues to fade – from this we can infer that the bright and decreasing flux observed by ATCA is dominated by emission from ejected component SE1.
-
2.
There is a significant correlation between the Stokes I and (-)Stokes V fluxes, especially at 8640 MHz. For all epochs, and the combined data sets, there is a significant rank correlation between Stokes I and V at 8640 MHz; at 4800 MHz the correlation is marginal. Since the Stokes I, as argued above, is associated with SE1, we can therefore be confident that the Stokes V flux also arises primarily in SE1. Note that we cannot rule out a Stokes V flux of amplitude mJy associated with the core, based on Fig 6.
-
3.
Furthermore, the MERLIN imaging clearly shows that the linearly polarised radio emission also arises in component SE1. Therefore we are able to accurately measure the fractional linear and circular polarisation (ie. all Stokes parameters) for the synchrotron emission from a single optically thin component

2.4.2 Comparison of GRS 1915+105 with AGN, Sgr A* and M81*
Rayner et al. (2000) and Homan et al. (2001) have established that most AGN have ratios of linear to (absolute) circular polarisation , whereas the low-luminosity radio cores Sgr A* and M81* have ratios (Bower et al. 1999; Sault & Macquart 1999; Brunthaler et al. 2001). It is interesting that for the two XRBs for which we have so far measured CP, we find both situations, depending on the frequency observed. In both SS 433 (Fender et al. 2000) and GRS 1915+105, LP CP at the lowest frequency (1.4 GHz), and LP CP at higher ( GHz) frequencies. In GRS 1915+105, it is clear from Figs 2,4 that there is significant opacity (foreground or internal) at the lower frequencies, and so we consider it most likely that the reduction in LP is due to Faraday depolarisation. While in SS 433 there is less obvious indication of opacity at the lowest frequencies, it would seem likely that the same mechanism is operating there to reduce the observed LP. Furthermore, M81* (Brunthaler et al. 2001) and a number of AGN (Rayner 2000) also seem to show flat/inverted fractional CP spectra, as we seem to have measured from GRS 1915+105 in 2001 January. However, we should also note that in Sgr A* there is no optically thin power law component, unlike the two X-ray binaries discussed here, which will further reduce the expected LP (Bower et al. 1999).
In addition, the majority of AGN are found to maintain the same sign of Stokes V on timescales from months to decades (Komesaroff et al. 1984; Rayner et al. 2000; Homan et al. 2001). Bower et al. (2002) have more recently shown that Sgr A* has maintained the same sign (and level) of CP over 20 years. In comparison, for X-ray binaries there are two observations of SS 433 separated by 10 days (Fender et al. 2000), and two observations of GRS 1915+105 separated by 65 days presented here; in both cases the sign remains the same. Of course the X-ray binary sample is extremely small, but should expand rapidly in the near future, with several events per year bright enough to mean CP at the % level (Fender & Kuulkers 2001). It is interesting to note that if accretion timescales scale linearly with mass from X-ray binaries to AGN (e.g. Sams, Eckart & Sunyaev 1996) then timescales of tens of days for SS 433 and GRS 1915+105 would correspond to timescales of thousands of years for Sgr A* and millions of years for some AGN – ie. we may have already probed longer in ‘accretion time’ than in all the studies of AGN to date ! However, McCormick, Fender & Spencer (these proceedings) report an apparent secular sign-change in Stokes V from SS 433 over longer timescales than those reported in Fender et al. (2000), possibly indicating some long-term evolution of the magnetic field geometry (see also Ensslin, these proceedings).
2.4.3 Origins of the CP component
The CP spectrum detected from GRS 1915+105 is rather similar to that observed from SS 433 (Fender et al. 2000), being observed over a broad range (1–9 GHz) and with a decreasing Stokes V (although not necessarily V/I) spectrum. The broadband nature of the CP spectrum suggests that coherent emission mechanisms are unlikely. Furthermore, we do not consider the birefringent scintillation mechanism of Macquart & Melrose (2000) very likely either, since the CP component seems to be associated with a physical event in the source, yet because of the high velocities of the ejecta it is likely to be a large distance from the source during the periods in which we measured CP.
This leads us (once again) to consider one of two mechanisms most viable, an intrinsic CP component to the synchrotron emission or LPCP conversion (‘repolarisation’). Do we have any evidence in favour of either of these ? The intrinsic synchrotron mechanism should, naively, produce a well-defined V/I spectrum in a homogenous, optically thin, source. Our observations in 2001 March match these criteria quite closely (supported by direct imaging of a single ejection event with MERLIN), but unfortunately we only have a two-point CP spectrum at this epoch. In addition, the relatively low signal-to-noise ratio of the CP detections only allows us to constrain the (-V)/I spectral index to be . In 2001 January the situation is rather more complex, the mean flux and polarisation spectra certainly containing the contributions of multiple components with different optical depths. The data may suggest that the CP arises preferentially in ‘core’ components with the highest densities and optical depths, similar to the situation in AGN. This interpretation may favour instead the LPCP ‘repolarisation’ mechanism, which will operate most efficiently at higher optical depths, but currently the data are not sufficiently constraining.
However, both mechanisms require a significant population of low-energy electrons. In principle, a strong probe of this requirement could be obtained by measuring the low-frequency extent of radio emission during outbursts of GRS 1915+105 and other systems. Prompt observations at MHz frequencies could probe the electron distributions at Lorentz factors of 30 and lower (based on calculations in Fender et al. 1999) although, depending on the energy and magnetic field density in the ejecta, this emission may be self-absorbed. The consequences for the energetics of ejection events would be significant, especially in the case of a neutral baryonic plasma with one proton associated with each electron.
3 CP from other X-ray binaries
In this section I shall present a brief compilation of measurements (in most cases limits) on radio CP from other X-ray binaries, and also compare the CP:LP ratio in X-ray binaries with that observed from blazars and low-luminosity AGN.

3.1 Measurements of other systems
As well as the clear detections of CP from the three X-ray binary jet sources SS 433, GRO J1655-40 and GRS 1915+105 (see also McCormick et al., and Macquart, these proceedings, and references therein), there are also limits on CP from other X-ray binaries, some of which are stringent. In table 3 I list the measurements and limits on CP from X-ray binaries.
| Source | Freq. (GHz) | % CP | Ref |
| SS 433 | 1.384 | 0.8 | Fender et al. (2000) |
| 2.497 | 0.5 | ||
| 4.800 | 0.3 | ||
| 8.640 | 0.1 | ||
| GRS 1915+105 | 1.384 | 0.3 | Fender et al. (2002b) |
| 2.496 | 0.2 | ||
| 4.800 | 0.2–0.3 | ||
| 8.640 | 0.2–0.3 | ||
| GRO J1655-40 | 1.384 | Macquart et al. (2002) | |
| 2.378 | |||
| 4.800 | |||
| 8.640 | |||
| GX 339-4 | 8.64 | Corbel et al. 2000 | |
| Cir X-1 | 4.80 | Fender et al. in prep | |
| 8.60 | |||
| Cyg X-3 | 5.0 | de Bruyn (priv. comm.) | |
| (Sept 2001) | |||
| V 4641 Sgr | 4.80 | Sault (priv. comm.) | |
| (2002) | 8.64 | ||
| Cyg X-1 | 4.86 | Brocksopp, Fender, | |
| 8.46 | Bower & Clarke (2003) | ||
| 14.94 |
It is interesting to note that the three sources from which CP has been strongly detected have jets which are close to the plane of the sky (). However, the jets from Cir X-1, V 4641 Sgr and Cyg X-3 are believed to be very close to the line of sight (). The limits on the CP from Cyg X-3 and V 4641 are particularly stringent. The limits obtained on CP in both cases are between 5–10 times below the levels of V/I detected from SS 433, GRS 1915+105 and GRO J1655-40. This indeed seems like a hint that CP, at least from X-ray binaries, is stronger when the jet is viewed approximately ‘side on’. However, it should also be noted that both sources show evidence (either on the specific occasion or others) for a strongly self-absorbed outburst, unlike e.g. SS 433 which is nearly always optically thin. In addition, the orientation effect would be rather contrary to the observations of AGN, in which strong CP is observed from ‘blazars’ with approximately face-on jets (e.g. Homan et al. 2001).

3.2 The CP:LP ratio and comparison with AGN
Both Homan et al. (2001) and Brunthaler et al. (2001) investigate the ratio of circular to linear polarisation. Specifically, Brunthaler et al. (2001) define RCL as the ratio of fractional CP to fractional LP, and find that R for the two low-luminosity AGN (LLAGN) M81* and Sgr A* between 1–15 GHz (in fact no LP is detected at all from these sources). Homan et al., (2001) present 5 GHz measurements for many blazars, with significant measurements of both LP and CP for sixteen sources, and find for all of these that R.
We have already seen (Fig 4) that for GRS 1915+105, at the lowest frequency R, whereas for the other three higher frequencies R. In Fig 7 I plot RCL as a function of frequency for both GRS 1915+105 and SS 433, two epochs for each source. In both cases R for the lowest frequency (1.4 GHz) and R for the three higher frequencies. This seems to imply that whether RCL is greater or less than unity depends on the degree of Faraday depolarisation in the emitting plasma. It should be noted that for the X-ray binary GRO J1655-40, which showed a high degree of linear polarisation, R at all frequencies (Macquart et al. 2002).
In Fig 8 I plot fractional CP against fractional LP for these two X-ray binaries, plus the two LLAGN and the most significant detections from the blazar sample of Homan et al. (2001). The two groups of AGN are separated by the line corresponding to LP=CP, whereas the X-ray binaries lie either side of the line depending on frequency. It is interesting to note that, since for both LLAGN there are only upper limits on LP, it is only for the low-frequency observations of the X-ray binaries that the exact value of R, when it is less than unity, has been measured.
4 Conclusions
Circularly polarised radio emission has been clearly detected from three X-ray binaries, all of which are associated with powerful jets which share many of the characteristics of AGN. In the cases of both GRS 1915+105 and GRO J1655-40, strong and variable circular polarisation was associated with clearly resolved ejection events. Comparing the fractional circular polarisation spectrum, and circular to linear polarisation ratio, clear similarities with AGN are noted. In particular, multi-frequency measurements of X-ray binaries, which reveal that the circular to linear polarisation ratio increases with wavelength, support interpretations in which the dominant factor for this ratio is the degree of Faraday depolarisation in the source.
Acknowledgements.
The author would like to thank all the participants at the workshop in Amsterdam for many discussions, some useful, some useless but amusing. In addition, he would like to thank Ger de Bruyn and Bob Sault for providing information on unpublished results. \theendnotesReferences
- [] Bower G.C., Falcke H., Backer D.C., 1999, ApJ, 523, L29
- [] Bower G.C., Falcke H., Sault R.J., Backer D.C. 2002, ApJ, 571, 843
- [] Brocksopp C., Fender R.P., Bower G., Clarke M., 2003, MNRAS, submitted
- [] Brunthaler A., Bower G.C., Falcke H., Mellon R.R., 2001, ApJ, 560, L123
- [] Dhawan V., Goss W.M., Rodríguez L.F., 2000a, ApJ, 540, 863
- [] Fender R., 2003, Jets from X-ray binaries, In ‘Compact Stellar X-ray Sources’ Eds. W.H.G. Lewin and M. van der Klis, Cambridge University Press, in press astro-ph/0303339
- [] Fender R.P., Garrington S.T., McKay D.J., Muxlow T.W.B., Pooley G.G., Spencer R.E., Stirling A.M., Waltman E.B., 1999, MNRAS, 304, 865
- [] Fender R., Rayner D., Norris R., Sault R.J., Pooley G., 2000, ApJ, 530, L29
- [] Fender R.P., Rayner D., Trushkin S.A., O’Brien K., Sault R.J., Pooley G.G., Norris R.P., 2002a, MNRAS, 330, 212
- [] Fender R.P., Rayner D., McCormick D.G., Muxlow T.W.B., Pooley G.G., Sault R.J., Spencer R.E., 2002b, MNRAS, 336, 39
- [] Frater R.H., Brooks J.W., Whiteoak J.B., 1992, Journal of Electrical and Electronics Engineering, Australia, 12, 2
- [] Gomez J-L., Marscher A.P., Alberdi A., Jorstad S.G., Aguda I., 2001, ApJ, 561, L161
- [] Homan D.C., Attridge J.M., Wardle J.F.C., 2001, ApJ, 556, 113
- [] Komesaroff M.M., Roberts J.A., Milne D.K., Rayner P.T., Cooke D.J., 1983, MNRAS, 028, 409
- [] Levine A.M., Bradt H., Cui W., Jernigan J.G., Morgan E.H., Remillard R.A., Shirey R., Smith D., 1996, ApJ, 469, L33
- [] Macquart J.-P., Melrose D.B., 2000, ApJ, 545, 798 Macquart J.-P., Wu K., Sault R.J., Hannikainen D.C., 2002, A&A, 396, 615
- [] Mioduszewski A.J., Rupen M.P., Hjellming R.M., Pooley G.G., Waltman E.B., 2001, ApJ, 553, 766
- [] Mirabel, I.F., Rodríguez, L.F., 1994, Nature, 371, 46
- [] Mirabel, I.F., Rodríguez, L.F., 1999, ARA&A, 37, 409
- [] Mirabel I.F., Rodríguez L.F., Cordier B., Paul J., Lebrun F., 1992, Nature, 358, 215
- [] Orosz J.A. et al. 2001, ApJ, 4890
- [] Pooley G.G., Fender R.P., 1997, MNRAS, 292, 925
- [] Rayner D.P., PhD thesis, University of Tasmania, 2000
- [] Rayner D.P., Norris, R.P., Sault, R.J., 2000, 319, 484
- [] Saikia D.J., Salter C.J., 1988, ARA&A, 26, 93
- [] Sault R.J., Macquart J.-P., 1999, ApJ, 526, L85
- [] Sault R.J., Killeen N.E.B. & Kesteven, M.J. 1991, AT Polarization Calibration, Tech. Rep. 39.3015, Australia Telescope National Facility
- [] Thomasson P., 1986. QJRAS, 27,413