ISM Properties in Low-Metallicity Environments
We present new 450 and 850 SCUBA data of the dwarf galaxy NGC 1569. We construct the mid-infrared to millimeter SED of NGC 1569, using ISOCAM, ISOPHOT, IRAS, KAO, SCUBA and MAMBO data, and model the SED in order to explore the nature of the dust in low metallicity environments. The detailed modeling is performed in a self-consistent way, synthesizing the global ISRF of the galaxy using an evolutionary synthesis model with further constraints provided by the observed MIR ionic lines and a photoionisation model. Our results show that the dust properties are different in this low metallicity galaxy compared to other more metal rich galaxies. The results indicate a paucity of PAHs probably due to the destructive effects of the ISRF penetrating a clumpy environment and a size-segregation of grains where the emission is dominated by small grains of size , consistent with the idea of shocks having a dramatic effect on the dust properties in NGC 1569. A significant millimetre excess is present in the dust SED which can be explained by the presence of ubiquitous very cold dust (). This dust component accounts for 40 to 70 of the total dust mass in the galaxy ( ) and could be distributed in small clumps (size a few pc) throughout the galaxy. We find a gas-to-dust mass ratio of 740 - 1600, larger than that of the Galaxy and a dust-to-metals ratio of to . We generate an extinction curve for NGC 1569, consistent with the modeled dust size distribution. This extinction curve has relatively steep FUV rise and smaller 2175 Å bump, resembling the observed extinction curve of some regions in the Large Magellanic Cloud.
Key Words.:
ISM: dust, extinction – Galaxies: dwarf – Galaxies: starburst – Infrared: galaxies – Submillimeter1 Introduction
The absorption of stellar radiation by dust and its subsequent reemission in the infrared (IR) to the submillimeter (submm) is a fundamental process controlling the heating and cooling of the interstellar medium (ISM; e.g. Tielens & Hollenbach 1985). The dust IR spectral energy distribution (SED) of a galaxy is its footprint reflecting fundamental physical parameters such as initial mass function (IMF), age, stellar population and metallicity. Thus, knowledge of the physical characteristics of dust in galaxies opens the door to understanding the star formation history and the evolution of galaxies. However, an accurate interpretation of the SEDs of galaxies requires knowledge of the detailed macroscopic and/or microscopic dust properties in galaxies, such as composition, emissivity, dust size distribution, and spatial distribution. How these properties are effected by variations in the metallicity of the ISM is the focus of our present study.
Dwarf galaxies in our local universe are ideal laboratories for studying the interplay between the ISM and star formation in low-metallicity environments (Hunter & Gallagher 1989). They are at relatively early epochs of their chemical evolution, possibly resembling distant protogalaxies in their early stages of star formation. The subject of dust formation in primordial environments and the processes controlling the subsequent evolution of dust compels us to study the dust properties in nearby dwarf galaxies, with the eventual goal of constructing templates that would apply to primordial galaxies. While only a relatively small number of metal-poor galaxies has been observed at mid-infrared (MIR) wavelengths using the Infrared Space Observatory (ISO), it is already apparent that the characteristics of the MIR dust components differ remarkably from those of more metal-rich starburst galaxies (e.g. Lutz et al. 1998; Crowther et al. 1999; Thuan et al. 1999; Madden 2000; Vacca et al. 2002; Madden et al. 2003). Is it correct to simply assume Galactic dust properties when modeling the dust in dwarf galaxies?
Discrepancies are arising as to the quantity of dust that is actually present in even the lowest metallicity galaxies that are observed today. Since optical observations are more readily accessible than MIR to far infrared (FIR) wavelengths which require space and air borne platforms, the dust opacity has mostly been determined through the effects of obscuration, not from the dust emission properties. These different measurements are not always consistent. Even at 1/50 solar metallicity, I Zw 18 contains a non-negligible amount of reddening, determined from optical observations to be equivalent to (Cannon et al. 2002). In the dwarf galaxy SBS 0335-052 (1/40 solar metallicity), values as high as 20 to 30 have been suggested from MIR observations (Thuan et al. 1999; Plante & Sauvage 2002), contrary to the low values, , obtained by Dale et al. (2002) and Izotov et al. (1997). All of the details that go into modeling the dust properties in dwarf galaxies are critical for determining the quantity of dust that resides in these metal-poor galaxies. This must also be reconciled with current dust evolution models before we can understand the early epoch of star formation.
We focus on the detailed modeling of the SEDs of dwarf galaxies, constructing the SEDs with as much wavelength coverage as possible. We began with a sample of dwarf galaxies observed in the MIR (Madden et al. 2000; Madden et al. 2003). IRAS and ISOPHOT observations are included, along with our recently-obtained ground-based submm (Galliano et al. 2002) and millimetre (mm) observations (Galliano et al. 2003). The basis of the dust modeling is the model of Désert et al. (1990; hereafter called DBP90). To synthesise an input interstellar radiation field (ISRF), we use a stellar evolution model (PÉGASE; Fioc & Rocca-Volmerange 1997) and additional constraints obtained from a photoionisation model (CLOUDY; Ferland 1996). Here we present the complete modeling for NGC 1569, a nearby ( Mpc; Israel 1988) dwarf galaxy with an average metallicity of 1/4 solar (González Delgado et al. 1997), currently in the aftermath of a massive burst of star formation (Israel 1988; Waller 1991). A dust SED model has recently been presented by Lisenfeld et al. (2002). Recent Chandra observations find large inhomogeneities in the metal abundances with ranges from 0.1 Z⊙ to 1 Z⊙ (Martin et al. 2002), evidence that the ISM has been affected by numerous supernovae explosions since the last burst. NGC 1569 contains two bright super-star-clusters (SSCs) (Arp & Sandage 1985; Aloisi et al. 2001) which have blown out a large fraction of the gas in a dramatic display.
The paper is organised as follows. Section 2 presents an overview of our new observations and the data we use from the literature. Section 3 describes the adopted model and the method we use to investigate the dust properties. Section 4 presents the modeled SED of NGC 1569 and the consequences of the results on the dust properties. We end with a summary and the conclusions in Sect. 5.
2 The Observations
An observed SED was constructed, as completely as possible, incorporating data from the literature for various telescopes: IRAS, KAO, ISO (ISOPHOT) and IRAM (MAMBO), as well as our ISOCAM data (Madden et al. 2003) and our new 450 and 850 JCMT (SCUBA) observations presented here. Since we are modeling the global SED in this paper, the differences in beam sizes are not of great concern here.
2.1 SCUBA observations
We obtained 450 and 850 data of NGC 1569, with SCUBA (Holland et al. 1999), a bolometer array on the James Clerk Maxwell Telescope (JCMT), during two observing runs in February 2000 and December 2000. Observations were carried out in the jiggle-mapping mode using a 64-point jiggle pattern with a chop throw of .
We reduced these data using the SURF V1.5-1 software (Jenness & Lightfoot
1998), other STARLINK utilities such as KAPPA, CONVERT, FIGARO and our own
IDL routines.
We scrutinised the data between each step of the processing to check for
possible artifacts.
We proceeded in the following way:
1) Atmospheric extinction:
The relatively low atmospheric transmission is the main difficulty in
obtaining good quality ground-based observations at these wavelengths.
To quantify the atmospheric extinction and correct our data for this effect,
we performed skydips at 450 and 850 every 1-2 hours.
In addition, we used the measured at 225 GHz, from the Caltech
Submillimeter Observatory radiometer, which ranged from 0.04 to 0.1 during our
observations.
We evaluate the atmospheric transmission at 850 , , using
the skydip value adapted to the elevation of the bolometer.
However, the 450 skydip has been determined to be unreliable due to
the fluctuations of the atmosphere.
We, therefore, used relationships between , and
to compute :
(Archibald et al. 2000).
2) Flatfields, despiking and bad bolometers:
The non-uniformity of the response of each bolometer is corrected with
standard calibration flatfield measurements since it remains constant with
time and does not need to be re-measured every night (Jenness & Lightfoot
1998).
The spikes were removed from individual maps using a threshold
and noise measurements were performed at the beginning and at the end of the
shift every night.
Bad bolometers were removed with a threshold of .
This last step can create holes in individual maps.
However, since the array rotates on the sky, the final map contains no holes.
3) Sky fluctuations:
The fluctuations in the emissivity of the atmosphere were removed using the
fact that the outer ring of bolometers was observing the sky.
The median of the outer ring, excluding the noisy bolometers, was subtracted
from each map.
Using cumulative growth-curves, we verified that no source flux was removed.
Each map was rebinned with a pixel field of view of /pixel at 850
and /pixel at 450 which correspond to the jiggle-map sampling.
4) Flux conversion:
Each night, we performed three measurements of the calibration sources, Uranus,
Mars or CRL 618, using the same observing parameters.
An average Flux Conversion Factor (FCF) was computed from these measurements,
for each night and the individual maps were calibrated by the corresponding
FCF.
We evaluated the average peak-to-aperture ratios, , on
the calibrators, to correct for the loss of flux in secondary lobes.
The full-width-half maximum (FWHM) beam size is at 450 and
at 850 .
5) Map coadding and filtering:
The individual maps were coadded, weighted by , where
is the integration time and the standard deviation of
the pixels in the image.
We applied the MR/1 multiresolution filtering method (Starck et al. 1998)
using a threshold.
6) Evaluation of uncertainties:
To estimate the cumulative uncertainty on the flux
integrated in a circular aperture (we took
for the entire galaxy), we quantified the individual error
contributions.
We first construct RMS maps for 850 and 450 observations
such that each pixel of these maps is the standard deviation
of the corresponding pixels of the individual
maps.
The contribution of these fluctuations to the total error,
, is computed by integrating the flux in the
RMS map in the aperture :
where is the number of pixels per beam.
The error due to the sky emission subtraction, , is the
standard deviation of the distribution of the points used to compute the
median:
where
is the number of pixels inside the aperture .
The error on the absolute calibration, considering the distribution of the
FCF, , and the distribution of the
peak-to-aperture ratios, :
,
.
The total uncertainty on the net flux is the sum of these different
contributions (Table 1):
| (1) | |||||
| RMS | Sky | Calibrator | Ratio | Total | |
|---|---|---|---|---|---|
7) Radio and molecular contributions: The radio continuum emission contaminating the 450 and 850 broadbands was evaluated from Israel & de Bruyn (1988). Taking their value of the spectral index, , we extrapolate the radio continuum to be 49 mJy () at 850 and 39 mJy () at 450 . We estimate the CO(3-2) contribution in the observed 850 band from Meier et al. (2001) to be . The observed 450 and 850 flux values we use for our dust modeling were adjusted for non-dust contamination.
Our 850 value ( mJy) is consistent with Lisenfeld et al. (2002) ( mJy) using different SCUBA data. Our 450 flux is mJy while Lisenfeld et al. (2002) report a higher total flux of mJy but still consistent. By studying the behavior of both the 450 and 850 skydips as a function of time of day and sky conditions, we gave particular attention to calibration questions. The most accurate calibration uses the 850 skydips to adjust the 450 maps. Using the 450 skydip to calibrate the 450 data is known to give higher fluxes (Archibald et al. 2000). This is probably the greatest source of difference in the final calibration between the present paper and Lisenfeld et al. (2002).
2.2 Infrared to millimetre data
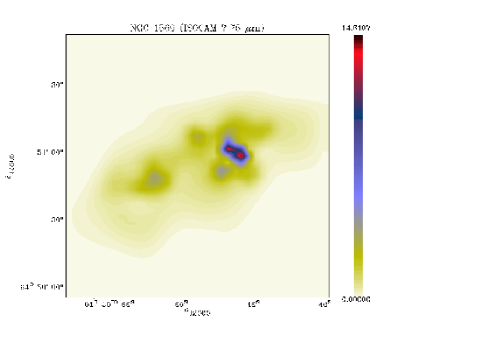
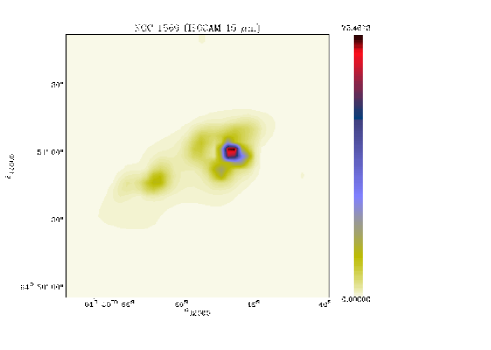
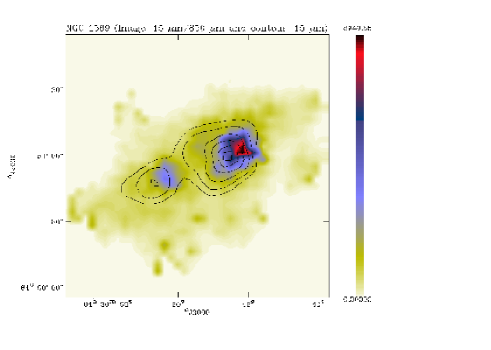
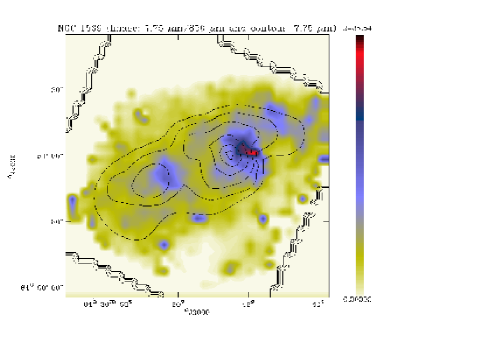
The ISOCAM circular variable filter (CVF) spectrum provides the constraints in the 5 to 16 wavelength range. The details and the data treatment of the CVF observations are presented in Madden et al. (2003). We have found that the slope of the MIR CVF is a critical factor in constraining the dust model. Thus, using only the IRAS 12 band or several ISOCAM broad band observations do not provide sufficient constraints on the model. We characterised the MIR dust continuum by choosing 10 wavelength regions of the CVF which do not contain aromatic bands or ionic lines (Table 2). This was to balance the full observed SED which contains 8 additional points from other instruments. The ISOCAM images (Fig. 2) are raster maps and have been processed in the same way as the CVF spectrum (Madden et al. 2003). We deconvolved the individual images using a multiresolution Lucy algorithm from the MR/1 package (Starck et al. 1998), using a detection threshold. Some ratio maps are shown in Fig. 2.
IRAS fluxes for NGC 1569 are given by Thronson & Telesco (1986), Hunter et al. (1989a) and Melisse & Israel (1994). The values for the four IRAS broadbands given by Thronson & Telesco (1986) and by Hunter et al. (1989a) are similar, and equal to the ISOCAM CVF when integrated over the equivalent IRAS 12 band. The values reported by Melisse & Israel (1995) differ significantly and are flagged by the authors to be uncertain. For our modeling purposes, we use the values of Hunter et al. (1989a) since error bars are also provided (Table 2). These fluxes have been color-corrected.
ISOPHOT is an imaging polarimeter operating between 2.5 and 240 , which was onboard the satellite ISO (Lemke et al. 1996). Data were taken by the two cameras of PHOT-C, C_100 and C_200, at 60, 100 and 180 . However after analysing the data, we realised that the background position was on a bright cirrus spot, rendering the data difficult to interpret. Instead, we use only the value from the ISOPHOT 170 serendipity survey (Stickel et al. 2000) which gives a total 170 flux of Jy for NGC 1569 (Martin Haas, private communication).
Hunter et al. (1989b) measured a 155 flux of 36 Jy on the Kuiper Airborne Observatory (KAO). The 1.2 mm IRAM flux is from Lisenfeld et al. (2002). They have subtracted the contributions of the radio continuum and the CO(2-1) line emission. All of the fluxes used are listed in table 2.
| Instrument | Net flux (mJy) | ||
| ISOCAM | 8.8 | 0.05 | |
| 10.1 | 0.96 | ||
| 10.8 | 0.87 | ||
| 11.8 | 0.73 | ||
| 12.1 | 0.69 | ||
| 13.2 | 0.54 | ||
| 13.9 | 0.45 | ||
| 14.6 | 0.35 | ||
| 15.0 | 0.30 | ||
| 16.0 | 0.16 | ||
| IRAS | 24.3 | 6.3 | |
| 62.8 | 19 | ||
| 103 | 22 | ||
| KAO | 155 | 30 | |
| ISOPHOT | 174 | 90 | |
| SCUBA | 443 | 20 | |
| 863 | 70 | ||
| IRAM | 1200 | 200 |
2.3 UV and optical data
To constrain the input stellar radiation field (Sect. 3.3) we used optical and UV data measured for the total galaxy (Israel 1988; De Vaucouleurs et al. 1991; Table 3).
| Wavelength | Flux density |
|---|---|
| (Å) | ( erg s-1 cm-1 Å-1) |
| 1500 | |
| 1800 | |
| 2200 | |
| 2500 | |
| 3650 | |
| 4400 | |
| 5500 |
 |
|
 |
|
 |
|
3 Self-consistent modeling of the global SED
We have modeled the IR to millimetre dust emission from NGC 1569 in a self-consistent way using a wide variety of observational constraints. In this section we describe the method used. The results are presented in Sect. 4. The general algorithm used to obtain the best solution is outlined in Sec. 3.4.
3.1 Physical parameters of the galaxy
In the adopted model, we assume that the dust is located in a thin shell at an effective distance () from the central heating sources, the stars (Fig. 3). The extinction is treated in terms of a slab model which neglects scattering.
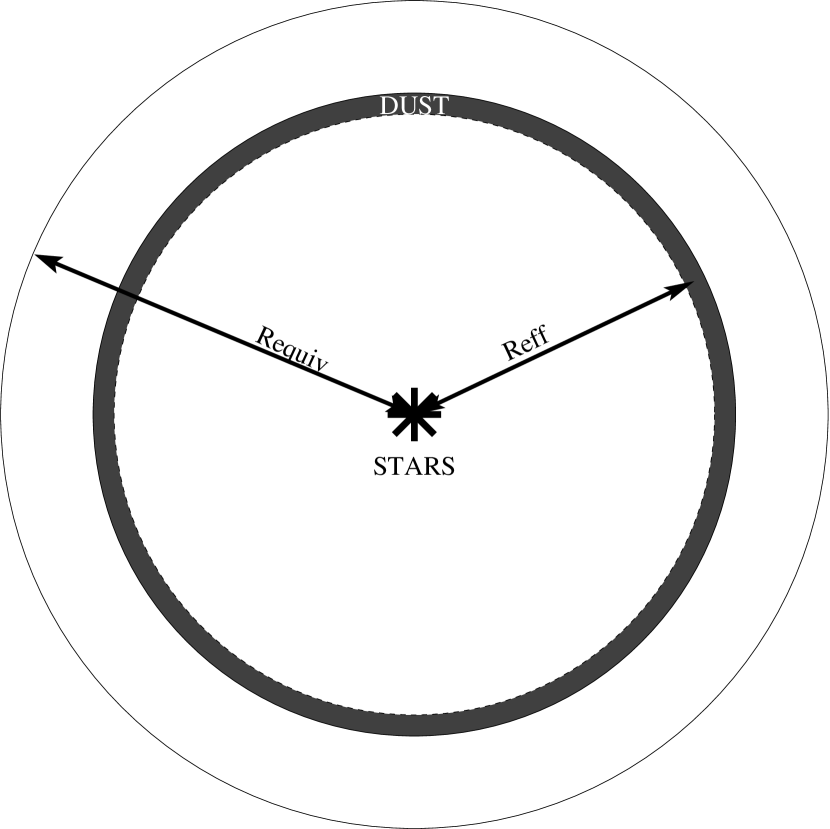
In order to have a consistent set of physical parameters (average radius, density, column density, etc.), we estimate the radius of the equivalent spherical galaxy from our 850 image and deduce the value of the densities from this radius and from the hydrogen masses given in the literature. To determine , we fit an ellipse to the galaxy at 850 using the geometrical mean of the axes as the average radius, which gives an equivalent radius, , of (the uncertainty, , is due to the uncertainty in the distance), consistent with the optical size: kpc (Israel 1988) which gives a kpc. The corresponding effective hydrogen density, , and column density, , are cm-3 and cm-2 from the M(HI) and M(H2) given by Israel (1997) ( , ).
The mean distance from the dust to the stars is taken to be , corresponding to a homogeneous spatial distribution of the dust. We ran the model for this value of and also for two extreme cases: and . These extreme values permit us to investigate a wide variety of spatial distributions and also to take into account uncertainties on the distance determination.
3.2 Dust modeling
To compute the dust emission spectrum we use DBP90 which includes three dust components and provides a coherent interpretation of both the interstellar extinction and the infrared emission. This model has been used to explain the dust properties in the Galaxy. The three components of the DBP90 model are the following:
-
1.
Polycyclic Aromatic Hydrocarbons (PAHs); 2-dimensional molecules responsible for the MIR emission features and the FUV non-linear rise in the extinction curve. In the standard DBP90 model applied to the Galaxy, PAHs have a size range of .
-
2.
Very Small Grains (VSGs); 3-dimensional carbonaceous grains responsible for the MIR continuum emission and the 2175 Å extinction bump. In the standard model, their radii are .
-
3.
Big Grains (BGs); 3-dimensional silicates, coated or mixed with carbonaceous material, responsible for the FIR emission and for the NIR and visible rise of the extinction curve. In the standard model, their radii are .
Due to their small sizes, and thus low heat capacity, PAHs and VSGs are transiently heated by single photon absorption and are not in thermal equilibrium with the radiation field. BGs usually reach thermal equilibrium for the grain sizes determined for the Galaxy. However the dust model does include thermal fluctuations for the BGs if their sizes warrant it. The model also computes the absorption cross section of the grains corresponding to the physical parameters that fit the emission. Finally, the extinction curve is generated using the absorption cross sections generated by the model.
We use the DBP90 model to compute the MIR to millimetre SED. The data which constrain the SED are summarised in Table 2. To obtain the best fit to these data, we have varied the physical parameters of the model, using a Levenberg-Marquardt method (Numerical Recipes, Press et al. 1996) to minimize the . The parameters which can vary are:
-
1.
the mass abundance of each species, ( is the dust mass in the beam and is the hydrogen mass in the beam);
-
2.
the index of the power-law of the size distribution of each species, , where ( is the grain radius and the number density of grains between and );
-
3.
the minimum and maximum sizes of each species, and ;
-
4.
the absorption coefficient of the grains, , defined as ( is the absorption cross-section) for a spherical grain of radius .
Moreover, the widths of the individual broadband observations are taken into account, except for the ISOCAM CVF spectrum since the spectral resolution is sufficient to neglect this effect (). For the data from the bolometers (SCUBA and MAMBO), we integrated the modeled SED into the observational broadbands. For the data from photo-multipliers (KAO and ISOPHOT), we made the corresponding color-correction when integrating into the broadbands. For the IRAS data, this correction was already made. This correction has the largest effect for the 170 ISOPHOT broadband (Fig. 5).
3.3 Modeling of the interstellar radiation field
The DBP90 model requires an input ISRF which heats the dust. To be consistent, we have modeled the global ISRF for NGC 1569 using the UV and optical data (Table 3) coupled with the evolutionary synthesis model PÉGASE 2.0 (Fioc & Rocca-Volmerange 1997), taking into account the constraints from photonisation processes using CLOUDY.
3.3.1 Stellar evolutionary synthesis
PÉGASE computes the stellar spectral energy distribution taking into account the metallicity evolution. We do not incorporate the dust extinction effects and the nebular emission into PÉGASE. The values are computed by DBP90, the extinction is calculated with a simple screen model and the nebular emission is taken into account using the photoionisation model, CLOUDY (Sect. 3.3.2).
We fit the UV-to-optical data (Table 3) using a combination of two single instantaneous bursts with an initial metallicity of (González Delgado et al. 1997). The reddening is calculated using the dust cross-sections computed by the dust model. However, the optical depth deduced from this extinction curve corresponds to the case where all the dust is located in front of the stars. To obtain the effective optical depth, , the shape of the extinction curve is scaled in order to satisfy the energy conservation:
| (2) |
where is the flux density as it would be observed if there were no dust in the galaxy, only stars, and and are the flux densities from reddened stars and dust respectively, as they would be observed:
| (3) |
We minimise the to find the best age combination. The fit gives several age combinations with similar . To remove this degeneracy, we use a further constraint, comparing the MIR ionic line ratios from Madden et al. (2003) and the theoretical results computed with the photoionisation model CLOUDY (version 90.04, Ferland 1996).
3.3.2 Photoionisation
CLOUDY predicts the spectra of astrophysical plasma in different environments. It uses a recent atomic database and takes into account the geometry and the gas properties. We use CLOUDY through the MICE111MICE is supported by the SWS and the ISO Spectrometer Data Center at MPE through DLR (DARA) under grants 50 QI 86108 and 50 QI 94023. IDL interface. A thick shell geometry is adopted while that for the dust emission is a thin shell.
We have computed a grid of solutions from CLOUDY containing a range of values for the following parameters:
-
1.
the shape of the input ISRFs are those which give the best values as the output from PÉGASE;
-
2.
the total luminosity of the galaxy was computed by integrating the total UV-optical and IR-mm SED: ;
-
3.
the inner radius varies from to , which is the radius of the hole in HI centered on the SSC A (Israel & Van Driel 1990);
-
4.
the average hydrogen number density is ( cm-3; Sect. 3.1);
-
5.
the outer radius was taken to be (Sect. 3.1).
We set the elemental abundances to , and according to the value of the metallicity given by González Delgado et al. (1997). Fitting the theoretical ionic line ratios to the MIR data ( = ; = ; Madden et al. 2003) clearly removes the degeneracy of the ISRF.
3.4 Iterative process
The modeling of the dust emissivity generates an extinction curve which is used to deredden the UV-to-optical data in order to compute the ISRF. The ISRF is used by the dust emissivity model to heat the dust. Therefore, to be consistent, we compute this sequence through an iterative process until we reach a stable, self-consistent solution. This solution is obtained when the extinction curve used to deredden the data equals that deduced from the dust emission. The general scheme of this iterative process is shown in Fig. 4.

4 Results and discussion
We have applied the general model described in Sect. 3 to our observed IR-to-millimetre SED for NGC 1569 (Table 2).
4.1 The dust emissivity
In this subsection we describe the details of the solution of the dust modeling and discuss the constraints and the consequences of the model results.
4.1.1 Millimetre excess
In areas where we have no strong constraints, some parameters of the general model described in Sect. 3.2 are kept fixed, while others are left as free parameters to obtain the best fit.
-
1.
PAHs: this component is too weak in NGC 1569 to be constrained with our set of data. An upper limit on the mass abundance of the PAHs, , is fixed and we used the Galactic values for , and .
-
2.
VSGs: we varied the mass abundance, , and two parameters governing the size distribution, and . However, we cannot constrain since the process tends to decrease it to very small sizes which have no physical meaning, so it was kept constant at the Galactic value.
-
3.
BGs: we varied the mass abundance, , and two parameters governing the size distribution, and . Since the results are not sensitive to , we adopt the Galactic value.
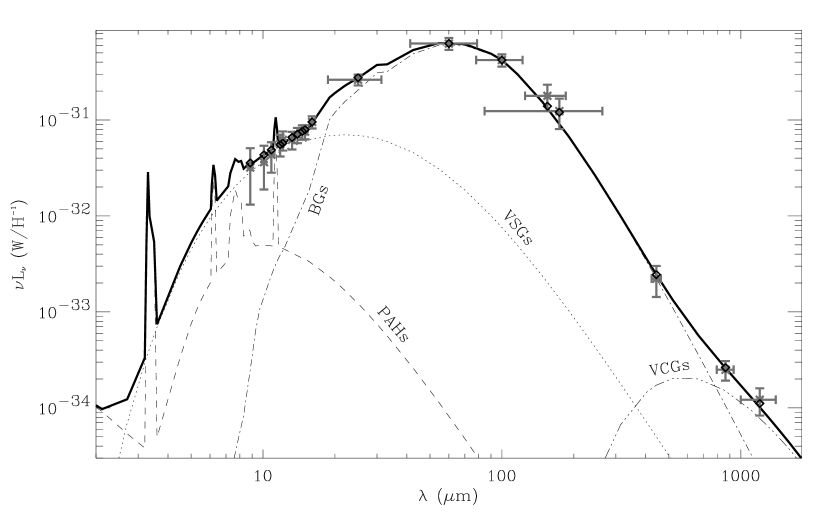
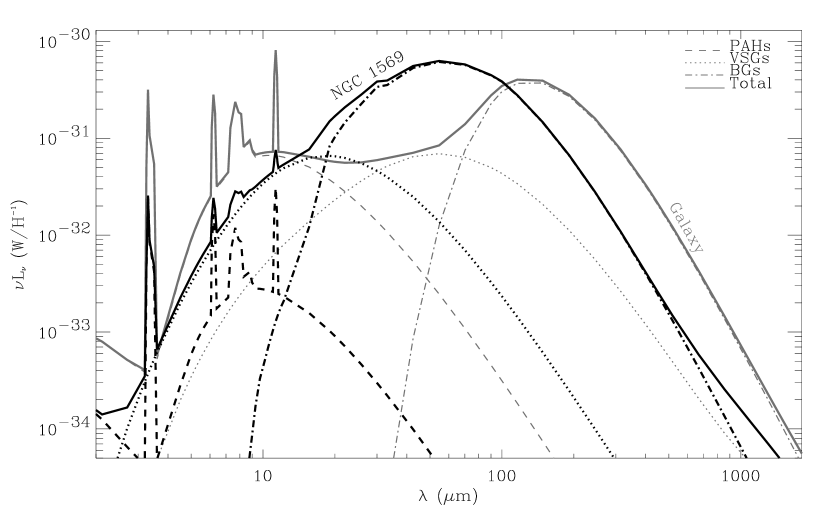
We are able to fit the SED quite well except in the millimetre wavelength range, where there is an excess that can not be explained by the three standard DBP90 components (see Fig. 5).

Although very cold dust is not the only likely explanation of this excess, we have added a fourth component modeled with a modified black-body to describe it. We call this component Very Cold Grains (VCGs). We discuss the other possible origins and the consequences of this excess in Sect. 4.3. The monochromatic flux radiated by the VCG component in a sphere of radius is given by:
| (4) |
where is the total mass of hydrogen in the galaxy, , and are the reference wavelength, the absorption coefficient at and the mass density of the grains. This VCG radiated flux depends on three variables: the temperature, , the emissivity index, , and the mass abundance of the grains, (we adopted typical values: , , if and if ). As we have only three data points to constrain the submillimetre-millimetre wavelengths regime of the SED (450 , 850 and 1.2 mm), we consider a way to fix the value of one parameter to avoid the degeneracy. Since the best solution requires a relatively flat slope, we fix for the solution. Setting gives us an unphysical solution with a maximum temperature of 3 K. Our emissivity index of 1 is lower than that found by Dunne & Eales (2001) for a sample of IR-bright galaxies (). However, the assumption of a lower is reasonable in light of the fact that Agladze et al. (1996) measure the absorption coefficient of cosmic dust analog grains and find that over the temperature range of 1.2-10 K, decreases with temperature. Thus, the mass abundance, , and temperature, T, remain the only free parameters governing the VCG properties.
4.1.2 What constraints can we put on the dust properties ?
Our best fit of the observed SED is shown in Fig. 5. The values of the parameters corresponding to the best fit for the 4 component model are summarized in Table 4.
| PAH | VSG | BG | VCG | |||||
|---|---|---|---|---|---|---|---|---|
| Milky | NGC | Milky | NGC | Milky | NGC | NGC | ||
| Way | 1569 | Way | 1569 | Way | 1569 | 1569 | ||
| 4 Å | 4 Å | 12 Å | 12 Å | 150 Å | 22 Å | T | ||
| 12 Å | 12 Å | 150 Å | 78 Å | 1100 Å | 1100 Å | 1.0 | ||
| 3 | 3 | 2.6 | 4.0 | 2.9 | 6.3 | |||
This corresponds to with 9 degrees of freedom. In order to quantify the reliability of the grain properties deduced from our model, we attempt to estimate, as conservatively as possible, the errors on these parameters.
We investigated the two possible sources of uncertainties: the sensitivity of the model itself to certain parameters, and to the value of the average radius () which influences the radiation field intensity. First, we estimate the errors on the goodness of the fit, by quantifying the departure of the model from the observations. We independently vary each parameter to fit the extreme cases allowed by the error bars. For example, the VSGs are constrained mainly by the observations from 8 to 16 . Thus, we made 4 extreme fits of the VSGs: one through the upper edges of the error bars, one through the lower edges, one through the upper edge of the error bar at 8 and the lower edge at 16 , and one through the lower edge at 8 and the upper edge at 16 . This gives us an idea of the sensitivity of the model to the physical properties. Second, the model was solved for the two extreme values of the radius ( and defined in Sect. 3.1). These two extreme cases give us an idea of the influence of the geometry (and also of the ISRF) on the dust properties. Figure 7 demonstrates the effect of the assumed radius on the grain size distributions.
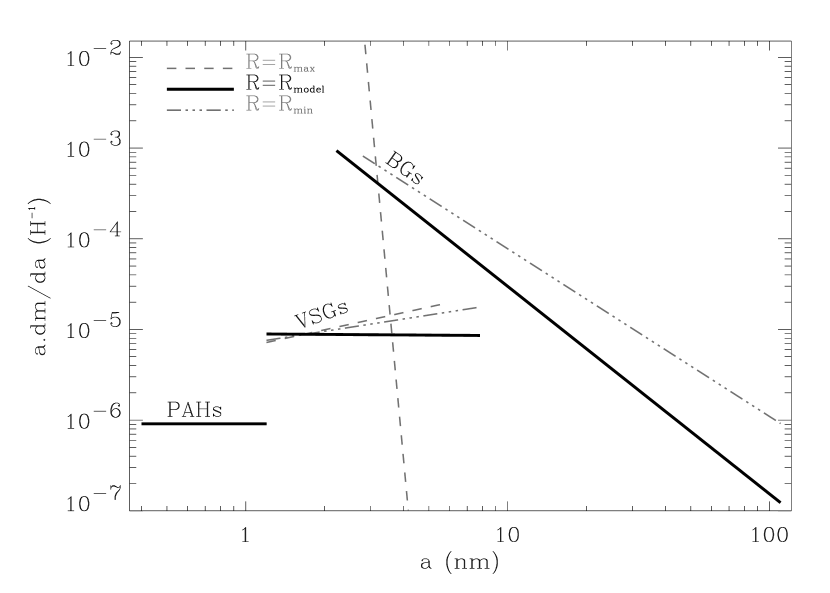
Table 5 contains the ranges of the physical parameters for the dust components given the sources of uncertainty from the fitting and the geometry. The PAH and VSG dust parameters are not very sensitive to the assumed geometry but are relatively sensitive to the fitting. For these cases, can change, at most, by a factor of 3. The best estimate shows a flat size distribution for the VSGs, and a small slope for the 2 extreme geometry cases (Fig. 7). The slope of the BG size distribution, however, is very sensitive to the assumed geometry. If is increased to , the size distribution shows an approximately constant size of nm (shown as the near vertical dashed line in Fig. 7), with a deficit of larger grains. When the dust is located farther from the stars, the size of the grains must be smaller to reach the same temperature, which is constrained by the observations.
| Lower limit | Upper limit | ||
|---|---|---|---|
| PAH | |||
| VSG | |||
| Å | Å | ||
| BG | |||
| Å | Å | ||
We treat the sensitivity of the parameters of the VCGs separately. Indeed, the temperature of the VCGs is a very important parameter, which has major consequences for the derived dust mass, and is only constrained by two data points. In this case, the temperature is strongly dependent on the emissivity index, however we excluded in Sect. 4.1.1 to avoid unphysical solutions. The temperature does not depend on the radiation field since we added this fourth component as a modified blackbody. The best fits within 1 variation give a range of temperatures: . The abundances corresponding to this temperature range are .
4.1.3 The dust properties - what are the consequences?
The dust properties deduced from this study differ from those of normal, more metal rich galaxies like the Milky Way. If we compare the shape of the dust SED of NGC 1569 to the SED of the Galaxy (Fig. 8), we notice the lack of PAHs. Moreover, the VSG component in the Galaxy and in NGC 1569 emit roughly similar energies, as do the BG components in both galaxies. However, this energy is emitted at shorter wavelengths in NGC 1569 than in the Galaxy since these grains are in a more energetic environment. On the long-wavelength side of the SED, the energy emitted from the Galaxy is times higher than that of NGC 1569. Even though the excess in the submm does not contribute much to the global energy budget of NGC 1569, most of the dust mass resides in this excess while in the Galaxy most of the dust mass is in the BG component.
The dust size distribution and extinction curve
These differences noted above are reflected in the size distribution of the grains.

Figure 9 compares the mass spectrum of the best solution of the 3 DBP90 dust components in NGC 1569 with that of the Galaxy. One significant difference is that the BGs in NGC 1569, are smaller overall compared to those of the Galaxy. The dust mass is concentrated in grains of smaller sizes in NGC 1569, , and the dust mass in large grains is almost negligible. In this case, what we called Very Small Grains and Big Grains have similar sizes but these names are maintained to be consistent with the original DBP90 model. However, we should call these two components carbonaceous grains and silicate grains respectively.
The size distribution of grains in NGC 1569 is consistent with that of grains which have been affected by shocks. Figure 10 illustrates the effect of shocks on the size distribution of the carbon and silicate grains in NGC 1569 (Jones et al. 1996).

Both distributions have the same shape even though quantitatively, the cut-off does not occur at the same grain size. The disagreement of the shock model with the precise shape of the NGC 1569 dust size distribution reflects our ignorance of the initial size distribution in NGC 1569, but the effect is qualitatively the same. The dust mass is transferred from large to small grains via shattering in grain-grain collisions in shock waves. NGC 1569 has recently experienced a large number of supernovae (Israel & de Bruyn 1988; Waller 1991; Greve et al. 2002), thus supernova-generated shock waves should be common in the ISM of this galaxy.
The presence of smaller grain size distributions, that dominate the global IR emission in dwarf galaxies, is opposite to the deduced dust properties in AGNs (e.g. Laor & Draine 1993; Maiolino et al. 2001). In the case of AGNs, dust destruction effects due to sublimation or thermal sputtering can explain the absence of small grains in the hostile AGN environment, leaving only the larger, more robust grains. Although similar effects could be present in the hard radiation field of NGC 1569, the effects of shocks in redistributing the dust size distribution appears to be dominant. However, most of the dust mass is in the VCG component and we cannot yet deduce the size distribution of these grains, until such time as the submm/mm wavelength range of the SED is observed in more detail. We give a rough estimate of the average size of the VCGs in Sect. 4.3.
Due to the small grain sizes in the PAH, VSG and BG components, most of the grains are stochastically heated and are not in thermal equilibrium with the radiation field. Table 6 contains the temperature range of each component for the maximum and minimum sizes compared to Galactic values.
| NGC 1569 | Milky Way | ||||
|---|---|---|---|---|---|
| PAH | 2.7 K | 9200 K | 2.7 K | 4400 K | |
| 2.7 K | 1800 K | 2.7 K | 1100 K | ||
| VSG | 2.7 K | 890 K | 2.7 K | 630 K | |
| 2.7 K | 160 K | 2.7 K | 78 K | ||
| BG | 2.7 K | 230 K | 15 K | 22 K | |
| 28 K | 28 K | 17 K | 17 K | ||
Stochastic heating is a very important process that must be taken into consideration in dust models applied to dwarf galaxies. Using models which assume modified black bodies for dust emission even up to FIR wavelengths in dwarf galaxies, when the grains can be thermally fluctuating, can result in an underestimate of the dust mass. We have compared the grain radii at the transition between thermal equilibrium and stochastically radiating dust () in NGC 1569 and in the Galaxy. First, we compute the average energy of a photon, ,
| (5) |
where , is the absorption efficiency of a grain of radius and is the speed of light. Second, we calculate the temperature of the dust, , following a single absorption of a photon of energy :
| (6) |
using the expression for the specific heat capacity, , for silicate grains given by Draine & Anderson (1985). The transition occurs for radii where the cooling time of the dust, , is equal to the photon absorption time, , which can be estimated as follows:
| (7) |
is the intensity from Fig. 15. and are plotted in Fig. 11 for NGC 1569 and the Galaxy.

We find that the transition occurs at nm in NGC 1569 and nm in the Galaxy. In other words, grains larger than , for a given ISRF, will be in thermal equilibrium with the radiation field and smaller than , will be stochastically heated. Alternatively, we can show that the order of magnitude of in the Galaxy is roughly twice in NGC 1569. If we assume that is the same in both cases and that we are in the regime where is independent of , then we see that ( being the integrated luminosity of the ISRF) and that depends only on . From the radiation fields in Fig. 15, we know that is roughly 10 times larger in NGC 1569 than in the Galaxy. Consequently, we expect that the transition radius in the Galaxy would be times the transition radius in NGC 1569, which is the correct order of magnitude. This result means that grains are stochastically heated at larger sizes in the Galaxy than in NGC 1569. However, the size distributions are different. Thus, in NGC 1569, most of the grains are stochastically heated since the dust mass (PAH, VSG and BG) is concentrated in small sizes and in the Galaxy, most of the emission originates in grains reaching thermal equilibrium since the dust mass is concentrated in large grains.
As a result of the difference in the grain size distribution, the extinction curve of NGC 1569 is noticeably different from that of the Galaxy (Fig. 12). This extinction curve consists only of the three standard DBP90 components and does not take into account the extinction due to the VCGs since we do not know the size distribution of this dust component. However, the energy emitted by the VCGs is very weak ( of the total energy radiated by the dust from MIR to mm wavelengths) thus the extinction due to this component should be very weak also. The magnitude of the extinction is lower in NGC 1569 than the Galaxy at all wavelengths. Our iterative process gives . This corresponds to the case where all the dust mass of the three DBP90 model dust components is located in front of the stars. The effective deduced from the energy balance, is , less than the value , deduced by Devost et al. (1997) from the line ratio toward the main body of the galaxy. However, they assumed Galactic extinction properties to derive this value. Figure 12 clearly shows that if we normalise the extinction curves of the Galaxy and NGC 1569 at the V wavelength, the UV slopes are very different indicating higher energy absorption in NGC 1569. Thus, to obtain the same energy absorption, the adopted with the Galactic properties should be higher, which is consistent with Devost et al. (1997). In a general way, using Galactic extinction properties instead of the synthesized extinction curve of NGC 1569, when both are normalised by , gives an erroneously lower by a factor as low as .
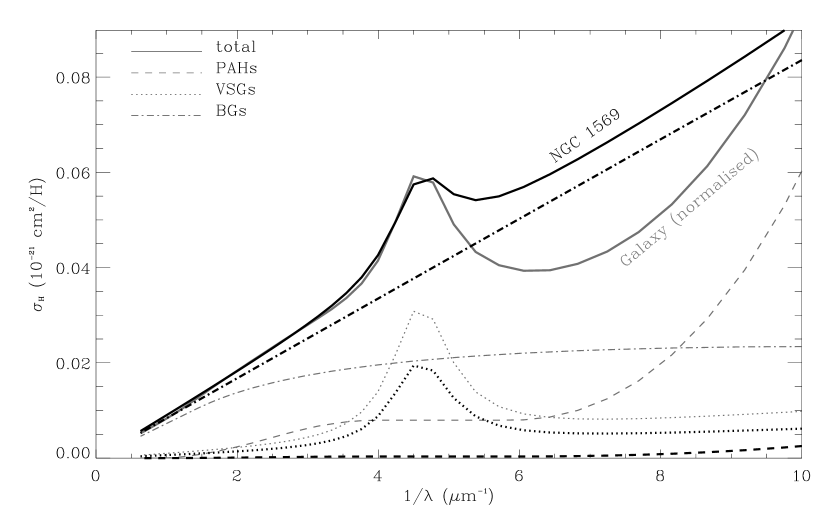
We notice in Fig. 12 that the lack of PAHs induces a UV rise in the extinction curve that is quite linear, due to the dominant effect of the BGs in the FUV rise and that the small size of the more abundant grains (BGs) results in a relatively steeper extinction curve. The bump at 2175 Å is weaker in NGC 1569 than in the Galaxy, due to the dominance of the BGs over the VSG component. This peculiarity is also observed in the Large Magellanic Cloud (Fitzpatrick 1985) extinction curve which has a metallicity similar to NGC 1569. Figure 13 compares the synthesized extinction curve for NGC 1569 to the observed extinction curves for the LMC (Koornneef & Code 1981; Nandy et al. 1981), the SMC (Prévot et al. 1984) and the Milky Way (Seaton 1979). The similarity of the modeled extinction curve with that of the LMC is striking. However, the intensity of the bump is, of course, model dependent. Nevertheless, this bump should be weaker compared to the continuum since the slope of this continuum is steeper.

The dust mass
We determine the dust mass of NGC 1569 to be , 15 to 20 times more than that found previously by Lisenfeld & Ferrara (1998), who only had IRAS data available, and times more than that found by Lisenfeld et al. (2002) who use the DBP90 dust model, but assume Galactic dust grain properties and the Galactic ISRF. Our results show that the BGs and VCGs dominate the dust mass, with very little contribution from the VSGs and PAHs, 40 to 70 of the total dust mass resides in the VCG component. The total gas-to-dust mass ratio, , inferred for NGC 1569, assuming a total mass of hydrogen (Israel 1997) and , is between and (Table 7). If we assume only that , we should find, for NGC 1569, which is in agreement with our best value of . However if we use the law from Lisenfeld & Ferrara (1998), , we find and a lower limit of which would be correct if we did not have very cold dust. It is not surprising since the model of Lisenfeld & Ferrara (1998) does not take into account submillimeter data so they did not include very cold dust. We also deduce the dust-to-metal mass ratio which is in the Galaxy and in NGC 1569. The smaller value found in NGC 1569 could reflect the fact that shocks can erode and destroy the dust, transferring more metals into the gas phase.
| Dust mass | Gas-to-dust | Dust-to-metal | |
| () | mass ratio | mass ratio | |
| PAH | 190 | ||
| VSG | |||
| BG | |||
| VCG | |||
| TOTAL | |||
| - without VCGs | |||
| - with VCGs |
The spatial distribution of the dust from the observations
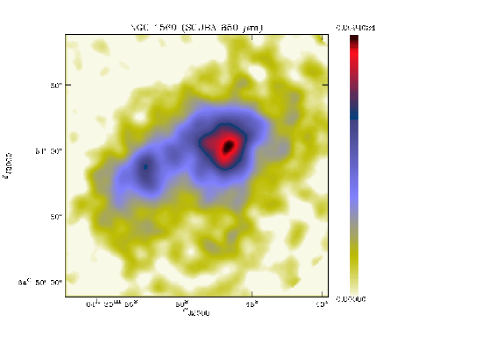
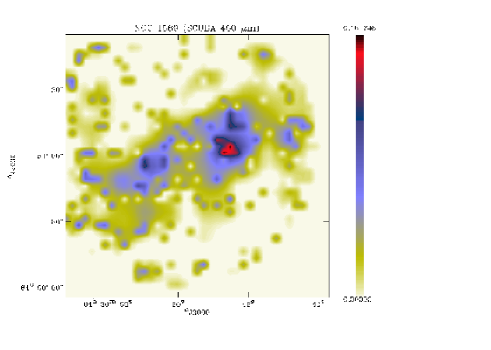
Our multi-wavelength maps can be used to study the spatial distribution of the various dust components. At first glance, the morphology of the submm/mm maps look similar to that of the ISOCAM-LW3 and LW6 (see Fig. 2). Lisenfeld et al. (2002) conclude that in NGC 1569 both the MIR and submillimetre/millimetre emission are due to the same dust component. Figure 2 shows the spatial distribution of the ratio of LW6 (which traces the PAHs) to SCUBA-850 (which traces the cold dust, both BG and VCG) and the ratio of LW3 (which traces the VSGs) to SCUBA-850 (cold dust). These ratio maps do not show a flat distribution. They demonstrate that the distribution of the hot dust emission from the VSGs is definitely more concentrated toward the region of the two most prominent H peaks whereas the cold dust emission and the PAHs are more extended. The PAH emission is more extended than the VSG’s but less so than the cold dust emission. This is consistent with the simple view of an HII region and a surrounding photodissociation region/molecular cloud. Hot dust emitting at is seen to peak inside HII regions in the Galaxy, while the PAHs peak at the photodissociated edges of molecular clouds (e.g. Cesarsky et al. 1996; Abergel et al. 2000; Klein et al. 1999). As the colder dust will be excited by similar sources, the morphology of the submm maps will appear to resemble the star formation tracers at these spatial scales. In addition, the lower metallicity ISM of NGC 1569, tends to be clumpier, due to the lower dust abundance and, hence, larger mean-free path of photons and, subsequently, larger photodissociation effects. This clumpy effect means that the pervasive non-ionising radiation will be effective at exciting the surrounding colder dust. We find that, contrary to commonly-made assumptions, the bulk of cold dust in dwarf galaxies is not necessarily concentrated toward the outer regions, but is distributed between the star formation sites.
4.2 The synthesized ISRF
The best synthesized global ISRF for NGC 1569 (Fig. 14) is a combination of two single-bursts with ages 4 and 100 Myr. The young component represents the recent starburst which has produced the two super-star-clusters (SSCs). These SSCs have populations of ages (Origlia et al. 2001), consistent with our younger population. The older component we use represents the underlying population present before the more recent starburst. Although other older populations might be present, they do not dominate the global ISRF for this galaxy.
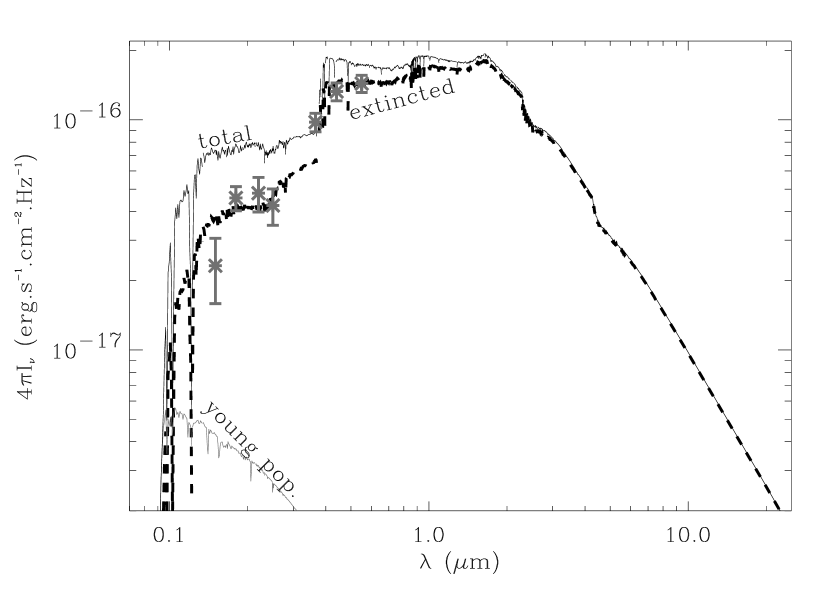
Compared to the Galaxy, the global ISRF modeled for NGC 1569 is much harder in the UV range due to the contribution from the very young population (figure 15). At , the ISRF from NGC 1569 is higher by more than an order of magnitude compared to the Galaxy. The ISRF of the Galaxy and other spiral galaxies is dominated by the cooler disk material while in NGC 1569, and other starbursting dwarfs, it is the star formation activity that dominates the global ISRF. This is also evident from the global MIR characteristics (Madden et al. 2003) and is also the case for other dwarf galaxies (Galliano et al. 2003). Therefore, when modeling the dust emission from dwarf galaxies, it is not valid to assume the Galactic ISRF.

4.3 An explanation for the millimetre excess
There are large uncertainties in the physical properties of the VCGs. Such a large mass of dust locked up in very cold dust is not unlikely. However, there are some questions to address concerning the nature of these dust grains. How can a population of such very cold dust exist on galactic scales? How can this dust be so cold? Is very cold dust seen in other galaxies? In this section, we explore various hypotheses to explain the millimetre excess.
We can also invoke a non-dust effect (i.e. molecular line and/or radio continuum contamination) or a cross-calibration problem. The non-dust effects have already been taken into account (see Sect. 2.1). Moreover the SED of II Zw 40 (Galliano et al. 2003) shows the same trend in the millimetre regime, perhaps even suggesting that this excess might be a general feature of starbursting dwarf galaxies.
4.3.1 Very cold dust in the literature
A very cold component has been suggested for the Galaxy. For example, Reach et al. (1995) found a component with K in some Galactic continuum spectra. More recently, Boulanger et al. (2002) published COBE and Archeops data for the Galaxy that implies a K dust component (with ). This result has not yet been independently confirmed. This component of very cold dust appears to follow the HI gas, suggesting that it is associated with the cold neutral medium. Dupac et al. (2002) reported PRONAOS observations of the M 17 complex and found dust as cool as 10 K in some cold clumps. Popescu et al. (2002) observed a sample of 63 late-type galaxies in the Virgo cluster using ISOPHOT. Although their wavelength coverage is limited, observing only up to , they find a cold dust component is present in most cases, with temperatures as low as 10 K in irregular and blue compact dwarf galaxies.
James et al. (2002) calculated dust masses for galaxies from the submillimeter emission, assuming that the fraction of metals incorporated in the dust in galaxies is a universal constant. For NGC 1569 they determine a dust mass of , which is similar to the mass that we derive ( ).
Lisenfeld et al. (2002) published a dust SED for NGC 1569 computed with the standard DBP90 model. They found no submillimetre excess and discount the presence of very cold dust since they were able to explain the submm emission with the VSGs. We now discuss the reasons for our different results. We find that the use of the CVF spectrum in the MIR provides an important and tight constraint on the slope of the VSG size distribution in our model. Lisenfeld et al. (2002), however, characterise the MIR wavelength regime with only a single 12 IRAS data point. This effects the fit significantly.
In addition to the different observational constraints used to construct the observed SED, Lisenfeld et al. (2002) used the DBP90 model in a very different, more limited way than that presented here. Since we have more data to constrain the DBP90 model, we allow the grain properties to differ from those of the original DBP90 model, which was constructed to explain the Galactic dust emission. Lisenfeld et al. (2002) use the original Galactic dust parameters to obtain their fit. Their input ISRF is that of the Galaxy, which is much softer than that of NGC 1569 (see section 4.2), and is scaled up by a factor of . They did not investigate the dust size distribution parameter space. Our results are based on a evaluation to obtain the best fit. Lisenfeld et al. (2002) conclude that the VSG component alone accounts for the FIR and submm and mm continuum. In our model, such a solution was attempted, but resulted in a very poor since the MIR observations could not be well-fitted.
4.3.2 Optical properties of BGs
We have investigated other means to increase the emissivity in the submm, instead of invoking a VCG component. A change in the emissivity slope could be due to a change in the optical properties of the big grains. Indeed, Mennella et al. (1998) measure the absorption coefficient per unit mass () of cosmic dust analog grains, over the temperature range K. The laboratory experiments, show a decrease of the emissivity index, , as the temperatures increases, effecting the for wavelengths . Our big grains reach higher temperatures than those of the Galaxy (Table 6) and, in the standard model, for . We attempted to roughly reproduce the effect observed by Mennella et al. (1998) using for with . However, this modification failed to give an acceptable fit to the data in the submm/mm wavelength range.
Grain-grain coagulation, leading to porous aggregates, can increase dust emissivities at submm wavelengths. This has been invoked to explain the elevated opacity of circumstellar dusty envelopes and dense molecular cores (Ossenkopf & Henning 1994; Stepnik et al. 2003). However, this effect is localised and has not yet been seen on galactic scales, as would be necessary to explain the data presented here.
4.3.3 Embedded dust as the source of the mm excess
The properties of the dust differ considerably from one region to another in a galaxy, depending on the nature of the environment (HII regions, cirrus, dense core, etc.). The DBP90 model has been constructed to describe the diffuse ISM of the Galaxy. Consequently, applying it to an entire galaxy like NGC 1569 is not straightforward. However, NGC 1569 is a peculiar galaxy: it is a starbursting dwarf and its emission properties show that it resembles a giant HII region (particularly in the MIR; see Madden et al. 2003). Moreover, the emission from hot dust is enhanced relative to the cold dust in the starburst regions (see Fig. 2). This departure could explain our inability to fit the SED with only the three standard components. The various phases of the ISM could have very different temperatures and technically should not be treated as if there were the same physical region.
If we assume that the very cold dust is made up of grains deeply embedded in clouds, where the UV-optical radiation can not easily penetrate, the dust FIR-mm emission could be a heating source for this dust component (Fig. 16).
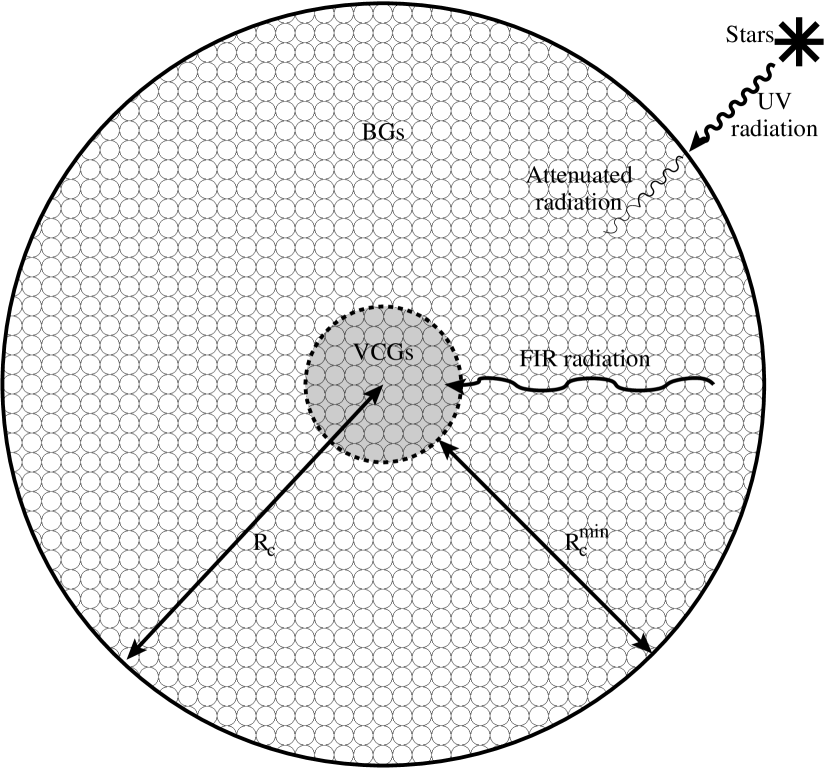
We can make a rough estimate of the temperature of the very cold grains (i.e, the VCGs) to verify this explanation. Let us assume that the photons which heat the VCGs are due to the emission from the BGs, simply modeled as a blackbody, made of grains of radius , temperature (corresponding to the peak wavelength of the BG component), mass and emission coefficient , being the frequency where the maximum emission by the BGs occurs. These are the parameters that we derived from our fitting of the SED of NGC 1569. The VCGs are modeled with a blackbody of temperature , mass and absorption and emission coefficients , , being the frequency where the maximum emission by the VCGs occurs and are made of grains of radius embedded in a clump of radius . The luminosities emitted by these two components, and , can be determined from the number of grains of each species, ( being either BG or VCG and being the specific mass densities), and the luminosity radiated by only one grain . The total luminosity is then (=BG or VCG). The ratio is
| (8) |
and its numerical value from the model (Fig. 5) is . Using the same method, the heating and cooling luminosities for the VCGs are:
| (9) |
which is equivalent to and . This factor of is due to the fact that BGs do not radiate only in the direction of the VCGs inside the clump, they also radiate away without intercepting the VCGs. The powers absorbed and emitted by one VCG grain are:
| (10) |
Equating absorption and emission gives:
| (11) |
In the Eq. 11, the two unknowns are and . We can deduce by coupling Eqs. 8 and 11:
| (12) |
To be consistent with our model, which assumes , the VCGs are carbonaceous, and . To determine the order of magnitudes of the efficiencies, we refer to Draine & Lee (1984). For the BGs we use the astronomical silicate values at , . This is in the regime where does not depend on the grain radius. For the VCGs, we used graphite values. The coefficients are: at and at . Eq. 12 gives us the radius of the VCGs, nm is also in the same regime where is independent of a. With this simple analytical model, the temperature of the VCGs is estimated to be . Thus, the hypothesis of very cold dust hidden in clumps bathed by the FIR radiation from warmer grains is consistent and gives the appropriate order of magnitude of . Moreover, Bernard et al. (1992), using a radiative transfer model coupled with DBP90 in the Galactic case, showed that the temperature of the dust deeply embedded in a dense cloud is K. Radiative transfer may indeed turn out to be the key to understanding this property of the dust spatial distribution in these galaxies.
We can attempt to estimate the clump radius (). First, we can determine a minimum clump radius () by estimating the optical depth required to shield the stellar radiation, since in the above scenario, the VCGs are heated only by the envelope of BGs. We consider that the VCGs are screened by the BGs when the stellar energy seen by the VCGs is at most equal to the energy emitted by the VCGs. Given our SED and the extinction curve of Fig. 12, the optical depth in the V band needed is . The average wavelength of the stellar radiation is . At this wavelength, the optical depth needed is . At the wavelength where the BGs emit (), the optical depth is , thus we verify that the shell is optically thin to this radiation. The contrast density between the clumps (index hereafter) and the interclump media (index hereafter) is . The minimum radius of a clump is the radius required to reach the optical depth of . If we assume that only the BGs are responsible for the shielding,
| (13) |
where is the density of the BGs in the clumps and from Draine & Lee (1984). The actual clump size is difficult to estimate without some assumptions for or . Let us assume that is the homogeneous density cm-3 scaled by . From Eq. 13, we find that pc if , the extreme case, where there is only one clump, and pc if . To estimate the size of the VCG core, we require that it is optically thin to the BG radiation. The ratio between the mass of BGs and VCGs constrains the density of this core. The maximum radius of the VCG core is pc when , the number of clumps is 1 or 2 and the volume filling factor . When , the radius of the core is pc, the number of clumps is between 200 and 300 and the filling factor . This rough estimation tends to imply that there would be a small number of dense clumps in this galaxy. Berkuijsen (1999) gives a range of for the H2 volume filling factor of the Galaxy which is greater or equal to the range we find in NGC 1569. This clumpy characteristic is also consistent with relatively bright 158 [CII] emission seen in NGC 1569 and in low-metallicity environments, in general (Jones et al. 1997).
5 Summary and conclusions
Our modeling of the dust SED in NGC 1569 suggests that the nature of the dust in low-metallicity environments differs from that of metal-rich galaxies.
-
1.
We have presented new SCUBA images at 450 and 850 . With additional data from the literature we constructed the observed dust SED for this galaxy.
-
2.
We have used a stellar evolution model (PEGASE), a photoionisation model (CLOUDY) and a dust model (DBP90) to compute a self-consistent theoretical dust SED, independently synthesizing a global ISRF from UV-to-optical observations with further constraints from MIR-ionic lines. The DBP90 model has been used to investigate a large range of dust parameters, making the link with the extinction deduced from the dust model and the deredenning of the UV-to-optical data.
-
3.
The synthesized global ISRF is consistent with a very young population produced by the recent starburst and an older population tracing the underlying stars of the galaxy.
-
4.
We find very low abundances of PAHs, and smaller overall sizes of grains emitting in the MIR and FIR, compared to the Galaxy. Due to the small sizes, most of the grains are in a stochastic heating mode, and not in thermal equilibrium with the radiation field - even grains emitting at FIR wavelengths.
-
5.
The presence of a millimetre emission excess can be explained by ubiquitous clumps of very cold (5 to 7 K) dust grains with . These very cold grains can be responsible for 40 to 70 of the total dust mass in the galaxy, . The absence of important submm/mm observations can result in, at least, an order of magnitude of dust mass being missed.
-
6.
The gas-to-dust mass ratio ranges from 740 to 1600, greater than that in the Galaxy, even taking into account the relatively large mass of very cold grains. The dust-to-metals mass ratio ranges from to , smaller than the Galactic value.
-
7.
From the dust size distribution, we generate an extinction curve for NGC 1569 (which has similar characteristics to that of the LMC). We also derive a synthesized radiation field and a wide range SED (UV - mm), for the global galaxy.
-
8.
The bulk of the cold dust traced by the submm/mm observations is distributed between star forming regions, not concentrated toward the outer regions of the galaxy. Our results are consistent with a clumpy medium and a filling factor lower than .
Due to the low metallicity of NGC 1569, the ISM would appear to be very clumpy, and this has important consequences for the dust models. From our detailed dust modeling of dwarf galaxies (see also Galliano et al. 2003), we caution that dust models assuming the Galactic dust size distribution, Galactic extinction curve and Galactic ISRF will be in error. Models not dealing with stochastic heating processes should be dealt with cautiously, as this is probably the most important physical process for dust heating in dwarf galaxies. Another caution that follows from this work is the importance of obtaining data longward of the FIR. This is presently easier said than done. However, in the near future we will have the capability to sample the submm/mm emission from galaxies in more detail, and with greater sensitivity, with SOFIA, ASTRO-F, Herschel, Planck and ALMA. Without a proper understanding of the submm/mm SED of galaxies, galaxy number counts could be incorrect since the excess submm/mm emission might erroneously be attributed to higher star formation activity in redshifted galaxies, instead of the presence of a large, very cold dust mass.
Acknowledgements.
We would like to thank René Gastaud, Hélène Roussel, Pierre Chanial and Marc Sauvage for their expert advice on ISOCAM data reduction; Jean-Luc Starck for useful discussions on data processing techniques; Bertrand Stepnik for his help on ISOPHOT data reduction and Martin Haas and Ulrich Klaas for their advise concerning the use of ISOPHOT data. We also thank David Hollenbach, François Boulanger, Ute Lisenfeld and Frank Israel for helpful scientific discussion. We are grateful to the referee, Eli Dwek, for his erudite comments that helped to improve the quality of the paper.References
- (1) Abergel, A., Bernard, J. P., Boulanger, F. et al. 2000, ISO Beyond Point Sources: Studies of Extended Infrared Emission, ed. R. J. Laureijs, K. Leech & M. F. Kessler, ESA-SP, 455, 119
- Agladze et al. (1996) Agladze, N. I., Sievers, A. J., Jones, S. A., Burlitch, J. M., Beckwith, S. V. W. 1996, ApJ, 462, 1026
- (3) Aloisi, A., Clampin, M., Diolaiti, E., Greggio, L., Leitherer, C., Nota, A., Origlia, L., Parmeggiani, G., Tosi, M., 2001, AJ, 121, 1425
- (4) Archibald, E.N., Wagg, J.W., Jenness, T., 2000, http://www.jach.hawaii.edu/JACdocs/JCMT/SCD/SN/002.2/
- (5) Arp, H., Sandage, A., 1985, AJ, 90, 1163
- (6) Bakes, E.L., Tielens, A.G.G.M., 1994, ApJ, 427, 822
- (7) Berkhuijsen, E. M. 1999, in Plasma Turbulence and Energetic Particles in Astrophysics, Eds. M. Ostrowski, R. Schlickeiser, p60
- (8) Bernard, J. P., Boulanger, F., Désert, F. X., Puget J. L. 1992, A&A, 263, 258
- (9) Biviano, A. et al., 1998, http://www.iso.vilspa.esa.es/users/expl_lib/CAM_list.html
- (10) Boulanger, F., Bourdin, H., Bernard, J. P. & Lagache, G. 2002 Infrared and Submillimeter Space Astronomy, ed. M. Giard, J. P. Bernard, A. Klotz & I. Ristorcelli, EAS Pub. Ser., 4, 151
- (11) Cannon, J.M., Skillman, E.D., Garnett, D.R., Dufour, R.J., 2002, ApJ, 565, 931
- (12) Claret, A. et al., 1998, http://www.iso.vilspa.esa.es/users/expl_lib/CAM_list.html
- (13) Coulais, A. & Abergel, A., 2000, A&AS, 141, 533
- (14) Cesarsky, C. J., Abergel, A., Agnese, P. et al. 1996, A&A, 315, L32
- (15) Cesarsky, D., Lequeux, J., Abergel, A. et al. 1996, A&A, 315, 309
- (16) Crowther, P.A., Beck, S.C., Willis, A.J., Conti, P.S., Morris, P.W., Sutherland, R.S., 1999, MNRAS, 304, 654
- (17) Dale, D. A., Helou, G., Neugebauer, G. et al. 2001, ApJ, 122, 1736
- (18) Désert, F.X., Boulanger, F., Puget, J.L., 1990, A&A, 237, 215
- (19) De Vaucouleurs, G., De Vaucouleurs, A., Corwin, H.G., Buta, R.J., Paturel, G., Fouqué, P., 1991, Third Reference Catalogue of Bright Galaxies, Springer-Verlag, New York
- (20) Devost, D., Roy, J.R., Drissen, L., 1997, ApJ, 482, 765
- (21) Draine, B. T. & Anderson, N., 1985, ApJ, 292, 494
- (22) Draine, B. T. & Lee, H. M., 1984, ApJ, 285, 89
- (23) Dunne, L., Eales, S.A., 2001, MNRAS, 327, 697
- (24) Dupac, X., Giard, M., Bernard, J.-P. et al. 2002, A&A, 392, 691
- (25) Ferland, G.J., 1996, HAZY, a brief introduction to CLOUDY, University of Kentucky, Department of Physics and Astronomy Internal Report
- (26) Fioc, M. & Rocca-Volmerange, B., 1997, A&A, 326, 950
- (27) Fitzpatrick, E.L., 1985, ApJ, 299, 219
- (28) Gabriel, C., Acosta-Pulido, J., Heinrichsen, I., Morris, H. & Tai, W.M., 1997, ASP Conference Series, Vol. 125
- (29) Galliano, F., Madden, S.C., Jones, A.P., Wilson, C.D., Bernard, J.-P., Le Peintre, F., 2002, Infrared and Submillimeter Space Astronomy, EDP Sciences, ed. M. Giard, J.P. Bernard, A. Klotz and I. Ristorcelli
- (30) Galliano, F., Madden, S.C., Jones, A.P., Wilson, C.D., Bernard, J.-P., Le Peintre, F., 2003, in preparation
- (31) González Delgado, R.M., Leitherer, C., Heckman, T., Cerviño, M., 1997, ApJ, 483, 705
- (32) Hirashita, H., Tajiri, Y.Y., Kamaya, H., 2002, 388, 439
- (33) Holland, W.S., et al., 1999, MNRAS, 303, 659
- (34) Hunter, D.A., Gallagher, J.S., Rice, W.L., Gillett, F.C., 1989a, ApJ, 336, 152
- (35) Hunter, D.A., Thronson, H.A.Jr., Casey, S., Harper, D.A., 1989b, ApJ, 341, 697
- (36) Hunter, D. A., Gallagher, J. S. III 1989, Sci, 243, 1557
- (37) Israel, F.P., 1988, A&A, 194, 24-32
- (38) Israel, F.P. & de Bruyn, A.G., 1988, A&A, 198, 109
- (39) Israel, F.P. & Van Driel, W., 1990, A&A, 236, 323
- (40) Israel, F.P., 1997, A&A, 328, 471
- (41) Izotov, Y. I., Lipotevski, V. A., Chaffee, F. H., Foltz, C. B., Guseva, N. G., Kniazev, A. Y., 1997, ApJ, 476, 698
- (42) James, A., Dunne, L., Eales, S. & Edmunds, M.G. 2002, MNRAS, 335, 753
- (43) Jenness, T. & Lightfoot, J.F., 1998, ASP Conference Series, vol. 145
- (44) Jones, A.P., Madden, S.C., Colgan, S.W.J., et al., 1997 “Extragalactic Astronomy in the Infrared”, Editions Frontiers, ed. Thuan, T.X., & Van, J.T.T.
- (45) Jones, A.P., Tielens, A.G.G.M., & Hollenbach, D.J., 1996, ApJ, 469, 740
- (46) Klein, R., Henning, Th., Cesarsky, D. 1999, A&A, 343, L53
- (47) Koornneef, J. & Code, A.D., 1981, ApJ, 247, 860
- (48) Laor, A., Draine, B. T. 1993, ApJ, 402, 441
- (49) Lemke, D. et al., 1996, A&A, 315, L64
- (50) Lisenfeld, U. & Ferrara, A., 1998, ApJ, 496, 145
- (51) Lisenfeld, U., Israel, F.P., Stil, J.M., Sievers, A., 2002, A&A, 382, 860
- (52) Lutz, D. et al., 1996, A&A, 315, L269
- (53) Lutz, D., Spoon, H. W. W., Rigopoulou, D., Moorwood, A. F. M., Genzel, R. 1998, ApJ, 505, L103
- (54) Madden, S.C., 2000, NewAR, 44, 249-256
- (55) Madden, S.C., Galliano, F., Jones, A.P., Sauvage, M. 2003, to be submitted to A&A
- (56) Maiolino, R., Marconi, A., Salvati, M. et al. 2001, A&A, 365, 28
- (57) Martin, C.L., Kobulnicky, H.A., Heckman, T.M., 2002, ApJ, 574, 663
- (58) Meier, D.S., Turner, J.L., Crosthwait, L.P., Beck, S.C., 2001, ApJ, 121, 740-752
- (59) Melisse, J.P.M. & Israel, F.P., 1994, A&AS, 103, 391
- (60) Mennella, V., Brucato, J.R., Colangeli, L., Palumbo, P., Rotundi, A., Bussoletti, E., 1998, ApJ, 496, 1058
- (61) Nandy, K., Morgan, D.H., Willis, A.J., Wilson, R., Gondhalekar, P.M., 1981, MNRAS, 196, 955
- (62) Origlia, L., Leitherer, C., Aloisi, A., Greggio, L., Tosi, M., 2001, AJ, 122, 815
- (63) Ossenkopf, V., Henning, Th. 1994, A&A, 291, 943
- (64) Plante, S., Sauvage, M., 2002, AJ, 124, 1995
- (65) Popescu, C.C., Tuffs, R.J., Völk, H.J., Pierini, D., Madore, B.F., 2002, ApJ, 567, 221
- (66) Press, W.H., Teukolsky, S.A., Vetterling, W.T. & Flannery, B.P., Numerical Recipes in Fortran 90. Cambridge University Press, 1996
- (67) Prévot, M.L., Lequeux, J., Prévot, L., Maurice, E., Rocca-Volmerange, B., 1984, A&A, 132, 389
- (68) Reach, W.T., Dwek, E., Fixsen, D.J., Hewagama, T., Mather, J.C., Shafer, R.A., et al., 1995, ApJ, 451, 188
- (69) Roussel, H., Vigroux, L., Bosma, A., Sauvage, M. et al., 2001, A&A, 369, 473
- (70) Seaton, M.J., 1979, MNRAS, 187, 73
- (71) Siebenmorgen, R., Blommaert, J., Sauvage, M., Starck, J.L., 2000, ISOCAM handbook, http://www.iso.vilspa.esa.es/manuals/HANDBOOK/III/cam_hb/
- (72) Starck, J.L., Murtagh, F. & Bijaoui, A., Image Processing and Data Analysis: The Multiscale Approach. Cambridge University Press, Cambridge (GB), 1998
- (73) Starck, J.L. et al., 1999, A&AS, 134, 135
- (74) Stepnik, B., Jones, A.P., Abergel, A., Bernard, J.-P., Boulanger, F., Ristorcelli, I., 2003, in prep
- (75) Stickel et al., 2000, A&A, 359, 865
- (76) Thronson, H.A. & Telesco, C.M., 1986, ApJ, 311, 98
- (77) Thuan, T.X., Sauvage, M., Madden, S.C., 1999, ApJ, 516, 783
- (78) Tielens, A. G. G. M., Hollenbach, D. 1985, ApJ, 291, 722
- (79) Vacca, W. D., Johnson, K. E., Conti, P. S. 2002, ApJ, 123, 772
- (80) Waller, W.H., 1991, ApJ, 370, 144-157