Surface photometry of LSB edge-on galaxies
Abstract
We present results of surface photometry for eleven edge-on galaxies observed with the 6-m telescope at the Special Astrophysical Observatory of the Russian Academy of Sciences. The photometric scale length, the scale height, and the central surface brightness of the stellar disks for the galaxies were found using photometric cuts made parallel to the major and the minor axes for each galaxy. We show that four galaxies in our sample that were visually classified as objects of lowest surface brightness in the Revised Flat Galaxies Catalog have LSB (low surface brightness) disks. Stellar disks of our LSB galaxies are thinner than HSB (high surface brightness) ones. There is a good correlation between the central surface brightness of the stellar disk and its ratio of vertical to radial scales. The ratio of the disk photometric scales enables us to estimate the mass of the spherical galactic subsystem using results from numerical modeling. Combining our results with published rotation curves we determined the mass of dark halos for the galaxies in our sample. The LSB galaxies tend to harbor relatively more massive spherical subsystems than those of HSB’s. Indeed, we found no systematic difference between our LSB and HSB objects in dark halo masses considering it separately from the bulge. At the same time, the inferred mass/luminosity ratio for the LSB disks appears to be systematically higher, when compared to the ratio for HSB ones.
1 Introduction
One of the main features of the low surface brightness galaxies (LSB) which make them different from the ”usual” high surface brightness (HSB) galaxies is that they are considered to be dark matter dominated objects.
We conducted the study of a sample of several edge-on LSB and HSB galaxies in order to compare their photometric parameters (including the stellar disk thickness) and the relative mass of their dark halos.
2 Sample of galaxies and observations
Our sample consists of several objects taken from the Revised Catalog of Flat Galaxies ([1], RFGC hereafter). All those galaxies included to the catalog are highly inclined objects. We selected four objects of faintest surface brightness class as candidates to the LSB galaxies (according to [2]), and seven objects with intermediate and high surface brightness class as ”reference” HSB objects.
The surface photometry observations were made with the 6-m telescope at the Special Astrophysical Observatory (Russia). The large aperture of the telescope provided us with high angular resolution in images (0”.2/pix) together with a good sensitivity to the very faint regions of the galaxies. The chosen galaxies and the set of calibrating frames were taked during one observing run in December 2000 using R Johnson-Cousins photometric band.
The combined and calibrated R images were used to obtain the radial scale length of a galactic disk (), the disk vertical scale heights (, assuming law), the ”face-on” central surface brightness () of the disk (see [3] for the details), and the bulge to disk luminosity ratio . The final value of was corrected for the extinction in our Galaxy (according to the LEDA). The fitting profiles have been convolved with the atmospheric smearing function.
The distribution of values indicates the presence of two subsamples: those with values greater than 23.5 which we defined as LSB and those with higher surface brightness designated HSB in this work. Note that all galaxies of the faintest surface brightness class (according to the RFGC) were included to our LSB objects.
Although our sample enables us to compare of the photometric parameters of LSB and HSB disks, the sample is very limited. We also incorporated one more sample of edge-on galaxies whose photometric parameters have been published by Barteldrees etc. [4]. The authors used the similar passband and the same fitting functions to extract the photometric parameters.
3 LSB versus HSB: the vertical scale height of galactic disk
as a new
feature to compare.
As it was shown in [2] and [5], the galaxies of lower surface brightness tend to show the higher ratio. However, mostly HSB galaxies were considered in those previous studies. Here we show the dependence of on the central surface brightness for our sample. Our galaxies are denoted by the squares in Fig.1. The open squares are for the HSB subsample whereas the filled ones designate the LSB galaxies. The galaxies taken from [4] are plotted as crosses. Futhermore, the near-infrared (K band) sample of edge-on galaxies from [5] is available for the comparison (the 2MASS sample hereafter). The systematic difference between the R and K images in (1.4 times, see [6] for details), in the surface brightness (2.4 , see [7]), and the internal extinction (1.2 ) were taken into account.
Fig.1 shows all three samples together. The 2MASS sample is denoted by the small filled triangles. A trend in Fig.1 is seen well, in average of 2 mag difference in leads to 1.5 change in the ratio of the scales. Note that there is no correlation seen when or were drawn against separately.
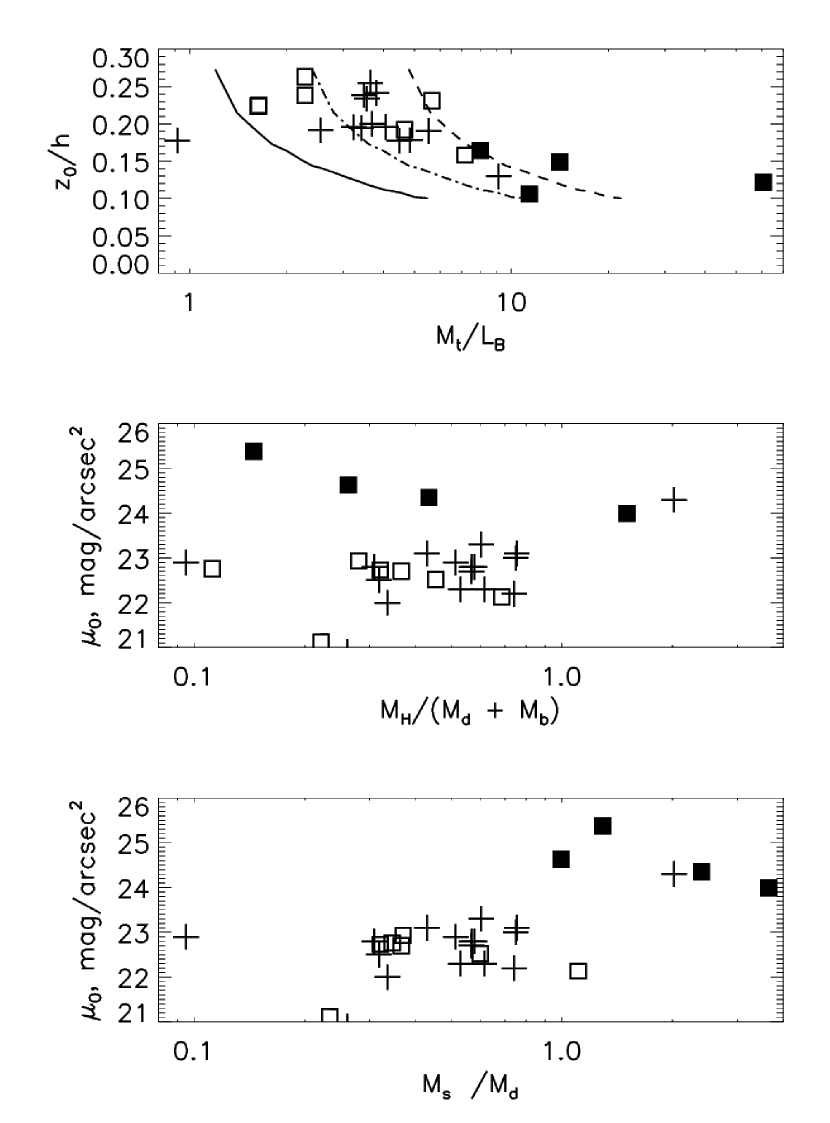
Following [6], we calculated the ratio of total mass to B-band disk luminosity : . Here is the maximum of rotation curve (taken from the LEDA). The value of is inferred from the absolute B-magnitude of a galaxy taken from the LEDA and corrected for the internal absorption. In Fig. 3a one can see the values of plotted versus the ratio . The notation in the figure is the same as in Fig.1. The three curves in Fig.3a are the same as in Fig.2 which were recalculated for the values of the mass to luminosity ratio of 1, 2 and 4. As it is seen in Fig.3a, most of the galaxies have a reasonable value of between 1 and 4. The mass to luminosity ratio is higher systematically for our LSB galaxies in comparison with HSB ones.
Since the luminosity ratio reflects the mass ratio, the mass of the dark halo can be estimated from the dependence in Fig. 3. We drew the ratio of dark to luminous matter for our galaxies ishown n Fig.3b. Here we designate the bulge mass as . We show the ratio of ”dark” to ”luminous” mass for our galaxies. Here we designate the bulde mass as . We assume that the bulge and the disk have roughly the same . Surprisingly, there is no systematic difference between the values of for the galaxies of different central surface brightness.
We also enable to compare the mass of the spherical subsystem for our galaxies. In Fig. 3c we present how the ratio depends on the disk central surface brightness. We kept the same notation as in Fig. 1 and Fig. 3a. The figure indicates that the LSB galaxies do not have the most massive dark matter halos, but have the most massive spherical subsystem. That supports the result by Graham ([10]) that not all LSB galaxies are the dark-matter dominated objects.
4 Conclusions
1) We present the results of the photometric observations made for the sample of edge-on galaxies. Our sample contains four LSB galaxies as well as seven HSB ones. The photometric disk scales (vertical and radial), the disk central surface brightness and the bulge to disk luminosity ratio were determined.
2) Stellar disks of our LSB galaxies are thinner than HSB ones. There is a good correlation between their central surface brightness and their vertical to radial scales ratio.
3) Our LSB galaxies tend to harbor the massive spherical subsystems as well as to havehigher values of the mass-to-luminosity ratio in their disks when compared to the HSB objects. Nevertheless, the dark halo is not strictly the most massive subsystem in our LSB galaxies. The LSB galaxies appear to be the spherical dominated systems, but not the ”dark matter dominated” ones.
REFERENCES
[1] Karachentsev, I., Karachentseva, V., Kudrya, Y., et al.// 1999, Bull. Of Special Astrophys. Obs., 1999, 47, 5, (RFGC) [2] Bizyaev, D.// 2000, Astron. Lett. 26, 219. [3] van der Kruit, P., Searle, L. // 1981, A&A, 95, 105 and 116 [4] Barteldrees, A., Dettmar, R.-J. // 1994, A&AS, 103, 475 [5] Bizyaev, D., Mitronova, S. // 2002, A&A, 389, 795 [6] Zasov, A., Bizyaev, D., Makarov, D. etc. // 2002, Astron.Lett. 28, 527 [7] de Jong, R. // 1996, A&A, 313, 45 [8] Zasov, A., Makarov, D., Mikhailova, E. // 1991, Astron.Lett., 17, 374 [9] Mikhailova, E., Khoperskov, A., Sharpak, S. // 2001, in Stellar Dynamics: From Classic to Modern , Ed. by L.Ossipkov and I.Nikiforov, p. 147 [10] Graham, A. // 2002, MNRAS, 334, 721
FIGURE CAPTIONS
Fig.1. The vertical to radial scale ratio is shown against the disk central surface density . The open squares are for the HSB subsample, the filled ones designate our LSB galaxies. The galaxies taken from [4] are shown by crosses, the 2MASS sample is designated by the small filled triangles.
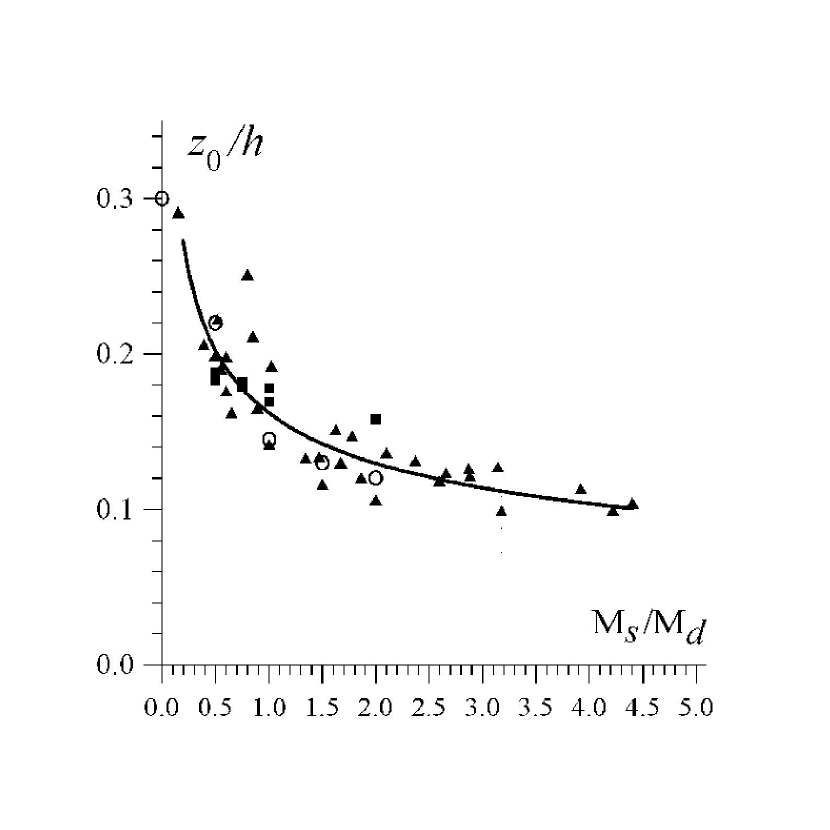
Fig.2. The ratio od scales is plotted versus the relative mass of the spherical galactic subsystem according to the numerical simulations described in [9].
Fig.3. a) The scales ratio and the total mass to disk luminosity rati . The same notation applies here as in Fig.1. The three curves show the model results (see Fig.2) recalculated for values of 1 (solid curve), 2 (dash-dotted) and 4 (dashed). The value of M/L is systematically higher for our LSB galaxies.
b) The ratio of dark to luminous mass is plotted against the disk central surface brightness with the same notation as in Fig. 3a. There is no systematic difference in the relative dark matter mass between the LSB and HSB galaxies.
c) The ratio of the spherical to disk mass is shown in dependence on the disk central surface brightness. The LSB galaxies have the more massive spherical subsystem when compared to HSB ones.