Spectroscopic Confirmation of
A Radio-Selected Galaxy Overdensity at
Abstract
We report the discovery of a galaxy overdensity at associated with the high-redshift radio galaxy MG 0442+0202. The group, CL 0442+0202, was found in a near-infrared survey of radio galaxies undertaken to identify spatially-coincident regions with a high density of objects red in color, typical of elliptical galaxies. Spectroscopic observations from the Keck I telescope reveal five galaxies within 35″ of MG 0442+0202 at . These member galaxies have broad-band colors and optical spectra consistent with passively-evolving elliptical galaxies formed at high redshift. Archival ROSAT observations reveal a 3 detection of soft X-ray emission coincident with CL 0442+0202 at a level five times greater than expected for the radio galaxy. These data are suggestive of a rich galaxy cluster and inspired a 45 ks Chandra X-Ray Observatory observation. As expected, the radio galaxy is unresolved to Chandra, but is responsible for approximately half of the observed X-ray flux. The remaining ROSAT flux is resolved into four point sources within 15″ of the radio galaxy, corresponding to a surface density two orders of magnitude higher than average for X-ray sources at these flux levels (). One of these point sources is identified with a radio-quiet, type II quasar at , akin to sources recently reported in deep Chandra surveys. The limit on an extended hot intracluster medium in the Chandra data is (, 30″ radius aperture). Though the X-ray observations do not confirm the existence of a massive, bound cluster at , the success of the optical/near-infrared targeting of early-type systems near the radio galaxy validates searches using radio galaxies as beacons for high-redshift large-scale structure. We interpret CL 0442+0202 to be a massive cluster in the process of formation.
keywords:
cosmology: observations – X-rays: galaxy clusters – galaxies: active – galaxies: individual (MG 0442+0202) – galaxies: evolution1 Introduction
The study of rich galaxy clusters at high redshift has important consequences for our understanding of structure formation in the Universe and is a crucial test of cosmological models. Numerical simulations of hierarchical models such as cold dark matter (CDM) predict few massive clusters at large redshift (e.g., Cen & Ostriker 1994), and that the evolution of cluster number density as a function of X-ray luminosity and temperature depends sensitively upon , but only weakly upon and the initial power spectrum (e.g., Peebles, Daly, & Juszkiewicz 1989; Evrard 1989; Eke et al. 1998). Moderate-redshift clusters from well-defined samples such as the ROSAT Deep Cluster Survey (RDCS; Rosati et al. 1998) have been used to constrain and (Borgani 2001). Distant X-ray luminous clusters provide the best lever arm for these studies. However, to date, few () clusters have been spectroscopically confirmed (c.f., Dickinson 1995; Stanford et al. 1997; Rosati et al. 1999; Liu et al. 2000; Rosati 2001; Thompson et al. 2001; Stanford et al. 2002).
Clusters and groups of galaxies also provide a crucial tool in the study of galaxy formation and evolution. Out to at least clusters tend to be dominated by a population of massive ellipticals which is largely homogenous and has been quiescent since at least (e.g., Stanford, Eisenhardt, & Dickinson 1998). Finding high-redshift, massive elliptical systems is difficult, but the implications for the epoch of early-type galaxy formation can be provocative, as evidenced by LBDS 53W091, a galaxy at whose 3.5 Gyr age is comparable to the Hubble time for its redshift (Dunlop et al. 1996; Spinrad et al. 1997). An expanded census of dense environments in the early Universe will provide a powerful means to test models of large scale structure formation, characterize the galaxy populations in these environments, and study the formation epoch of early-type galaxies.
Most bound clusters beyond redshift unity have been identified from deep, serendipitous X-ray surveys, deep near-IR imaging surveys, and/or around powerful 3C radio sources. Radio galaxies are robust signposts of early collapse. In the local Universe, bright radio sources are often hosted by giant elliptical and cD galaxies residing within dense environments, and this identification has been shown to continue to higher redshift — e.g., 3C184 at (Deltorn et al. 1997), 3C324 at (Dickinson 1995), 3C294 at (Fabian et al. 2001), and TN J13381942 at (Venemans et al. 2002). Hall et al. (2001) also show an excess population of red galaxies around radio-loud quasars at , interpreted as being due to rich environments associated with the quasars.
In terms of studying the intracluster gas, however, clusters around the most luminous high-redshift radio galaxies (HzRGs) and radio-loud quasars are less than ideal, as observed X-ray emission does not necessarily derive solely from the hot gas. Hardcastle, Lawrence, & Worrall (1998) show that unresolved, soft X-ray flux correlates with 5 GHz core flux for HzRGs and core-dominated radio-loud quasars. Chandra has also revealed soft, extended X-ray emission coincident with the outer radio lobes in powerful 3C sources (e.g., Wilson, Young, & Shopbell 2000; Harris et al. 2000). This emission is thought to be due to inverse-Compton scattering of cosmic microwave background photons by the relativistic plasma in radio jets/lobes. At larger redshifts, the energy density of the microwave background is higher, so that the cooling time for relativistic electrons is short. AGN-related soft X-ray emission should only be problematic in the youngest and most luminous radio sources at high redshift. Therefore, the next obvious step in identifying a sample of high-redshift clusters well-suited to X-ray follow-up is to locate clusters identified with less powerful radio galaxies.
In this paper, we report the discovery of an overdensity of galaxies at associated with the moderate-strength ( mJy; Griffiths et al. 1995), narrow-lined HzRG MG 0442+0202. Though the X-ray observations detailed herein do not confirm a hot intracluster medium associated with this overdensity, the technique is sound and the radio galaxy clearly marks a rich location in the early Universe. The group, CL 0442+0202, was identified from a deep optical/near-IR imaging survey of radio sources at selected from the 5 GHz MIT-Greenbank (MG) radio catalog (Bennett et al. 1986; Stern et al. 1999). MG 0442+0202 is a moderately-steep spectrum radio source (, where ), approximately a quarter as luminous at 1.4 GHz compared to the typical 3C HzRG. The 365 MHz morphology is double, extended by at a position angle of (Douglas et al. 1996). The 5 GHz morphology, measured with the VLA, reveals a triple morphology, with two nearly equal intensity lobes separated by approximately 9″ at a position angle of 30∘, flanking a centrally-located core with a flux 24% of the mean lobe radio flux. Initial optical identification and redshift determination of MG 0442+0202 were obtained at Lick Observatory as part of the Berkeley effort to study MG sources (e.g., Spinrad et al. 1993; Stern et al. 1997).
We assume , , and throughout. For this cosmology, the luminosity distance of CL 0442+0202 is Gpc and one arcsecond subtends proper kpc. For , , and , the cosmology favored by recent high-redshift supernovae and cosmic microwave background observations, these distances change very slightly: they are smaller by 0.4%. Throughout we have corrected for foreground Galactic extinction using a reddening of determined from the dust maps of Schlegel, Finkbeiner, & Davis (1998).
2 Observations and Results
2.1 Optical and near-infrared imaging
To search for red galaxies associated with the HzRG MG 0442+0202, we obtained deep, near-infrared imaging of the field using the Gemini Twin-Arrays Infrared Camera (McLean et al. 1994) on the Lick 3 m Shane telescope. Gemini uses a dichroic beam splitter which yields two independent beams: a short-wave channel with a Rockwell NICMOS 3 HgCdTe array and a long-wave channel with a SBRC InSb array. Gemini was used in its 07 pix-1 mode, providing a 3′ 3′ field of view. Our data, obtained through (m; m) and (m; m) filters for the two channels respectively, were obtained in non-photometric conditions on UT 1999 January 3 and UT 1999 December 2. The total integration time was 12 ks, and the combined image, reporting 23 seeing, is provided in Fig. 1.
To calibrate these images, we obtained snapshots of the MG 0442+0202 field on UT 1999 February 26 in photometric conditions and 07 seeing with NSFCAM (Shure et al. 1994) at the 3 m Infrared Telescope Facility (IRTF). NSFCAM was used in its 03 pix-1 mode, providing a 77″ 77″ field. Observations of standard stars from the Persson et al. (1998) list were used to calibrate the images onto the California Institute of Technology (CIT) system, defined in Elias et al. (1982). The calibrated Lick Observatory image reaches a depth of (3 in a 46 diameter aperture).
We obtained an optical, -band ( 8331 Å; = 3131 Å) image of MG 0442+0202 on UT 2001 January 28 with the Low Resolution Imaging Spectrometer (LRIS; Oke et al. 1995) on the Keck I telescope. This 600 s exposure, calibrated with observations of PG 1323086 (Landolt 1992) obtained the same night, has 074 seeing and reaches a depth of 24.7 mag ( in 15 diameter aperture). LRIS uses a backside-illuminated Tek CCD with 0212 pix-1, providing a 6′ 78 field of view.
After geometrically transforming the images to a common frame, we used SExtractor (release V2.1.6; Bertin & Arnouts 1996) to create catalogs of sources selected from the images. Photometry was generated for 6″ diameter apertures. Fig. 2 presents resultant color-magnitude diagrams for the Lick and IRTF images. Compared to random extragalactic fields, the field of MG 0442+0202 has a high surface density of objects with red colors. Using the IRTF infrared imaging, we find six sources in the 1.6 arcmin2 field with and , corresponding to a surface density of extremely red objects (EROs) of 3.8 EROs arcmin-2. This is 17 times the surface density of such sources found by Barger et al. (1999) in a 61.8 arcmin2 survey and times the surface density of such sources found in the 47.2 arcmin2 Herschel Deep Field (McCracken et al. 2000). The dotted line in Fig. 2 at shows the red sequence characteristic of local cluster galaxies, as determined by band-shifting photometry of Coma cluster galaxies (see Stanford et al. 1998). Particularly in the better-seeing IRTF imaging where confusion is less troublesome, photometric errors less severe, and the smaller field less contaminated by field galaxies, a red sequence is evident approximately 0.5 mag blue-ward of the no-evolution prediction. This amount of bluing in observed color is consistent with the color change due to passive evolution of a single-age, solar-metallicity, stellar population at formed in a 0.1 Gyr burst at a formation redshift (using the updated 2000 GISSEL models of Bruzual & Charlot 1993). We targeted this red sequence for spectroscopic investigation.
2.2 Keck spectroscopy
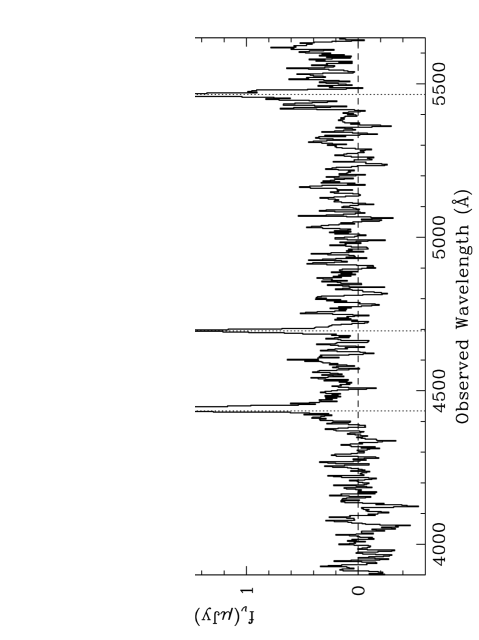
We obtained optical spectra of photometric candidates using LRIS in slitmask mode on the Keck I telescope. Masks on UT 2001 January 30 and UT 2001 February 19 were observed for 1.5 hr, while a fainter mask on UT 2002 February 56 was observed for 3.5 hr. On UT 2002 March 10 we observed a mask mainly targeting Chandra sources in the field for 1.5 hr. A shallow, 20 min longslit observation of two bright Chandra sources was also obtained on UT 2002 March 11 during twilight. All observations used the 400 lines mm-1 grating ( Å; spectral resolution Å) and sample the wavelength range Å to 1 m. The March 2002 observations also implemented the blue side of LRIS, using a D560 dichroic and the 300 lines mm-1 grism ( Å; spectral resolution Å), providing spectral coverage down to Å. The observations were split into 1800 s exposures with 3″ spatial offsets performed between integrations to facilitate removal of fringing at long wavelengths. Data reductions followed standard procedures and the spectra were flux-calibrated using observations of standard stars from Massey & Gronwall (1990). Sample optical spectra are presented in Fig. 3 and results for all -detected sources are presented in Table 1. Redshifts were determined by visual inspection of emission and absorption features. A histogram of the redshifts we have obtained thus far in the MG 0442+0202 field is presented in Fig. 4, showing a pronounced redshift spike at . Besides MG 0442+0202, a total of seven color-selected targets within 30″ of the radio galaxy were attempted spectroscopically, of which five are confirmed cluster members and one has an inconclusive spectrum. Most of the confirmed cluster members have spectra typical of local early-type galaxies, showing strong 4000 Å breaks and weak or no emission lines. The exception is, of course, the HzRG MG 0442+0202 which shows high equivalent width, narrow, high ionization state emission features, typical of the HzRG population (e.g., McCarthy 1993).
2.3 ROSAT archive
A search of the ROSAT archive reveals that High Resolution Imager (HRI; Trümper 1983) observations of the cluster MS 0440+0204 cover CL 0442+0202 at an off-axis angle of 134. These data, discussed in Gioia et al. (1998), were obtained in 1994 February/March and 1995 August/September. We processed the archival data, which total 27.2 ks, and identify a 3.3 X-ray source slightly (2 of the point spread function) offset from the radio galaxy. The resolution of ROSAT at the large off-axis angle of CL 0442+0202 is inadequate for determining if the X-ray emission is extended or point-like. After correcting for the expected soft X-ray emission from the radio galaxy (Hardcastle et al. 1998), the ROSAT detection suggested soft X-ray emission of , consistent with a high-redshift hot intracluster medium (ICM). This exciting hypothesis inspired an observation with the Chandra X-Ray Observatory (Weisskopf, O’dell, & van Speybroeck 1996).
2.4 Chandra observations
On UT 2002 February 10 we obtained a 44.1 ks observation of CL 0442+0202 with Chandra. Compared to the ROSAT image, these data (OBS-ID 03242), taken with the Advanced CCD Imaging Spectrometer (ACIS-I), reach a greater depth with significantly improved () angular resolution. We reduced and analyzed the data following standard procedures, using the Chandra Interactive Analysis of Observations (CIAO) software (release V2.1.2). Sources were identified independently in both soft (0.52 keV; ) and hard (27 keV; ) energy bands. Following previous analyses of deep Chandra data (e.g., Tozzi et al. 2001; Stern et al. 2002b), we determined a hardness ratio , using the background-subtracted counts. A response matrix and effective area were then determined for each detected source. Assuming a Galactic and a typical photon index, , counts in each band were converted into fluxes. Table 2 presents the X-ray results for those Chandra sources contained within the optical image, along with optical magnitudes and spectroscopic redshifts, when available.
3 Discussion
3.1 Chandra results
The most striking result of the Chandra data is that the improved spatial resolution resolves the ROSAT detection into five point sources. The total soft-band flux of these sources accounts for only 20% of the ROSAT detection, likely due to the low significance of the ROSAT detection with temporal variability also possible. As expected, the radio galaxy MG 0442+0202 is detected with a relatively hard X-ray spectrum; we discuss this source further in §3.2. At the depth of our image, , Chandra observations of deep fields find a mean surface density of approximately 1000 sources deg-2 (e.g., Stern et al. 2002b). The five sources we detect in our Chandra image, all within 15″ of the HzRG, represent a surface density approximately two orders of magnitude higher! Unfortunately, this unusual configuration of point sources rather than an extended ICM is likely responsible for the ROSAT detection. We find no diffuse emission associated with CL 0442+0202 (see §3.4).
Of the twelve Chandra sources within the optical image, we have unambiguous spectroscopic redshifts for six and and tentative redshifts for an additional two. Typical of follow-up of Chandra sources, the two sources with the softest () X-ray spectra are identified with luminous, broad-lined quasars. Both have projected celestial positions close to CL 0442+0202 (see Table 1), but one (CXO 6) is background while the other (CXO 7) is foreground. Potentially they could provide useful probes of the environment of CL 0442+0202. The two sources with ambiguous spectra both have relatively soft X-ray spectra and optical spectra that reveal blue continuum, each with the detection of a single, broad emission line. We tentatively interpret both lines as Mg 2 2800Å: at , the strong rest-frame UV lines characteristic of quasars have not yet entered the optical window, while the strong rest-frame optical lines have shifted to near-IR wavelengths, either beyond the optical window or at redder wavelengths where the sky is less benign.
The source CXO 10 is typical of the new population of sources being identified in deep Chandra images (e.g., Hornschemeier et al. 2001; Stern et al. 2002b): galaxies whose optical/near-IR properties suggest a normal galaxy with no indication of an active nucleus, but are nevertheless luminous X-ray sources. Many of these sources, including CXO 10, have hard X-ray spectra, implying significant obscuration of a buried central engine. In the case of CXO 10, the optical spectrum is dominated by an old stellar population with a strong 4000 Å break. Weak [O 2] 3727Å is also present, possibly due to low levels of star formation, possibly due to the narrow-line region of the buried, active nucleus.
Finally, our Chandra data reveal two obvious AGN showing high equivalent width, high ionization state, narrow emission lines, but lacking the obvious broad-line signatures associated with quasars: CXO 5 and CXO 12. Following Seyfert nomenclature, these sources are often called type II quasars, and deep X-ray data has sparked a renewed interest in the population (e.g., Norman et al. 2002; Stern et al. 2002a; Dawson et al. 2003). The radio-loud end of this population has been studied for several decades: indeed, CXO 5 is identified with MG 0442+0202 and we discuss it in more detail in §3.2. CXO 12 is the other type II active system identified in our data. The X-ray spectrum is relatively flat from the soft to the hard bands (), providing a harder X-ray spectrum than the typical, bright X-ray population. The optical spectrum (Fig. 5) shows narrow, rest-frame UV emission lines with very little continuum. Stern et al. (2002a) discusses a similar source in detail (see also Norman et al. 2002; Dawson et al. 2003). Both the apparently-normal galaxies and these type II quasars are being found in large numbers in surveys with the new generation of X-ray satellites. Such studies will be essential for creating an unbiased census of AGN in the Universe, thereby testing models of the X-ray background and providing a history of accretion-driven energy production in the Universe.
3.2 The radio galaxy MG 0442+0202
The radio galaxy MG 0442+0202 is what initially drew our attention to this field. With , MG 0442+0202 fits smoothly onto the surprisingly low-scatter Hubble, or , relation of radio galaxies (e.g., see Fig. 10 in De Breuck et al. 2001). At each redshift, HzRGs are the most luminous galaxies known at observed 2m. Since rest-frame 2m samples stellar emission from the low-mass stars which dominate the baryon content of a galaxy, this is generally interpreted as HzRGs being the most massive systems at each cosmic epoch. Indeed, our deep, optical spectrum of MG 0442+0202 (Fig. 3) shows that this radio source is hosted by an old, massive galaxy. Though the dominant spectral features are strong, narrow emission lines characteristic of radio galaxies (e.g., McCarthy 1993), the spectrum also clearly shows stellar light. Absorption is seen from Ca H 3933Å and a conglomerate of Fe 1/Mg 1 lines around 3840 Å (e.g., Pickles 1985), indicative of low-mass stars. Ca K 3968.5 Å has been filled in by [NeIII] 3967.5 Å emission. The strong 4000 Å break seen in MG 0442+0202 is another strong indicator of stellar emission in this HzRG. The break is due to the sudden onset of stellar photospheric opacity shortward of 4000 Å, associated with the Fraunhofer H and K lines of Ca 2, as well as various ionization stages of other elements heavier than helium (Öhman 1934).
The soft X-ray properties of core-dominated quasars are strongly correlated with their radio properties, with a radio (5 GHz) core to soft X-ray core two-point spectral index of (Worrall et al. 1994; Worrall 1997). Assuming an X-ray spectral index of (see below), the observed flux density of MG 0442+0202 at 1 keV is 3.3 nJy. For its 5 GHz radio-core flux density of 12 mJy, MG 0442+0202 is slightly overluminous in the soft X-ray compared to the relation plotted by Worrall et al. (1994) for core-dominated quasars. This result is consistent with other HzRGs examined by Hardcastle et al. (1998) and may indicate non-jet-related X-ray emission originating close to the AGN.
Our Chandra observation detects more than 250 counts from MG 0442+0202, providing a robust hardness ratio of . Assuming the X-ray flux spectrum can be expressed as simple power-law function of energy [i.e., ] modified by the Galactic absorption column density in the direction of the source ( cm-2), this hardness ratio corresponds to a spectral index of — slightly flatter than the steep spectra that are commonly observed for unabsorbed AGNs (e.g., Nandra & Pounds 1994). Given the narrow-line optical/UV spectrum of the source, it is likely that MG 0442+0202 actually has an intrinsically steep X-ray spectrum that appears to be flat due to significant soft X-ray absorption by intervening material within the galaxy.
To investigate this possibility, we examined the X-ray spectrum of MG 0442+0202 more closely. Using the CIAO software, we extracted source counts within a 30 radius centered on MG 0442+0202; the background was determined from a rectangular region of 100 arcseconds by 180 arcseconds. This region was chosen to overlap with the ACIS-I node in which the radio galaxy falls, node two for chip three. All detected sources in this region were removed. As we were expecting a cluster in this observation, we observed with a mm SIM-Z offset, hence the target did not fall on the standard aimpoint. We also included a 2′ offset in the y-direction to move the potential cluster off of the chip gap in the ACIS-I mosaic, which moved the target 2′ away from the optical axis.
We binned the spectrum into 26 channels of 10 events from 0.8 to 6.0 keV and we modeled the spectrum using the XSPEC v11.1.2 package (Arnaud 1996) with the recently-created Chartas & Getman ACIS absorption model111Available at http://www.astro.psu.edu/users/chartas/xcontdir/xcont.html. and using the Markevitch & Vikhlinin (2001) correction to the effective area of ACIS-I. We fit a power law with an absorption of and found the best fitting slope for a simple power-law X-ray spectrum to be . If we add an additional absorber component at the redshift of the radio galaxy and fix the intrinsic value of , we find an column density of (90% confidence limits). This model implies an unabsorbed luminosity of (90% confidence limits; 2-10 keV), which is well within the quasar regime.
We also searched the extracted X-ray spectrum of MG 0442+0202 for redshifted Fe K 6.4 keV emission, which would appear at observed 3.03 keV. Fig. 6 presents the background-subtracted X-ray spectrum with a best-fit continuum model discussed above, assuming no intrinsic absorption. We find no excess emission evident at 3 keV, though we note that Chandra’s sensitivity falls at these higher energies.
3.3 Cluster galaxy members
The color-selected galaxy overdensity associated with MG 0442+0202 affords us the opportunity to study early-type galaxy populations at high redshift. As seen in Fig. 3, many of the galaxies associated with MG 0442+0202 have evolved stellar populations as evidenced, for example, by strong continuum decrements at 4000 Å. This feature is of particular importance as the 4000 Å decrement intensifies with the age of a stellar population, potentially providing a sensitive probe of the age of a galaxy. Most of the other early-type galaxy overdensities known (see §1) are at sufficiently high redshift () that this feature has shifted to challenging wavelengths for silicon-based detectors, especially from the ground where telluric emission is severe. In such cases, astronomers are forced into the difficult situation of age-dating galaxies based on breaks at 2640 Å and 2900 Å, where the galaxy is several times fainter (e.g., Spinrad et al. 1997; Yi et al. 1999). The redshift of MG 0442+0202 is ideal for probing the formation history of early-type galaxies: is sufficiently large to be cosmologically interesting, but not so large as to be challenging spectroscopically.
for the three galaxies presented in Fig. 3. Conservatively assuming that the stellar populations were formed from a single, instantaneous, solar-metallicity burst, these galaxies have minimum ages of approximately 1 Gyr, where we have compared the amplitudes of the D(4000) break to Bruzual & Charlot (1993) stellar population synthesis models for both Salpeter (1955) and Scalo (1986) initial mass functions and a range of star formation histories (Fig. 7). The implied formation redshift is . We note that several of the group members show [O 2] emission at some level, suggesting some ongoing star formation. This would imply younger, bluer stars diluting the D(4000) amplitude, and thus an earlier formation redshift. For the exponentially-decreasing star formation history plotted, the minimum age is approximately 4 Gyr, requiring formation redshifts .
We now compare the absolute magnitudes of the CL 0442+0202 galaxies to local cluster luminosity functions: for a 1 Gyr old single-burst stellar population, calculated using the Worthey (1994) models for a Salpeter (1955) initial mass function, solar metallicity, and a mass range of , the -correction from observed to rest-frame Gunn is 0.21 mag, implying for MG 0442+0202 for our adopted cosmology. From a sample of 39 Abell clusters, Paolillo et al. (2001) find , using the same cosmology. During the 8.8 Gyr that elapses from to , our model predicts mag fading due to luminosity evolution, suggesting that MG 0442+0202 will evolve into a elliptical in the present epoch if there is no additional merging. The next brightest confirmed cluster member, galaxy#2, has , suggesting a elliptical in the present epoch for the same assumptions.
Including MG 0442+0202, we have identified six galaxies within an angular region of 1′ diameter that have similar velocities. Their redshifts have a mean of 1.104. Jackknife determinations of the velocity dispersion using both the gapper method and biweights yield . We find similar results for the bootstrap method.
3.4 A Hot Intracluster Medium?
We analyzed the Chandra data to study possible diffuse soft X-ray emission from a hot intracluster medium. Excluding the obvious five point sources, we implemented a simple curve of growth analysis. We made a series of annuli of increasing width and subtracted off a background annulus from 40″ to 60″ in radius, all centered on MG 0442+0202. In no annulus did we achieve a detection of excess events in the 0.3 to 10.0 keV energy band. In the 1.0 to 6.0 keV band, we find a 3 upper limit of for a 3 keV cluster at within a 30″ radius centered on the radio galaxy. This radius corresponds to a 257 kpc at the redshift of the cluster, a typical core radius for a massive cluster of galaxies. We choose 3 keV as the cluster temperature based on the velocity dispersion measured in §3.3 and equation 13 in Wu, Fabiand, & Fang (1999). Translating the flux limit into a luminosity, we find an upper limit of for the bolometric luminosity of the cluster. Using the bolometric luminosity – velocity dispersion relation of equation 7 in Wu et al. (1999), we would expect a bolometric luminosity of . This would translate into a detection within the 30″ radius, assuming a core radius of 250 kpc and a model with a slope of .
4 Conclusions
Optical/near-IR imaging of the moderate-strength, radio source MG 0442+0202 has revealed an overdensity of sources with red optical to near-IR colors, typical of early-type galaxies. Spectroscopic investigations with the Keck telescope have secured redshifts for five of these galaxies in the range within 35″ of MG 0442+0202. These data indicate the presence of an overdensity at high redshift. The member galaxies form a homogenous population with similar colors. The colors and tightness of the color-magnitude relation support the conclusions of Stanford et al. (1998) and van Dokkum & Franx (2001) who found that the spectrophotometric properties of early-type cluster galaxies are consistent with the passive evolution of an old stellar population formed at an early cosmic epoch. Our data (Fig. 2) suggests a less steep color-magnitude relation than seen in the nearby Coma cluster. This effect is likely due to a blue AGN contribution to the brightest galaxy in our group, MG 0442+0202. Similar flattenings of the color-magnitude relation are expected near the formation epoch of cluster ellipticals, though galactic winds in single-age monolithic models can also produce such effects (e.g., van Dokkum et al. 2001).
Archival ROSAT data found soft X-ray emission coincident with this structure with an intensity higher than expected from the radio galaxy alone. Deeper, higher-resolution Chandra observations reveal no extended soft X-ray emission from a hot ICM associated with the putative cluster, instead finding 5 X-ray point sources within 15″ of the radio galaxy, approximately 100 times the average surface density of X-ray sources at this flux level. The lack of extended X-ray emission coupled with the spectroscopically-confirmed galaxies with a tight color-magnitude relation lead us to interpret CL 0442+0202 to be a protocluster in the process of formation. Based on the sparse data presented here, and the optical faintness of the associated galaxies, it is difficult to fully determine the nature of the overdensity associated with MG 0442+0202. Deeper data and more extensive spectroscopy are necessary to determine if CL 0442+0202 will become a modest group or a rich cluster. We can safely say, however, that CL 0442+0202 is likely a structure which has broken away from the Hubble flow, but is still a long way from virialization. A weak ICM is probably already in place, with some metal enrichment from previous generations of stars, but it remains undetected since CL 0442+0202 is not virialized and the (future) ICM’s temperature and density are far too low to produce detectable X-ray emission. As noted previously (e.g., Lubin, Oke, & Postman 2002), many optically-selected clusters at are also underluminous in the X-rays when compared to the X-ray luminosity – velocity () relation for local and moderate-redshift clusters. This suggests that clusters are actively forming at these redshifts.
Accepting that CL 0442+0202 is a cluster in the process of formation, we note that the old age of the CL 0442+0202 member galaxies (§3.3) implies that the stars in clusters are older than the ICM. Similarly, based on Hubble Space Telescope imaging of spectroscopically-confirmed members of the optically-selected, X-ray-underluminous cluster CL 1324+3011 (), Lubin et al. (2002) find a high early-type fraction (), indicative of a substantial tenure for these constituent galaxies. Since the ICM is processed gas, these results: (1) mean the ICM is relatively young, and (2) raise the question of which galaxies are the source of the metal enrichment.
This work shows that high-redshift radio galaxies can be beacons of rich regions in the early Universe, allowing the identification of clusters and protoclusters at . A census of galaxy clusters at would provide a major breakthrough toward our understanding of early-type galaxy formation, cluster formation, as well as provide important constraints on basic cosmological parameters. Additionally, unified models of AGN predict that HzRGs and radio-loud quasars differ only in the orientation of their central jets relative to the observer; on average, they are expected to reside in similar galactic environments. This hypothesis could be tested with a systematic study of a well-chosen sample of radio-loud galaxies and quasars.
Acknowledgements.
The authors wish to recognize and acknowledge the very significant cultural role and reverence that the summit of Mauna Kea has always had within the indigenous Hawaiian Community. We are most fortunate to have the opportunity to conduct observations from this mountain. We thank Leslie Maxfield for contributions to preliminary optical observations of the radio galaxy MG 0442+0202 from Lick Observatory and we gratefully acknowledge Charles Lawrence for enlightening discussion regarding the X-ray properties of HzRGs. We thank Megan Eckart and Fiona Harrison for Keck spectroscopy of Chandra sources in this field, obtained as part of the SEXSI survey (Harrison et al., in preparation), and we thank Marc Davis, Alison Coil, and Ed Moran for providing the Keck -band image. We are indebted to Ian McLean and Elinor Gates for building and supporting the Gemini camera at Lick Observatory, and to Kurt Adelberger for an insightful and careful referee report. Support for this project came from Chandra grant GO2-3194. The work of DS was carried out at the Jet Propulsion Laboratory, California Institute of Technology, under a contract with NASA. The work by SAS and BH at Lawrence Livermore National Laboratory was performed under the auspices of the Department of Energy under contract W-7405-ENG-48.References
- Arnaud (1996) Arnaud, K. A. 1996, in Astronomical Data Analysis Software and Systems V, ed. J. G. Jacoby & J. Barnes, Vol. 101 (San Francisco: ASP Conference Series), 17
- Barger, Cowie, Trentham, Fulton, Hu, Songaila, & Hall (1999) Barger, A., Cowie, L. L., Trentham, N., Fulton, E., Hu, E. M., Songaila, A., & Hall, D. 1999, AJ, 117, 102
- Bennett, Lawrence, Burke, Hewitt, & Mahoney (1986) Bennett, C. L., Lawrence, C. R., Burke, B. F., Hewitt, J. N., & Mahoney, J. 1986, ApJS, 61, 1
- Bertin & Arnouts (1996) Bertin, E. & Arnouts, S. 1996, A&AS, 117, 393
- Borgani (2001) Borgani, S. 2001, in Clusters of Galaxies and the High-Redshift Universe in X-Rays (XXI Moriond Astrophysics Meeting), in press, astro-ph/0106471
- Bruzual & Charlot (1993) Bruzual, A. G. & Charlot, S. 1993, ApJ, 405, 538
- Cen & Ostriker (1994) Cen, R. & Ostriker, J. P. 1994, ApJ, 429, 4
- Dawson, McCrady, Stern, Spinrad, Graham, & Liu (2003) Dawson, S., McCrady, N., Stern, D., Spinrad, H., Graham, J. R., & Liu, M. C. 2003, AJ, in press (March; astro-ph/0212240)
- De Breuck, van Breugel, Stanford, Röttgering, Miley, & Stern (2001) De Breuck, C., van Breugel, W., Stanford, S. A., Röttgering, H., Miley, G., & Stern, D. 2001, AJ, 1754, 637
- Deltorn, Le Fevre, Crampton, & Dickinson (1997) Deltorn, J.-M., Le Fevre, O., Crampton, D., & Dickinson, M. 1997, ApJ, 483, L21
- Dickinson (1995) Dickinson, M. 1995, in Fresh Views of Elliptical Galaxies, ed. A. Buzzoni, A. Renzini, & A. Serrano, Vol. 86 (San Francisco: ASP Conference Series), 283
- Douglas, Bash, Bozyan, Torrence, & Wolfe (1996) Douglas, J. N., Bash, F. N., Bozyan, F. A., Torrence, G. W., & Wolfe, C. 1996, AJ, 111, 1945
- Dunlop, Peacock, Spinrad, Dey, Jimenez, Stern, & Windhorst (1996) Dunlop, J. S., Peacock, J. A., Spinrad, H., Dey, A., Jimenez, R., Stern, D., & Windhorst, R. A. 1996, Nature, 381, 581
- Eke, Cole, Frenk, & Patrick (1998) Eke, V. R., Cole, S., Frenk, C. S., & Patrick, H. J. 1998, MNRAS, 298, 1145
- Elias, Frogel, Matthews, & Neugebauer (1982) Elias, J. H., Frogel, J. A., Matthews, K., & Neugebauer, G. 1982, AJ, 87, 1029
- Evrard (1989) Evrard, A. 1989, ApJ, 341, L71
- Fabian, Crawford, Ettori, & Sanders (2001) Fabian, A. C., Crawford, C. S., Ettori, S., & Sanders, J. S. 2001, MNRAS, 322, L11
- Gioia, Shaya, Le Févre, Falco, Falco, & Hammer (1998) Gioia, I. M., Shaya, E. J., Le Févre, O., Falco, E. E., Falco, G. A., & Hammer, F. 1998, ApJ, 497, 573
- Griffiths, Wright, Burke, & Ekers (1995) Griffiths, M., Wright, M., Burke, B., & Ekers, R. 1995, ApJS, 97, 347
- Hall et al. (2001) Hall, P. B. et al. 2001, AJ, 121, 1840
- Hardcastle, Lawrence, & Worrall (1998) Hardcastle, M. J., Lawrence, C. R., & Worrall, D. M. 1998, ApJ, 504, 743
- Harris et al. (2000) Harris, D. E. et al. 2000, ApJ, 530, L81
- Hornschemeier et al. (2001) Hornschemeier, A. E. et al. 2001, ApJ, 554, 742
- Landolt (1992) Landolt, A. U. 1992, AJ, 104, 340
- Liu, Dey, Graham, Bundy, Steidel, Adelberger, & Dickinson (2000) Liu, M. C., Dey, A., Graham, J. R., Bundy, K. A., Steidel, C. C., Adelberger, K., & Dickinson, M. E. 2000, AJ, 119, 2556
- Lubin, Oke, & Postman (2002) Lubin, L. M., Oke, J. B., & Postman, M. 2002, AJ, in press, astro-ph/0206442
- Markevitch & Vikhlinin (2001) Markevitch, M. & Vikhlinin, A. 2001, ApJ, 563, 95
- Massey & Gronwall (1990) Massey, P. & Gronwall, C. 1990, ApJ, 358, 344
- McCarthy (1993) McCarthy, P. J. 1993, ARA&A, 31, 639
- McCracken, Metcalfe, Shanks, Campos, Gardner, & Fong (2000) McCracken, H. J., Metcalfe, N., Shanks, T., Campos, A., Gardner, J. P., & Fong, R. 2000, MNRAS, 311, 707
- McLean, Macintosh, Liu, Casement, Figer, Lacayanga, Larson, Teplitz, Silverstone, & Becklin (1994) McLean, I. S., Macintosh, B. A., Liu, T., Casement, L. S., Figer, D. F., Lacayanga, F., Larson, S., Teplitz, H., et al., 1994, SPIE, 2198, 457
- Nandra & Pounds (1994) Nandra, K. & Pounds, K. A. 1994, MNRAS, 268, 405
- Norman et al. (2002) Norman, C. et al. 2002, ApJ, 571, 218
- Öhman (1934) Öhman, Y. 1934, ApJ, 80, 71
- Oke, Cohen, Carr, Cromer, Dingizian, Harris, Labrecque, Lucinio, Schaal, Epps, & Miller (1995) Oke, J. B., Cohen, J. G., Carr, M., Cromer, J., Dingizian, A., Harris, F. H., Labrecque, S., Lucinio, R., et al., 1995, PASP, 107, 375
- Paolillo, Andreon, Longo, Puddu, Gal, Scaramella, Djorgovski, & de Carvalho (2001) Paolillo, M., Andreon, S., Longo, G., Puddu, E., Gal, R. R., Scaramella, R., Djorgovski, S. G., & de Carvalho, R. 2001, A&A, 367, 59
- Peebles, Daly, & Juszkiewicz (1989) Peebles, P. J. E., Daly, R. A., & Juszkiewicz, R. 1989, ApJ, 347, 563
- Persson, Murphy, Krzeminski, Roth, & Rieke (1998) Persson, S. E., Murphy, D. C., Krzeminski, W., Roth, M., & Rieke, M. J. 1998, AJ, 116, 2475
- Pickles (1985) Pickles, A. J. 1985, ApJS, 59, 33
- Rosati (2001) Rosati, P. 2001, in Wide Field Surveys in Cosmology, ed. Y. Mellier & S. Colombi (Gif sur Yvette: Editions Frontières), in press
- Rosati, della Ceca, Norman, & Giacconi (1998) Rosati, P., della Ceca, R., Norman, C., & Giacconi, R. 1998, ApJ, 492, L21
- Rosati, Stanford, Eisenhardt, Elston, Spinrad, Stern, & Dey (1999) Rosati, P., Stanford, S. A., Eisenhardt, P. R., Elston, R., Spinrad, H., Stern, D., & Dey, A. 1999, AJ, 118, 76
- Salpeter (1955) Salpeter, E. E. 1955, ApJ, 121, 161
- Scalo (1986) Scalo, J. M. 1986, Fundamentals of Cosmic Physics, 11, 1
- Schlegel, Finkbeiner, & Davis (1998) Schlegel, D., Finkbeiner, D., & Davis, M. 1998, ApJ, 500, 525
- Shure, Toomey, Rayner, Onaka, & Denault (1994) Shure, M. A., Toomey, D. W., Rayner, J. T., Onaka, P. M., & Denault, A. J. 1994, SPIE, 2198, 614
- Spinrad, Dey, Stern, Peacock, Dunlop, Jimenez, & Windhorst (1997) Spinrad, H., Dey, A., Stern, D., Peacock, J. A., Dunlop, J., Jimenez, R., & Windhorst, R. A. 1997, ApJ, 484, 581
- Spinrad, Dickinson, Schlegel, & González (1993) Spinrad, H., Dickinson, M., Schlegel, D., & González, R. 1993, in Observational Cosmology, ed. G. Chincarini, A. Iovino, & D. Maccagni, Vol. 51 (San Francisco: ASP Conference Series), 585
- Stanford, Eisenhardt, & Dickinson (1998) Stanford, S. A., Eisenhardt, P. R. M., & Dickinson, M. 1998, ApJ, 492, 461
- Stanford, Elston, Eisenhardt, Spinrad, Stern, & Dey (1997) Stanford, S. A., Elston, R., Eisenhardt, P. R. M., Spinrad, H., Stern, D., & Dey, A. 1997, AJ, 114, 2232
- Stanford, Holden, Rosati, Eisenhardt, Stern, Squires, & Spinrad (2002) Stanford, S. A., Holden, B., Rosati, P., Eisenhardt, P. R. M., Stern, D., Squires, G., & Spinrad, H. 2002, AJ, 123, 619
- Stern, Dey, Spinrad, Maxfield, Dickinson, Schlegel, & González (1999) Stern, D., Dey, A., Spinrad, H., Maxfield, L. M., Dickinson, M. E., Schlegel, D., & González, R. A. 1999, AJ, 117, 1122
- (53) Stern, D., Moran, E. C., Coil, A., Connolly, A., Davis, M., Dey, A., Eisenhardt, P., Elston, R., et al., 2002a, ApJ, 568, 71
- Stern, Spinrad, Dey, Dickinson, & Schlegel (1997) Stern, D., Spinrad, H., Dey, A., Dickinson, M., & Schlegel, D. 1997, in The Hubble Space Telescope and the High-Redshift Universe, ed. N. Tanvir, A. Aragon-Salamanca, & J. Wall (Singapore: World Sci.), 413
- (55) Stern, D., Tozzi, P., Stanford, S. A., Rosati, P., Holden, B., Eisenhardt, P., Elston, R., Wu, K. L., et al., 2002b, AJ, 123, 2223
- Thompson, Pozzetti, Hasinger, Lehmann, Schmidt, Soifer, Szokoly, Wilson, & Zamorani (2001) Thompson, D., Pozzetti, L., Hasinger, G., Lehmann, I., Schmidt, M., Soifer, B. T., Szokoly, G., Wilson, G., et al., 2001, A&A, 377, 778
- Tozzi et al. (2001) Tozzi, P. et al. 2001, ApJ, 562, 42
- Trümper (1983) Trümper, J. 1983, Adv. Space Res., 2, 142
- van Dokkum & Franx (2001) van Dokkum, P. G. & Franx, M. 2001, ApJ, 553, 90
- van Dokkum, Stanford, Holden, Eisenhardt, Dickinson, & Elston (2001) van Dokkum, P. G., Stanford, S. A., Holden, B. P., Eisenhardt, P. R., Dickinson, M., & Elston, R. 2001, ApJ, 552, L101
- Venemans et al. (2002) Venemans, B. P. et al. 2002, ApJ, in press, astro-ph/0203249
- Weisskopf, O’dell, & van Speybroeck (1996) Weisskopf, M. C., O’dell, S. L., & van Speybroeck, L. P. 1996, SPIE, 2805, 2
- Wilson, Young, & Shopbell (2000) Wilson, A. A., Young, A. J., & Shopbell, P. L. 2000, ApJ, 544, 27
- Worrall (1997) Worrall, D. M. 1997, in Relativistic Jets in AGN, ed. M. Ostrowski, M. Sikora, G. Madejski, & M. Begelman (Krakow: Astronomical Observatory of the Jagiellonian University), 20
- Worrall, Lawrence, Pearson, & Readhead (1994) Worrall, D. M., Lawrence, C. R., Pearson, T. J., & Readhead, A. C. S. 1994, ApJ, 420, L17
- Worthey (1994) Worthey, G. 1994, ApJS, 95, 107
- Wu, Fabiand, & Fang (1999) Wu, X.-P., Fabiand, Y.-J., & Fang, L.-Z. 1999, ApJ, 524, 1
- Yi, Lee, Woo, Park, Demarque, & Oemler (1999) Yi, S., Lee, Y. W., Woo, J. H., Park, J. H., Demarque, P., & Oemler, A. J. 1999, ApJ, 513, 128


| R.A. | Dec. | |||||||
|---|---|---|---|---|---|---|---|---|
| ID | (″) | (″) | (″) | (mag) | (mag) | (mag) | Notes | |
| MG 0442+0202 | 20.33 | 17.11 | 3.22 | 1.110 | radio galaxy | |||
| galaxy#25 | 1.9 | 2.1 | 2.9 | 22.79 | 18.79 | 4.00 | 1.105 | weak [O 2] 3727 |
| galaxy#2 | 7.6 | 5.2 | 9.2 | 22.58 | 18.57 | 4.01 | 1.107 | early-type |
| galaxy#29 | 3.2 | 13.7 | 14.1 | 23.42 | 21.14 | 2.28 | 1.102 | early-type |
| galaxy#27 | 3.9 | 22.7 | 23.0 | 23.15 | 19.92 | 3.23 | 1.100 | early-type |
| galaxy#8 | 27.4 | 14.3 | 30.9 | 22.48 | 19.06 | 3.42 | 1.10 | early-type |
| quasar#37 | 2.9 | 11.4 | 11.7 | 21.37 | 20.0 | 1.37 | 2.749 | quasar |
| quasar#43 | 8.8 | 11.2 | 14.2 | 20.45 | 18.17 | 2.28 | 0.886 | quasar |
| galaxy#3 | 22.2 | 9.5 | 24.1 | 19.98 | 17.89 | 3.09 | 0.939 | early-type |
| galaxy#104 | 24.3 | 2.2 | 24.4 | 23.07 | 20.0 | 3.07 | 1.060 | [O 2] 3727 |
| galaxy#101 | 14.5 | 34.7 | 37.6 | 23.17 | 20.0 | 3.17 | 1.181 | [O 2] 3727 |
| galaxy#4 | 16.2 | 39.2 | 42.4 | 22.69 | 18.73 | 3.96 | 1.125 | early-type |
| galaxy#9 | 41.7 | 15.8 | 44.6 | 22.95 | 18.25 | 4.70 | 1.02: | early-type: |
| galaxy#5 | 6.1 | 51.1 | 51.5 | 22.10 | 19.01 | 3.09 | 1.133 | weak [O 2] 3727 |
| galaxy#7 | 21.4 | 56.6 | 60.5 | 22.75 | 18.56 | 4.19 | 0.94: | |
| galaxy#14 | 48.7 | 49.6 | 69.5 | 21.96 | 19.06 | 2.90 | 0.658 | [O 2] 3727 |
| galaxy#33 | 65.3 | 33.0 | 73.2 | 21.97 | 19.08 | 2.89 | 1.031 | [O 2] 3727 |
| galaxy#22 | 45.1 | 58.6 | 74.0 | 22.79 | 18.59 | 4.20 | 1.07: | early-type: |
| galaxy#17 | 55.2 | 51.6 | 75.6 | 21.13 | 18.19 | 2.94 | 0.86: | early-type: |
| galaxy#19 | 12.6 | 74.8 | 75.8 | 21.19 | 18.46 | 2.73 | 0.62 | early-type |
| galaxy#16 | 7.4 | 79.6 | 79.9 | 18.80 | 16.77 | 2.03 | 0.194 | H |
| galaxy#6 | 67.9 | 53.8 | 86.6 | 21.79 | 18.57 | 3.22 | 1.043 | early-type |
| galaxy#105 | 62.2 | 60.6 | 86.8 | 21.79 | 1.120 | [O 2] 3727 | ||
| galaxy#13 | 39.3 | 77.9 | 87.3 | 22.08 | 18.52 | 3.56 | 1.261 | [O 2] 3727 |
| galaxy#106 | 38.8 | 81.7 | 90.4 | 20.91 | 20.0 | 0.91 | 0.147 | H |
| galaxy#20 | 69.7 | 58.7 | 91.1 | 20.92 | 18.26 | 2.66 | 0.693 | early-type |
| galaxy#102 | 93.2 | 10.7 | 93.8 | 20.59 | 0.240 | [O 2] 3727,H | ||
| galaxy#103 | 103.1 | 10.5 | 103.6 | 22.82 | 1.112 | [O 2] 3727 | ||
| galaxy#12 | 94.7 | 71.8 | 118.8 | 22.98 | 19.19 | 3.79 | 1.269 | [O 2] 3727 |
| galaxy#107 | 99.7 | 75.6 | 125.1 | 22.86 | 20.0 | 2.86 | 0.193 | H |
Note. — Astrometry is relative to the radio galaxy MG 0442+0202, located at R.A. = 04h42m23.74s, Dec. = +02∘02′198 (J2000). Parameters with colons indicate uncertain measurements. Infrared photometry is from the Lick images for all sources except galaxies #25 and #29 where the IRTF photometry is reported: the proximity of galaxy#25 to MG 0442+0202 precludes accurate photometry in the poor-seeing Lick imaging, while galaxy#29 remains undetected in the Lick imaging. Optical photometry for sources undetected in the images are in 3″ diameter apertures.
| R.A. | Dec. | |||||||
|---|---|---|---|---|---|---|---|---|
| ID | (J2000) | (J2000) | (mag) | Notes | ||||
| CXO#2 | 04h42m26.90s | +02∘00′07.4″ | 20.39 | 8.78 | 0.30 | 23.80 | ||
| CXO#4 | 04h42m24.06s | +02∘02′14.2″ | 5.11 | 11.91 | 0.60 | 23.5: | ||
| CXO#5 | 04h42m23.74s | +02∘02′19.8″ | 115.35 | 51.39 | 0.29 | 20.91 | 1.110 | MG0442+0202 |
| CXO#6 | 04h42m23.55s | +02∘02′31.2″ | 17.90 | 3.70 | 0.51 | 21.37 | 2.749 | quasar#37 |
| CXO#7 | 04h42m23.15s | +02∘02′08.6″ | 58.24 | 14.83 | 0.55 | 20.42 | 0.886 | quasar#43 |
| CXO#8 | 04h42m23.17s | +02∘02′19.8″ | 44.75 | 23.08 | 0.22 | 22.87 | 0.835: | broad MgII: |
| CXO#10 | 04h42m24.15s | +02∘03′11.0″ | 5.91 | 10.11 | 0.37 | 22.49 | 1.133 | galaxy#5 |
| CXO#11 | 04h42m16.36s | +02∘02′30.6″ | 27.12 | 14.13 | 0.18 | 22.72 | ||
| CXO#12 | 04h42m36.25s | +02∘03′25.4″ | 20.97 | 13.41 | 0.03 | 23.40 | 1.863 | type II quasar |
| CXO#16 | 04h42m34.31s | +02∘05′10.8″ | 16.23 | 6.62 | 0.35 | 23.24 | 0.772 | |
| CXO#17 | 04h42m31.74s | +02∘05′08.5″ | 36.06 | 16.59 | 0.24 | 24.7 | ||
| CXO#18 | 04h42m13.15s | +02∘04′38.5″ | 32.98 | 14.78 | 0.25 | 22.84 | 1.38: | broad MgII: |
Note. — Uncertain measurements are indicated with a colon. is the soft-band (0.52 kev) flux measured in units of . is the hard-band (210 kev) flux measured in units of .