The Recent Star Formation History of the M31 Disk
Abstract
The star formation history of the northern and southern M31 disk is measured using samples of photometry for 4’ 4’ regions taken from the KPNO/CTIO Local Group Survey (Massey et al., 2001). The distances, mean reddening values, and age distributions of the stars in these regions were measured using the routines of Dolphin (1997, 2002). Independent measurements of overlapping fields show that the results are stable for most samples. A slight distance gradient is seen across the major axis of the southern disk, and a mean distance of 24.470.03 is found by combining the results. Higher mean reddening values follow the spiral structure. The stellar age distributions are consistent with episodic star formation confined mainly to the gas-rich arm regions. If these episodes were caused by propagating density waves, the waves did not cause significant star formation episodes in the gas-poor interarm regions. Combination of all of the results provides the total star formation rate for 1.4 deg2 of the M31 disk for six epochs. These results suggest that star formation in the disk declined by 50% from 250 to 50 Myr ago. The lowest star formation rate occurred 25 Myr ago followed by a 20% increase to the present. The mean star formation rate for this large portion of M31 over the past 60 Myr is 0.630.07 M⊙ yr-1, suggesting a total mean rate for the disk of 1 M⊙ yr-1.
1 Introduction
The stellar populations of a galaxy provide a fossil record of the history of star formation activity within that galaxy. In particular, the distribution, colors and luminosities of the upper main sequence and supergiant stars within the galaxy can provide a detailed history of star formation within the galaxy over the past 200 Myr. Once this history is deciphered, it reveals the details of global star formation processes within the galaxy, constraining its recent evolution. M31 provides a critical laboratory in which to study these processes in a large spiral disk like the one in our Galaxy. Knowledge of the star formation history (SFH) in the disk as a function of location allows tests for propagation of star formation across spiral arms, searches for coherent patterns of star formation on large scales, and comparisons with structures seen at other wavelengths, to look for correlations with star formation patterns.
The desire to understand how star formation has influenced the evolution of M31 has led to studies too numerous to name (see Hodge, 1992, and references therein). Studies date back to Hubble (1929) who first examined the stars in M31. On the other hand, the ability to decipher the history of star formation among the stellar complexes in the M31 disk has only recently been possible as powerful data analysis tools have become available. Ground-based studies have been limited by photometric accuracy, field size, and angular resolution. Nevertheless, several studies (e.g. Hodge, 1979; Ivanov & Kynchev, 1985; Magnier et al., 1992, 1997b; Mochejska et al., 2000; Massey et al., 2001; Williams, 2003) have put together large photometric samples of M31 stars and have discovered age gradients in the disk (e.g. Ivanov & Kynchev, 1985; Magnier et al., 1997b). Resolved infrared stellar photometry has suggested episodic star formation in some regions of the disk (Kodaira et al., 1999).
In recent years, Hubble Space Telescope (HST) observations have much improved our knowledge of the stellar populations contained in the M31 disk. The high angular resolution of HST has allowed deeper photometry than was possible from the ground. The deep, high-resolution imaging has allowed age measurements of many young star clusters in the disk (e.g. Magnier et al., 1997a; Williams & Hodge, 2001b, a). At the same time, studies of the field stars of the disk have put strong constraints on the metallicity distribution and the SFH of many locations within the disk (Ferguson & Johnson, 2001; Sarajedini & Van Duyne, 2001; Williams, 2002; Bellazzini et al., 2003).
Unfortunately, the limited field of view of HST makes it difficult to look for patterns of star formation in the M31 disk on large scales. For this type of study we turn back to data sets from the ground, which are now capable of covering large areas with a high degree of homogeneity and photometric accuracy. In this study I use the M31 data set from the CTIO/KPNO Local Group Survey (Massey et al., 2001) to measure independent distances and mean extinctions in 345 regions of the M31 disk, 106 of which overlap. The SFH of each region is also measured objectively and homogeneously, revealing patterns of star formation in the M31 disk over the past 250 Myr. The distance and extinction measurements provide constraints for future observational work in M31, and the star formation trends provide key insight about the evolution of a spiral disk in the late stages of evolution.
2 Data Acquisition and Reduction
The data used for this project were generously supplied by the
CTIO/KPNO Local Group Survey (LGS) collaboration
(Massey
et al., 2001;
http://www.lowell.edu/users/massey/lgsurvey) which is acquiring
1′′ resolution, photometric data with the 8 k 8 k Mosaic
cameras on the 4-m telescopes at KPNO and CTIO, entirely covering ten
LG galaxies in and narrow-band H, [S II]
(6717, 6731) and [O III] (5007). The LGS is
working on their own, more rigorous, calibration of these data leading
toward a complete catalog of stars. However, for the purposes
of this paper, I have simply used photometry from the literature to
perform a rough (10%) calibration. The analysis used in this
paper is described in full detail, including tests of the photometry
routine, tests of the photometric calibration, and tests of the SFH
measurement technique, in Williams (2003) (hereafter W3). An
incomplete brief summary of these details is supplied here for
convenience.
In short, the data consist of 6 fields from the MOSAIC camera on the KPNO 4-meter telescope. These fields cover most of the active portions of the M31 disk. The LGS team is using a total of 10 MOSAIC fields to cover the entire M31 galaxy. Here I analyze 6 of the 10, covering a total area of 1.4 deg2. Much of the central 2 fields will be dominated by the bulge. These data therefore cover 6 of the 8 disk fields, or 75% of the M31 disk. The broadband images used were in the Johnson and filters. The dithered frames were stacked and reduced using the DAOPHOT II and ALLSTAR packages (Stetson et al., 1990), and the zero points for each field were determined using published ground based photometry from previous surveys of Mochejska et al. (2001) and Magnier et al. (1992).
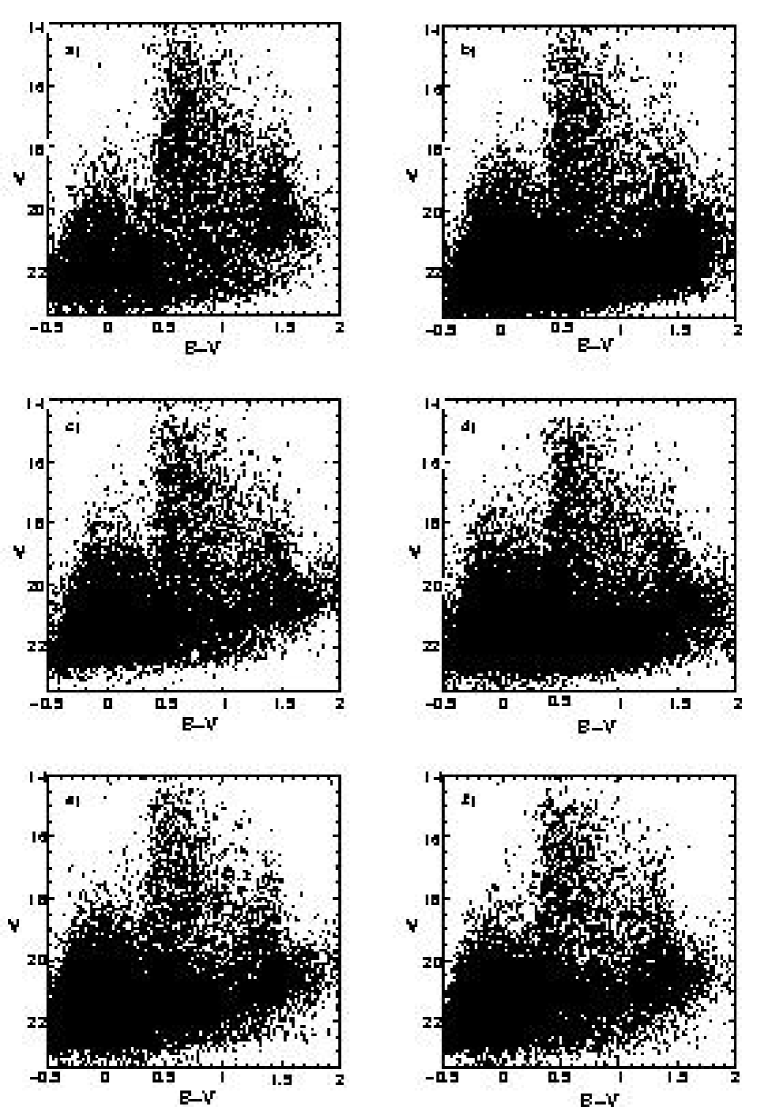
The full , color-magnitude diagrams for the 6 fields analyzed in this project are shown in Figure 1. These diagrams show several sequences typical of ground based photometry of the M31 disk performed in previous surveys. The upper main sequence of the M31 disk is seen as a vertical sequence extending upward at . Foreground sequences extend upward from and , showing the Galactic halo and disk populations respectively.
I objectively dissected each field into subfields referred to as “cells”. Because F1 has fewer stars, being far out in the disk, it was broken into 25 cells, 6.9′ 6.9′ (1600 1600 pc) in size. All other fields were broken into 64 cells, 4.3′ 4.3′ (1000 1000 pc) in size. Each of these cells will be specified by their location on the grid by a field name followed by pair of numbers x,y, where x is the number of grid cells right of the left edge of the field and y is the number of grid cells above the bottom of the field. For example, cell F8 1,8 is the cell in the far upper-left corner in field F8.
The resolved stellar photometry from each cell was used to measure the distance, mean extinction and SFH of the cell. In order to obtain a precise understanding of the accuracy of the photometry as a function of color and magnitude, a series of 150,000 artificial star tests were performed in each region analyzed using the method described in W3. In total, over 50 million artificial star measurements were performed on the 6 fields analyzed in order to measure the completeness and photometric accuracy as a function of color, magnitude and position in the field. The results of these tests were crucial for measuring accurate SFHs with correct errors.
The outermost fields were used to obtain a sample of foreground stars as described in W3. This foreground sample was applied to each 4.3′ 4.3′ sample in the M31 disk to statistically subtract foreground contaminants as a function of color and magnitude. These foreground-subtracted photometry samples of resolved stars in the M31 disk were each run through the MATCH (Dolphin, 1997, 2002) routine for measuring the distance, mean extinction and SFH of the region. The software also measures the metallicity distribution of the sample, but extensive tests, described in W3, have shown that these measurements are not reliable for young populations.
3 Results
3.1 Distance and Extinction
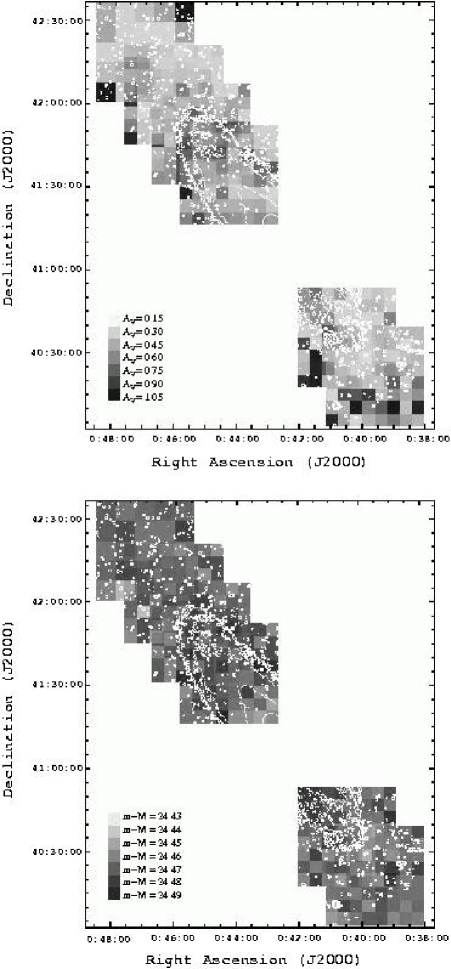
The SFH analysis routine provided distance and reddening information for each cell. The distances measured by the routine are plotted in greyscale in Figure 2, where farther distances are darker gray. Optical contours of M31 are overplotted for reference. This plot provides an opportunity to look for a distance gradient from the near edge of the disk to the far edge. If the active part of the disk is 40 kpc across, with a mean distance modulus of 24.47 and an inclination angle of 77 degrees the distance modulus of the near side of the disk should be about 0.11 mag less than that of the far side. Because the dust lanes on the western side of the disk appear to be in the foreground of the bulge, this edge is currently believed to be the closer one.
The distance parameter space explored by the measurements was limited to between 24.4 and 24.5 magnitudes, which allowed more reliable SFHs to be measured. This limitation hinders the detection of a distance gradient across the disk; however, such a detection is still possible with precise relative photometry. In the northern half of the disk, the distance measurements are all the same within the errors, revealing that the measurements do not have the precision necessary to detect a gradient across the disk. In the southern half of the disk, it appears that the average distance measures to the southeast of the major axis are systematically slightly higher than to the northwest of the major axis. The difference is not larger than the measured errors, but the pattern suggests that the commonly accepted orientation is correct: the southeastern disk is more distant. When all of these distance measurements are combined, a mean distance measurement of 24.470.03 is obtained.
Along with the distance information, the routine outputs the most likely mean extinction to the region, with errors. In Figure 2 the measured extinction values are plotted for 345 cells as a greyscale map, with optical contours of M31 overplotted. Measurements for overlapping regions were averaged. The measured values in the far northwest and southeast corners of the fields should not be trusted because very few () stars were involved in these measurements. Likewise, cells south of 40:15:00 all contained too few main sequence stars to provide accurate reddening measurements.
An extinction gradient is seen from the inner disk to the outer disk, decreasing outward. In addition, high extinction appears to follow the arm structure, which generally follows the outer contours of the optical disk. These areas also show strong dust emission (e.g. Xu & Helou, 1996; Haas et al., 1998). Because these areas also contain most of the recent star formation (discussed in section 3.2), this extinction pattern suggests that the production of dust in the high density arm environment is more important than the destruction and movement of dust by the UV fluxes and strong winds of massive young stars. As seen in most star forming galaxies and in star forming regions of the Milky Way, dust and star formation generally occur together. While this result is not new, it provides important confirmation that the analysis method is working properly. The one exception to this general rule is OB 78 (J2000 00:40:33.8, 40:44:22), where it appears as though the slightly older age and intensity of the star formation has blown away most of the surrounding gas and dust, as seen in W3.
3.2 Star Formation Histories
The SFH of M31 as a function of position in the disk allows searches for patterns of star formation in the disk on timescales comparable to and shorter than an orbital period, before the structures are lost in the complications of disk dynamics. These measurements provide a first look at the possible discoveries from such studies, although the depth and accuracy limitations of ground-based photometry make strong conclusions difficult to obtain.
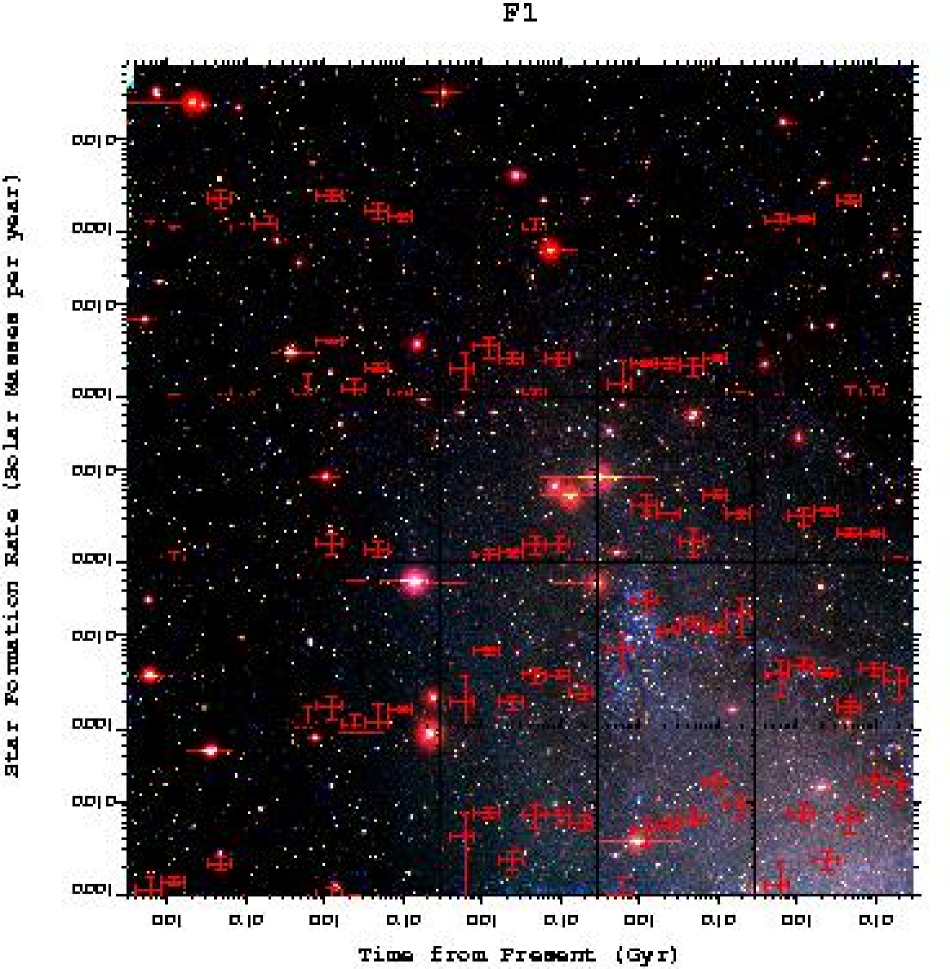
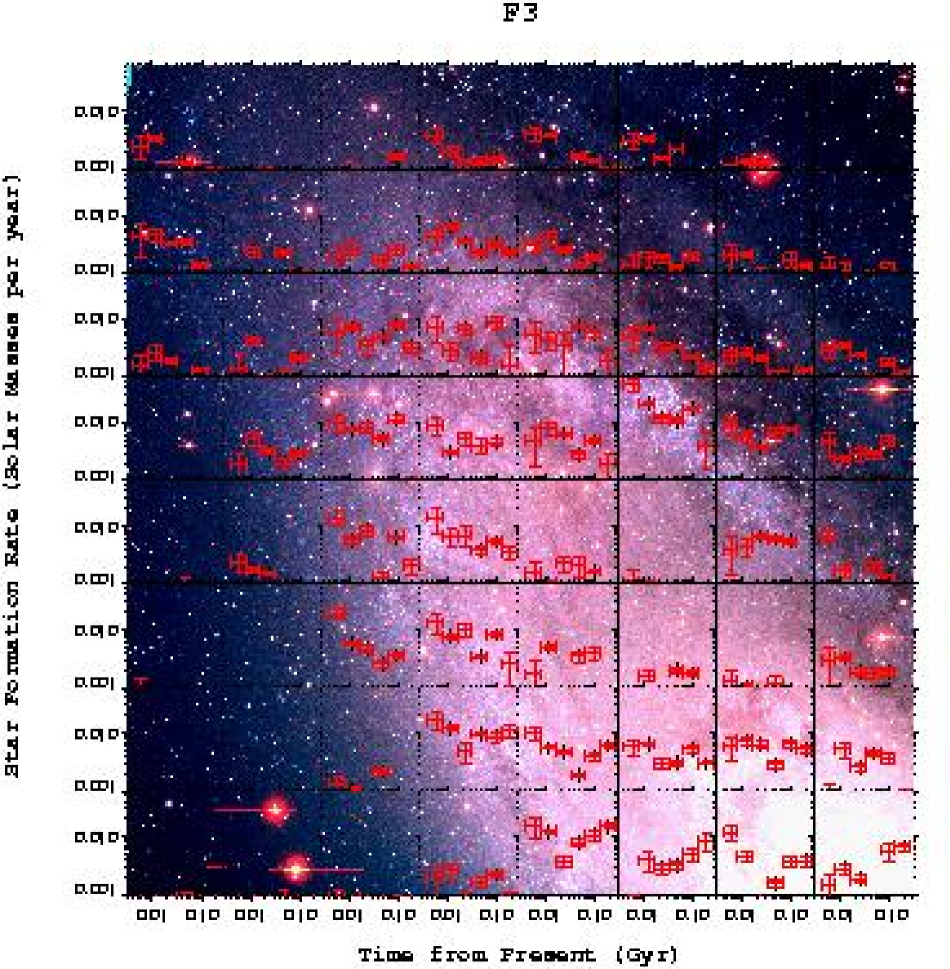
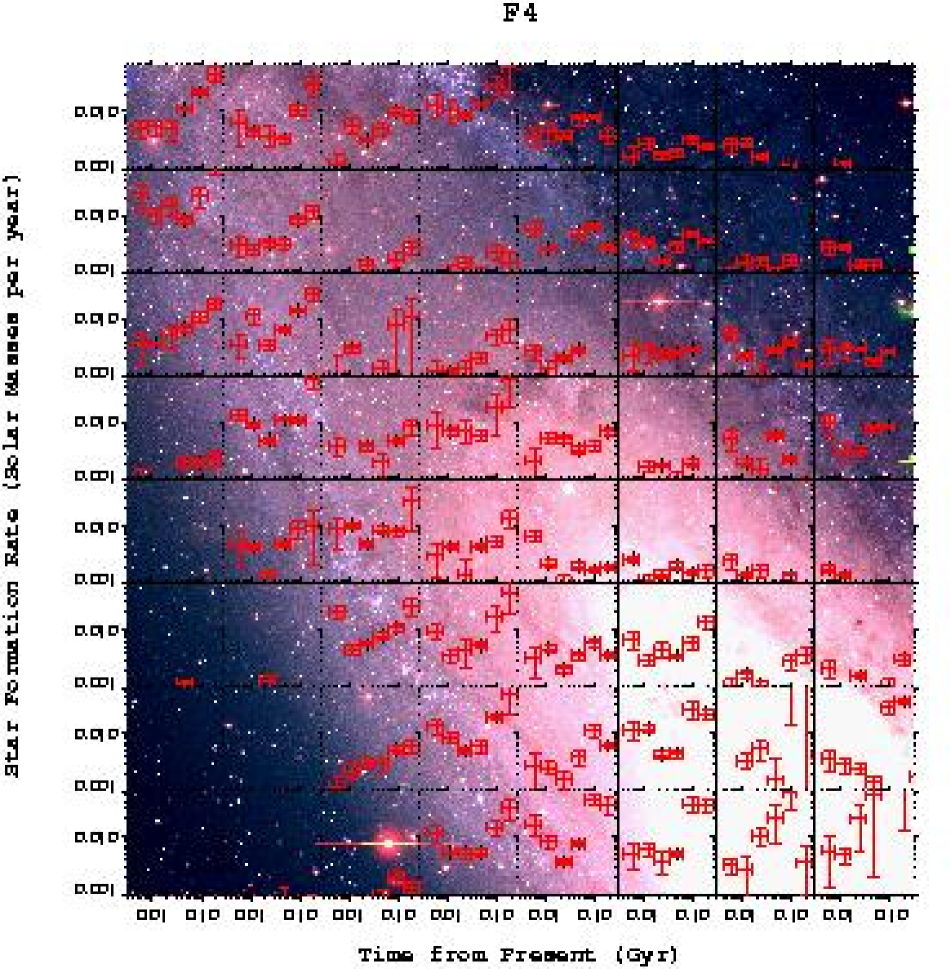
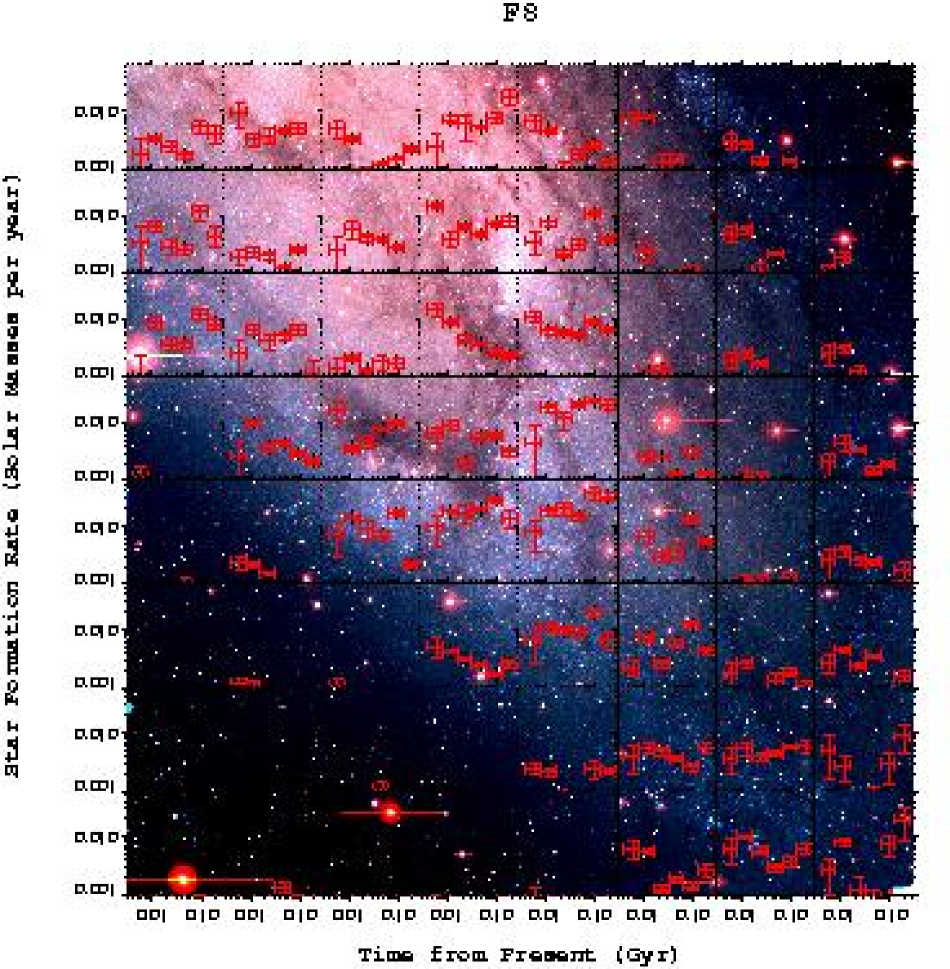
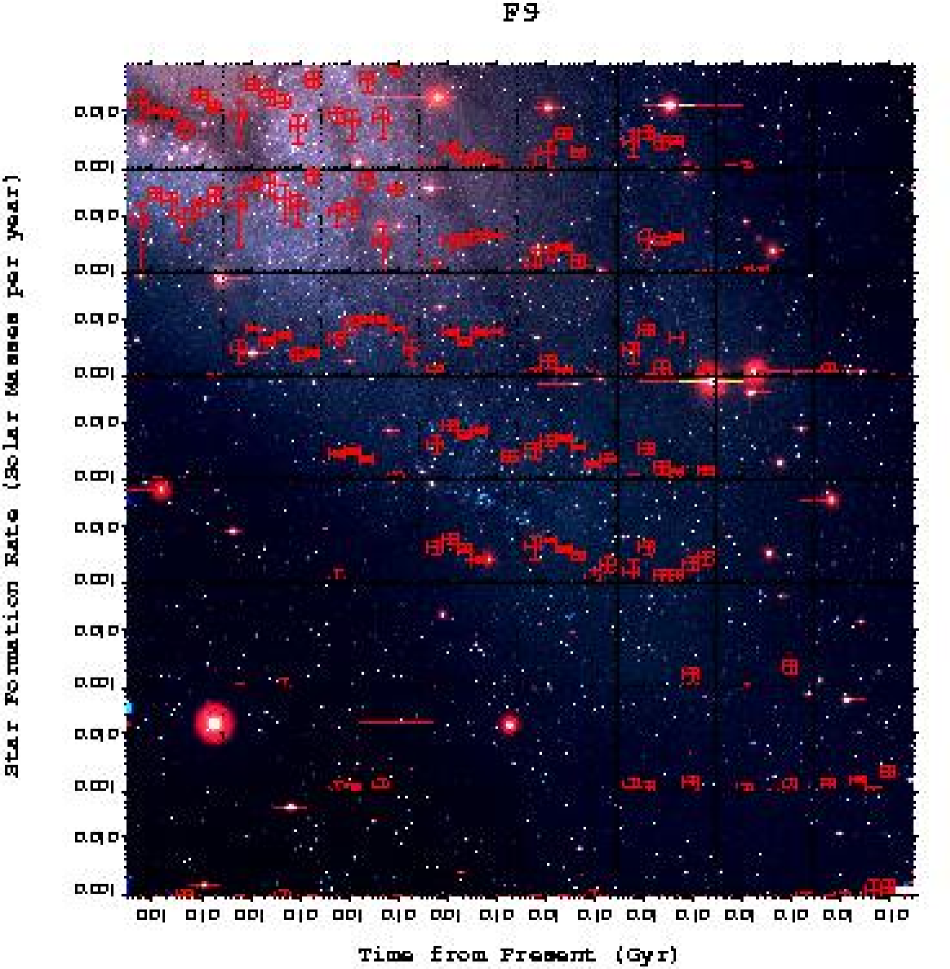
Figures 3-8 show three-color images of the 6 fields in M31 analyzed. Overplotted on these images are the SFHs output by MATCH for each cell on the field. The star formation rate for each epoch is shown with red error bars within the cell. The tickmarks on the abscissa and ordinate provide the time period and star formation rate indicated by the red error bars in each cell. The interpretation of these SFHs for each field is given below.
3.2.1 F1
Field F1, shown in Figure 3, was the outermost field analyzed, in order to provide comparisons to the inner disk. Since there are very few young stars in these outer regions, a larger region size of 6.9’ 6.9’ was used for each measurement. The larger cell sizes degraded the ability to look for star formation patterns, but this sacrifice was necessary in order to obtain results with statistical meaning.
This field shows that most of the recent star formation is limited to the inner disk. A strong decrease in young stars is seen from OB 102 (J2000 00:46:35,41:10:00) outward. A similar effect is seen in the southern disk (F9), discussed below. A rapid increase in star formation is seen about 20 Myr ago in OB 102 (cell F1 4,2) along with an overdensity of stars with ages 200 Myr, as seen in W3. With this larger picture, a decline in star formation is visible to the southwest of the large OB association, revealing a possible propagation of star formation from the southwest to the current location of OB 102.
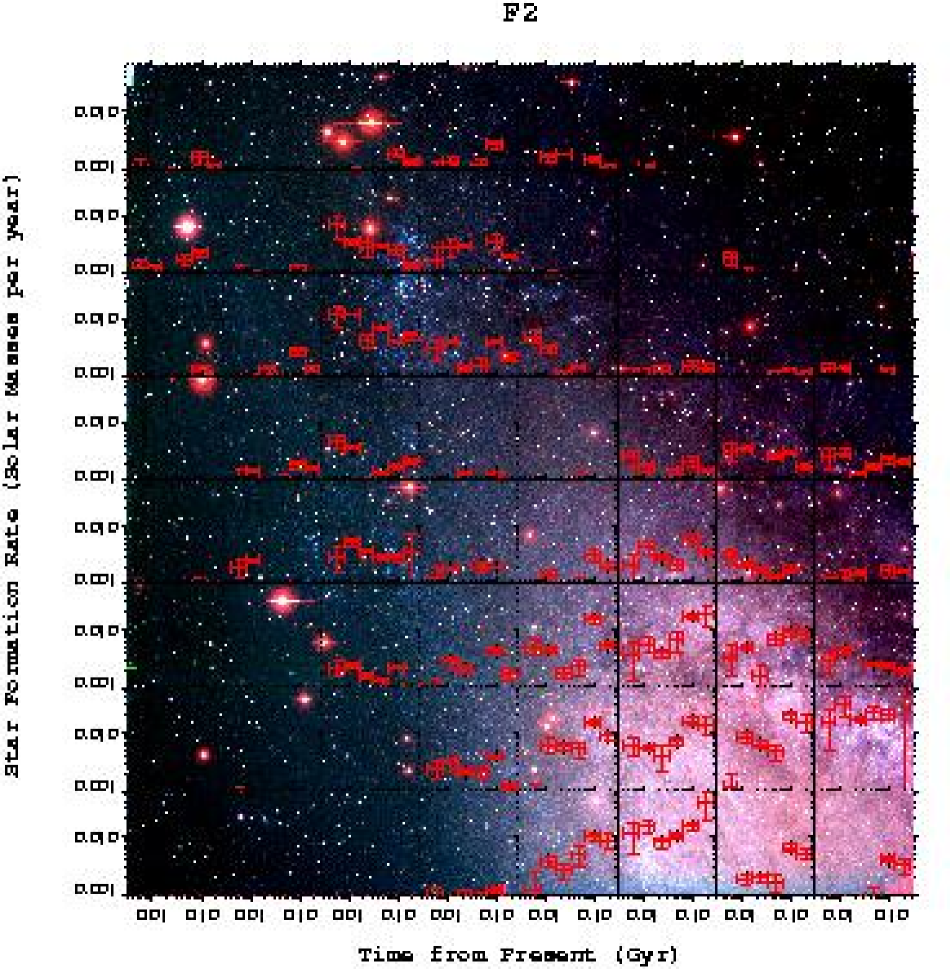
3.2.2 F2
Field F2 is shown in Figure 4. Again the SFH around OB 102 is measured; this time with smaller spatial bins. The pattern to the southwest of OB 102, detected in F1, is no longer seen. Apparently, large area sections were needed to detect this pattern; however, most of the youngest stars appear to lie on the eastern side of the OB association, consistent with the pattern seen in F1 (cells F2 3,6, F2 4,6, F2 3,7).
This field also provides the first look at the SFH of the brighter inner disk. Significant activity is visible around OB 54 (J2000 00:44:30,41:51:00) in the northwest spiral arm and OB 49 (J2000 00:45:10,41:47:00) in the northeast spiral arm. This enhanced star formation appears to have been ongoing, though not constant, as far back as the data are sensitive, suggesting that most of the star formation in the disk has occurred in contained regions for several hundred Myr. This result was also found by Bellazzini et al. (2003) and Williams (2002). These age distributions could be caused by propagating episodes of star formation, as discussed in section 4.3.
3.2.3 F3
Field F3, shown in Figure 5, contains several large groupings of hot, blue stars. The pattern seen among these most-recently active regions of the disk appears to be one of prolonged star formation with a recent burst beginning about 20-50 Myr ago. This recent burst explains the large populations of bright stars; however, the enhanced star formation before the bursts, common in many of the arm regions, is puzzling. Interestingly, the SFHs in the arms tend to show a decrease in star formation rate from 100 Myr to 50 Myr, followed by an increase to the present. The details of this pattern are different for each region, but overall, it looks like these regions are experiencing cycles of star formation on timescales of 10-200 Myr. Such a pattern would be difficult to believe if seen in only one or two arm regions, but when viewed in comparison with the surrounding galaxy, conclusion are more easily drawn.
3.2.4 F4
Field F4, shown in Figure 6, was the innermost field analyzed. This field reaches into the bulge of M31, where the crowding becomes too severe to perform reliable photometry from the ground. This crowding causes the large errors for star formation rates from 20-200 Myr ago in the southwestern-most regions of this field. Overall, the significant recent star formation clearly follows the well-studied spiral arms.
In conjunction with the results from field F3, an interesting pattern emerges around OB 54 (J2000 00:44:30,41:51:00) which lies in cell F3 5,4. In F3 this OB association is well-centered in the cell and we see the strong rise in star formation rate in this region over the past 20 Myr, similar to other OB associations in the disk. The cell just north of the OB association appears to have recently increased its star formation as well. This increase is detected in both the F3 and the F2 measurements. At the same time, in F4, where the southern half of the association is measured separately in cells F4 2,7 and F4 3,7, it appears that star formation has recently decreased in the southern half of this association, again suggesting that the star formation is moving generally south to north, consistent with what has been suggested in the southern disk and with the pattern seen around OB 102 (see section 3.2.1). This propagation is again only seen over a small region, and may be revealing the process of episodic star formation in these gas-rich regions.
3.2.5 F8
Field F8, shown in Figure 7, appears to contain most of the recent star formation in M31. This fact is accentuated by the dust spurs that curl off to the west of the main disk. Similar spurs have recently been observed in more active spirals, one of the best examples is M51 (Scoville et al., 2001). These spurs have been well-modeled by dynamical simulations as occurring when differentially rotating gas interacts with spiral arm structures (Kim & Ostriker, 2002). These structures are apparently signals of strong action caused by spiral arms.
Studies of the Cepheids (Magnier et al., 1997b), bright stars (Ivanov & Kynchev, 1985) and star clusters (Williams & Hodge, 2001b) in the region around OB 78 suggest that star formation has been propagating from south to north over the past 100 Myr. No age gradient was seen in the smaller sample measured in W3; however, this larger study reveals a ramping down in star formation south of OB 78, a recent ramp up at OB 78, and no strong trends to the north. This pattern of star formation is clearly a detection of the pattern seen in the star clusters, bright stars, and Cepheids. This strong wave of star formation appears to be connected with the interaction of the gas disk with the spiral arms, which also likely created the spur structures seen to the west of the disk.
3.2.6 F9
Field F9, shown in Figure 8, contains very little activity in the outer southwest region. The decreasing number of young stars in the southwestern cells confirms the radial age gradient in the disk. Again the recent drop in star formation rate south of OB 78 is seen. Without the results from F8, the drop would be less obvious since it is only seen in the data point for the most recent epoch. Fortunately, we can attach more significance to this data point because of the results from the overlapping portion of field F8.
4 Discussion
In order to interpret the SFH measurement results, several comparisons were performed. Results for overlapping regions were quantitatively compared to test for accuracy. Results for the northern and southern disk were compared to look for evolutionary differences across the galaxy. Results for the arm and interarm regions were compared to look for the effects of propagating spiral density waves. Finally, all of the results were combined to look for large scale patterns in star formation throughout the M31 disk.
4.1 Comparison of Overlapping Frames
The independent measurements of similar areas in different fields allowed important checks of the reliability of the measurement technique. There were 106 pairs of cells with centers within 3′ of one another. The consistency of the measurements was checked by applying a analysis to the SFHs of each pair. These measurements were accomplished by squaring the difference between the measured star formation rates of each time bin. The differences were each divided by the sum of the measured square errors of each measurement. These measured square errors were tripled, as experiments performed in W3 show that the errors tend to be underestimated in these measurements. The sum of these differences was finally divided by the number of degrees of freedom (5 for these SFHs) to give a reduced for each cell pair. For convenience, this reduced statistical comparison is simply called for the remainder of the paper. The values obtained for all overlapping fields are provided in Table 1, where column 1 provides the cell pair, column 2 shows the angular distance between the cell centers, column 3 gives the comparison, and column 4 provides the value if one outlier is removed from the calculation.
The distribution of values for the overlapping cells was compared to values measured for random cell pairs. The two distributions are shown in Figure 9. The reduced values for the overlapping cells clearly peak around a value of 1, while those of random cell pairs are randomly distributed. In total, 23% of random cell pairs had 3 while 64% of overlapping cell pairs have such values. This result suggests that the details of the SFHs for each cell are only reliable at about the 50% level. When combined with results from nearby and overlapping cells, this confidence may be improved, but conclusions should not be drawn based on the details of the SFH of any one cell. The 36% of overlapping pairs that have high values suggest that this issue should be investigated in more detail, by comparing the general trends in SFH measured in overlapping cells and investigating the typical causes for high values.
Some overlapping cells with high values show agreement in general SFH trend. For example, the rather constant rate in F8 7,2 is reproduced in F9 5,5 although the =6.51 because of discrepancies in early epochs. The increasing rate in F8 7,1 is reproduced in F9 5,4 ( = 4.57), and the high is again caused by discrepancies in early epochs. These early epochs are likely to be less reliable because the measured rates depend heavily on the precise completeness near the magnitude limit of the data.
There is generally good agreement between overlapping cells in regions with large numbers of young stars. For example, in the most active area of F1, around OB 102, the closest overlapping cell pairs, F1 4,2 and F2 3,6 have a of 0.40. To the southwest, cell pair F1 5,1 and F2 5,4 have a of 0.70. All of the overlapping cells west and south of OB 54 show nice agreement, as exemplified by the striking similarity of the complex history shown for cell pair F3 7,1 and F4 5,4 ( = 1.55), showing a rapid increase in activity over the past 20 Myr for this region. Comparison of the cells F2 8,2 and F3 6,5, which contain the complex region of OB 54, also obtain consistent results ( = 1.02), showing enhanced activity back to 100 Myr and further increased star formation 10 Myr ago. In addition, the cells south of OB 78 (F8 5,5 and F9 3,8: =1.63; F8 5,4 and F9 3,7: =1.31) show excellent overall agreement, revealing a mean decrease in star formation in this region over the past 20 Myr.
Most poor values were due to the results of a single epoch. If is calculated after removing a single outlier from each SFH, 92% of the overlapping pairs have , and only 41% of random pairs match this well. In order to assess whether these single time-bin inconsistencies occurred because the boundaries of overlapping cells were not perfectly aligned, we experimented with aligning overlapping cells. For example, cell F2 7,2 has a somewhat different result than cell F3 5,5 ( = 3.12). Exactly matching the cell regions improved the consistency of the measurements to = 2.20; however, exclusion of the outlying data point at 100 Myr yields = 0.76. Apparently, the exact borders of the cells do not strongly affect the consistency of results. The inconsistencies must arise from more subtle differences in the photometry of the overlapping frames. In any case, drastic changes in star formation rate between adjacent epochs within a single cell are rarely observed in overlapping frames. Such changes are responsible for most high values, and they should not be trusted unless verified by a consistent measurement in adjacent or overlapping cells. Conclusions cannot be drawn based on star formation rates measured only once for single epochs.
Overall, the comparisons of overlapping cells reveal that SFHs measured within individual cells are reliable at about the 50% level. The independent results for overlapping cells in active regions show agreement (), providing confidence that the measurement technique is stable. The confidence level increases for more recent epochs, cells with greater numbers of bright stars, cells measured independently in separate fields, and groups of cells showing similar star formation patterns. Most overlapping cell pairs with large have one highly inconsistent data point. Star formation rates that deviate from general trends within a single SFH are generally not reproduced in overlapping cells, and these deviant points are typically responsible for high values in overlapping cell pairs. This problem shows that deviant rates measured for individual epochs within single cells are not reliable.
4.2 The Northern and Southern Regions
Overall, the star formation of the northern and southern disks appears to have been quite different over the past 200 Myr. Most striking are the higher recent star formation rates measured for the outer regions of the southern disk compared to those of the northern disk. This difference is seen most easily along the major axis, where the star formation rates have been higher in the southwest corner of F8 than in the northeast corner of F3 for the past 100 Myr. The difference is not entirely surprising considering the larger numbers of open clusters observed in the southwestern half of the disk (Hodge, 1979); however, the result is surprising considering the weaker gas emission from the southwestern disk (Devereux et al., 1994) and the smaller number of OB associations in the southwestern half of the disk (van den Bergh, 1964).
In addition, the outer western half of the disk has been more active recently than the outer eastern half. The entire western side of field F8 (cells F8 8,1 - F8 8,6) consistently shows significant star formation over the past 100 Myr, while only 2 of the cells F3 1,2 - F3 1,8 show significant activity over the same period. A similar difference is seen between the northwest disk and southeast disk, where the northwest disk is more active. This difference is unlikely to be attributable to the fact that the western half is closer than the eastern half because the young stars are bright and the extinction is not strong in these outer regions.
Only 2 regions in the disk appear to have been forming stars at a high rate for all 6 epochs. Those areas are the area around OB 54 in the northwest arm and the area around OB 78 in the southern disk. The star formation around OB 78 is certainly the stronger of the two. It is interesting to note that M32 and NGC 205, the nearest galaxies to the M31 disk, lie to the south and northwest of the disk. The differences observed between the northern and southern disk may be due to interaction with M32, which could be strong as seen in the tidal stream recently detected around the southern part of the disk (Ibata et al., 2001) and in models of the M31-M32 interaction (e.g. Byrd, 1978). The higher rates in the northwest could have been caused by interactions with NGC 205 and/or M32. This interpretation is certainly speculative, but the locations of these more active outer disk regions are curiously consistent with such a scenario.
4.3 The Arm and Interarm Regions
Our results reveal that the arm and interarm regions of M31 have been quite distinctive for most of the past 250 Myr. While the star formation rate in the arms has been relatively episodic, changing noticeably from epoch to epoch, the interarm regions have been relatively inactive the entire time. This greater amount of star formation in the arms has likely been possible because of the greater gas content of the arm regions. These regions have been observed to have enhanced gas content in many studies (e.g. Brinks & Shane, 1984 (H I); Dame et al., 1993 (CO); and many others).
Only in epoch 4 were the star formation rates of the arm and interarm regions similar. This similarity occurred because the star formation rate in the arms became quite low. In fact, this epoch contained the least amount of star formation of any epoch measured (see Table 2 and Figure 10). The long-lived inactivity in the interarm regions suggests that, if density waves propagated through these regions, the density enhancements were not strong enough to overcome the low ambient gas density and significantly increase star formation. The propagation of star formation through some gas-rich regions is suggested by the global patterns of star formation discussed in the next section. These results suggest that strong star formation activity is not likely to propagate far through the disk because the gas-poor interarm regions do not support significant star formation episodes even under the influence of a density wave passage.
4.4 Global Properties of the Recent SFH
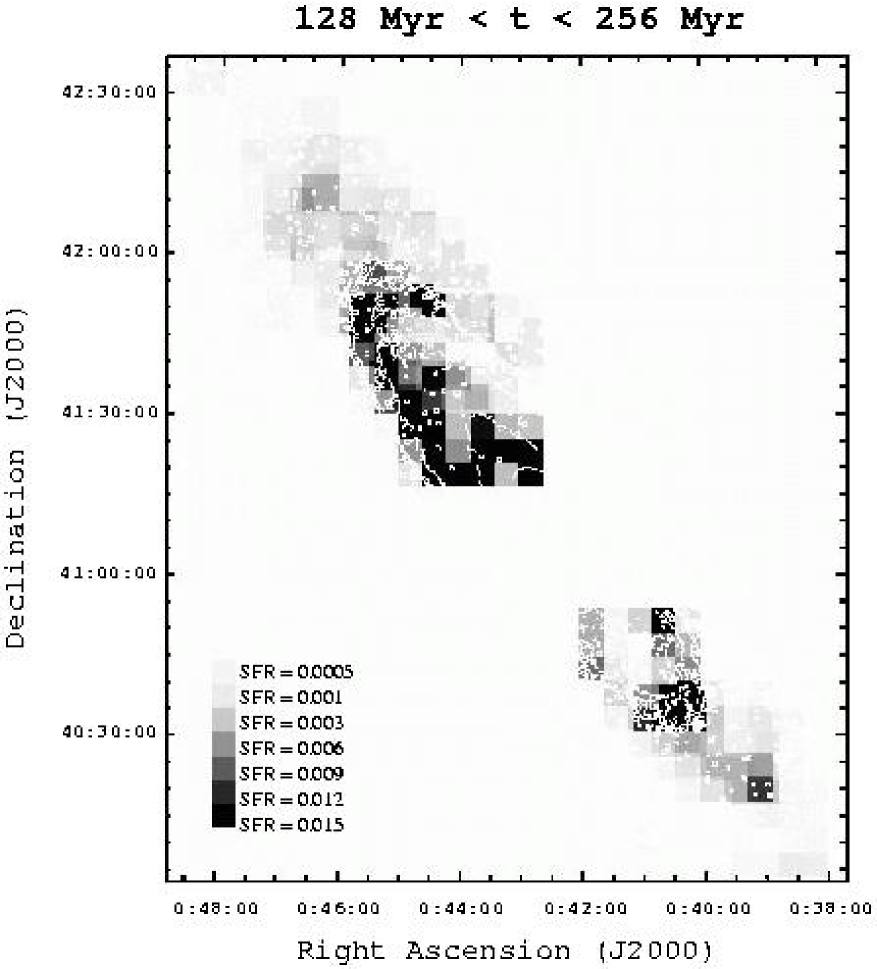
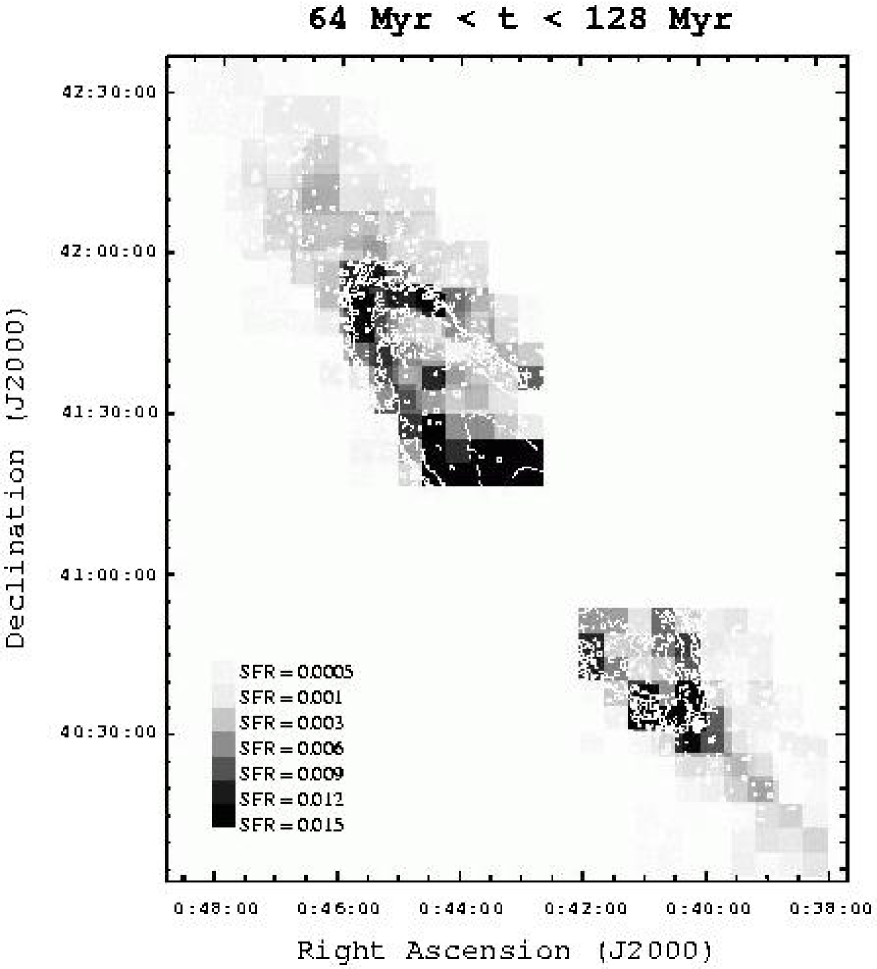
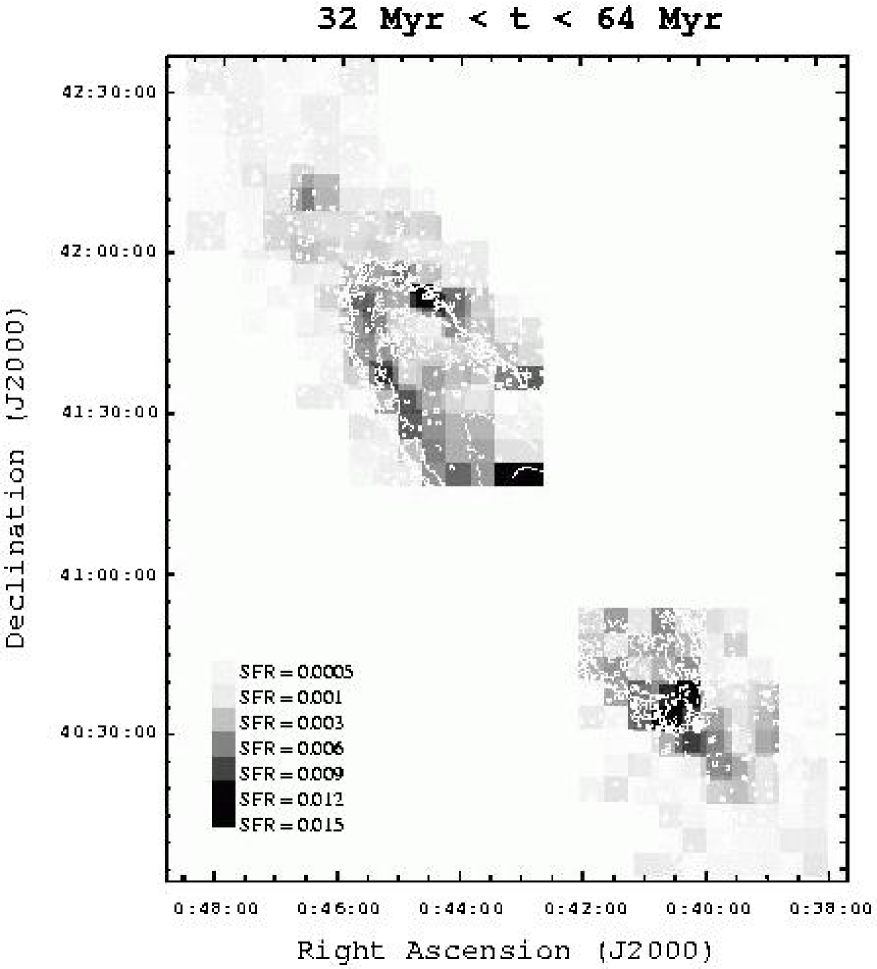
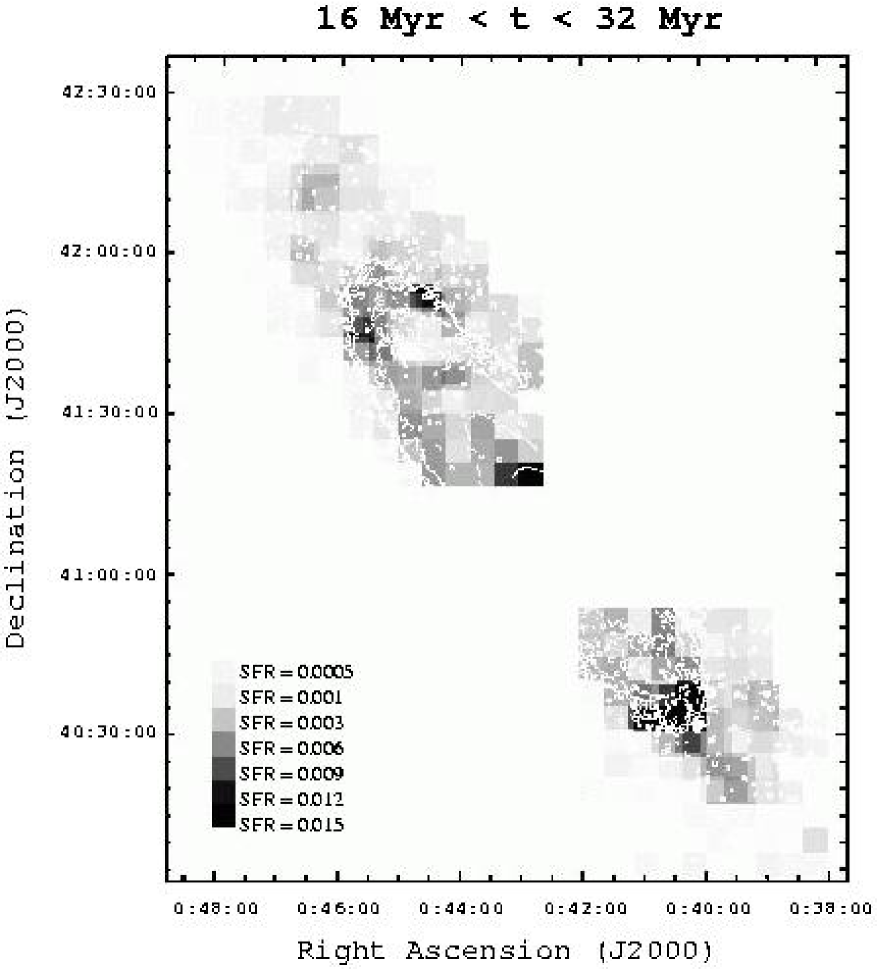
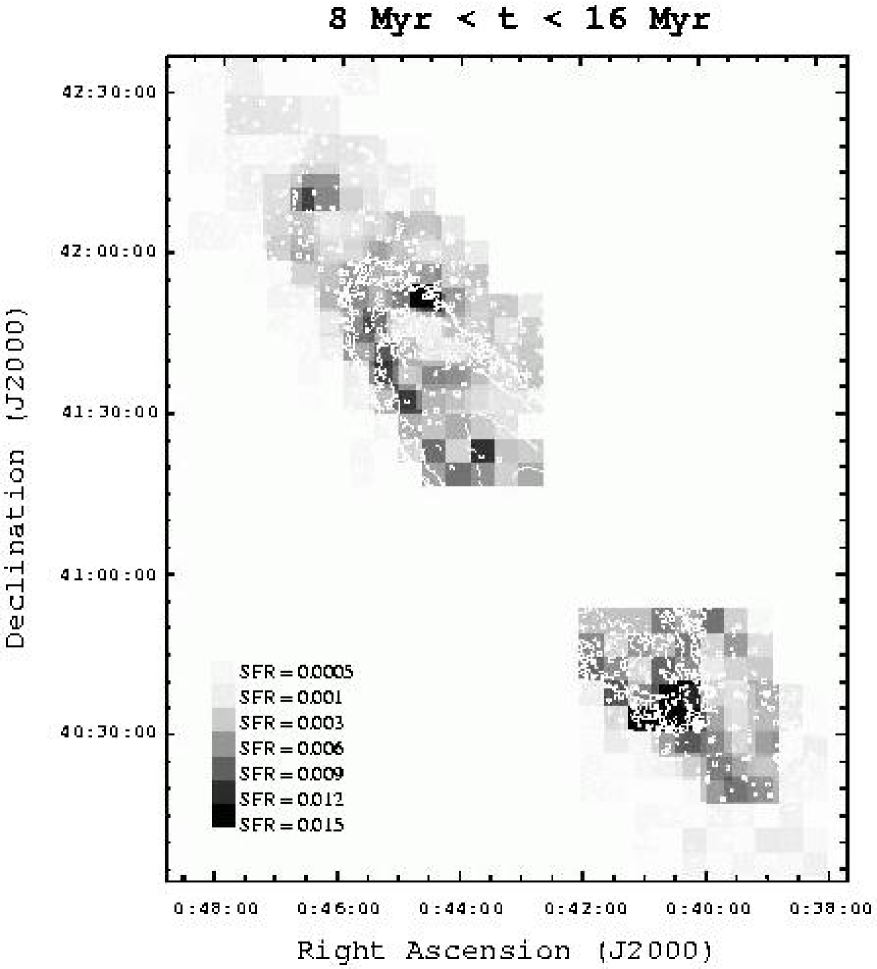
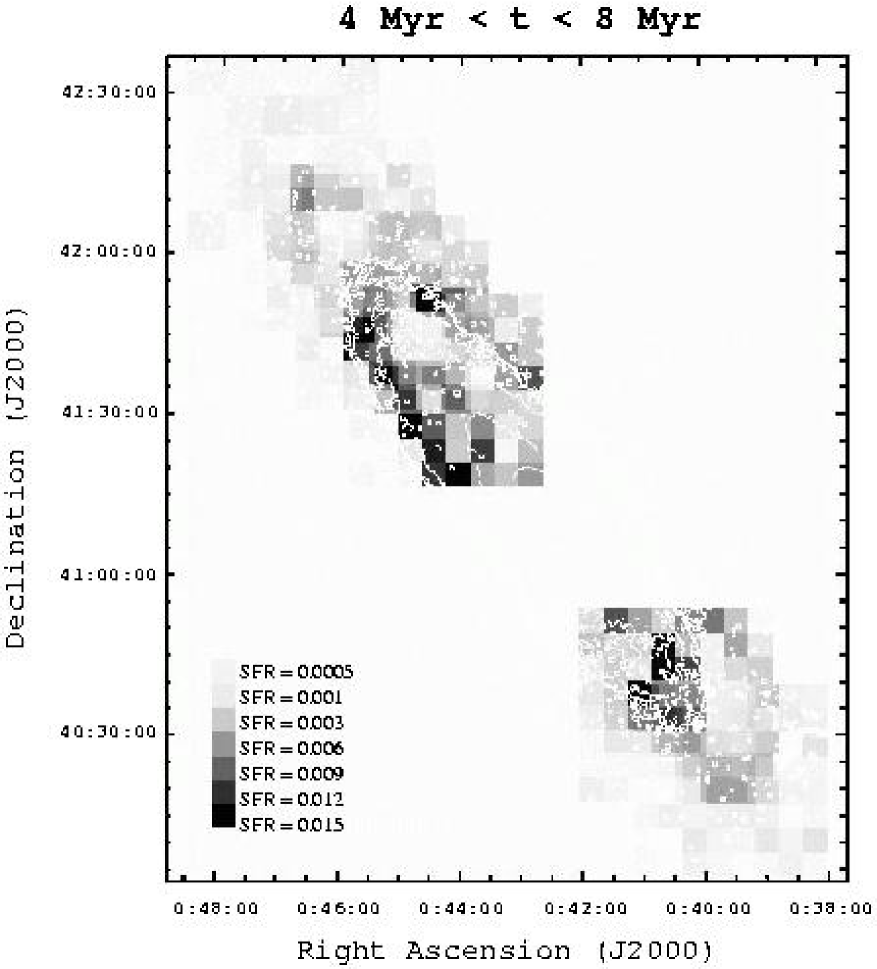
Perhaps the most useful application of these results is seen in Figure 10, where the results for the star formation rate during each epoch in each cell have been combined into greyscale maps. In these maps, darker gray areas have higher star formation rates. Each epoch probed by the analysis is shown separately. Results for overlapping regions of cells were averaged to make the best use of the multiple measurements in those cells. Each map is overplotted with an optical contour map of M31 so that it is easy to see the location of the galaxy in these star formation rate maps. An overall assessment of these images is described in Table 2, where the total star formation rate calculated for these regions is shown for each epoch measured. A movie version of Figure 10 is available on the world wide web at http://www.astro.washington.edu/ben/m31_sfh.gif.
Globally, the images and the table both reveal a decrease in star formation from 200 Myr ago to 50 Myr ago. The difference lies in the intensity of the star formation in the active regions. Both the northern and southern spiral arms show more intense activity in epochs 1 and 2. Tests of the SFH measurement technique performed and described in W3, suggest that the star formation rate in epoch 1 may be systematically over-estimated in these results because of the dependence of this measurement on photometry near the magnitude limit of the data. However, the measurements for epoch 2 performed well in the same tests. In addition, the decrease in star formation rate does not occur in all of the active regions, decreasing the likelihood that it is the result of systematic errors. For example, the region south of OB 78 (J2000 0:40:00, 41:30:00) does not show this drop. The fact that the strong decrease in the star formation rate between epochs 2 and 3 is likely to be real suggests that significant changes in the global star formation rate can occur on timescales of 100 Myr.
Another obvious change seen during these epochs is a steady decrease in star formation in the bulge region. These measurements are not reliable. The rates measured for the bulge region are highly uncertain in the older epochs due to the high crowding in this region (see Figure 6). These large errors allow for higher star formation rates in the earlier epochs.
The details of these maps are best analyzed by blinking through the
epochs and watching for areas where the star formation shows evidence
for bursts or propagation. This viewing option is available in a
movie located on the world wide web at
http://www.astro.washington.edu/ben/m31_sfh.gif. A
description of the differences as seen by such a technique will be
discussed. Between epochs 1 and 2, activity in the northeast spiral
arm decreased while that in the southeast spiral arm increased. Then,
between epochs 2 and 3, the activity of the northeast spiral arm
continued to decrease, and the activity in the southeast arm also
decreased. Here, a passage of a spiral density wave is suggested in
epochs 1, 2 and 3, as star formation left the northeast spiral arm,
entered the southeast arm, and then exited the southeast arm.
During epochs 1-3, the region around OB 54 (J2000 00:42:50,41:37:00; the northwest spiral arm) was undergoing a similar experience to the southeast arm. This area shows little activity in epoch 1, then it shows a burst of activity covering epochs 2 and 3 before settling down in epoch 4. These findings suggest the passage of a density wave through this region over a similar time period as one passing through the southeast arm, indicating symmetry in these two areas.
In epochs 3 and 4, the disk as a whole went through its weakest period of star formation. While the arms continued to form stars at a lower rate, most of the strong star formation became confined to a few large OB associations (OB 48, OB 49, OB 54, OB 78, OB 102). Then, in epoch 5, activity increased again in both the northeast and southeast arms. The regions southeast and east of OB 78 also began to form more stars, and OB 102 became strongly active.
Finally, from epoch 5 to epoch 6, there were several significant changes in activity. Epochs 5 and 6 were only 8 Myr long and 4 Myr long respectively, meaning that these changes took place on a timescale of 10 Myr. In this period of time, the star formation rate in the northeast spiral arm increased. This recent increase was also seen in W3. The strong star formation south of OB 78 which pervaded all of the other epochs, finally fell off, likely due to gas depletion. The star formation in this region appears to have moved northward in this epoch, remaining strong in OB 78 and just northward, consistent with the pattern seen in Cepheid ages by Magnier et al. (1997b) and in star cluster ages by Williams & Hodge (2001b). Activity in OB 102 appears to have moved slightly eastward. The area of OB 59 became active again for the first time since epoch 3.
All of these changes seen in the SFH of the M31 disk suggest that some OB associations and spiral arms go through multiple episodes of star formation, likely attributable to the passage of density waves through these gas-rich regions of the disk.
Because the total star formation rate appears to have stayed fairly stable over the past 64 Myr, the measurements for epochs 3-6 were averaged in order to measure one precise mean recent star formation rate covering 1.4 deg2 (75%) of the M31 disk. The resulting recent star formation rate is 0.630.07 M. Extrapolating this value to the whole disk suggests a total rate of 1 M, which is in good agreement with the far infrared luminosity of M31 (Devereux et al., 1994), which provides a current star formation rate of 1 M using the conversion technique of Inoue et al. (2000).
5 Conclusions
The SFH of most of the M31 stellar disk has been measured back to 250 Myr ago using photometry of 6 fields taken with the MOSAIC camera on the 4-m telescope at KPNO. The distance, mean extinction, and stellar age distribution were determined independently for each 18.5 arcmin2 portion of the fields (47.3 arcmin2 portions in the outermost field). Reliability of these measurements was assessed based on the consistency of measurements in overlapping areas of the 6 fields and on tests of the measurement technique described in an earlier publication (W3).
The distances of all regions of the disk were consistent within the measured errors; however, the distances measured in the southern half of the disk provide a hint that the disk southeast of the major axis is the more distant, in agreement with the currently accepted orientation. Combining all 345 distance results gives a distance modulus to M31 of 24.470.03. This result is biased by the input distance modulus range of 24.4 to 24.5; however, these results constrain the distance to the upper end of the input range. This distance is also identical to several other recent measurements (e.g. Stanek & Garnavich, 1998, and Holland, 1998).
The mean extinction measurements show that the areas of higher extinction tend to follow the spiral arms, with the exception of the area around OB 78, where the dust appears to be depleted. This depletion was seen in W3, who suggested that the dust may have been blown out by the strong winds of large numbers of hot young stars.
The southern disk appears to have been more active in recent epochs than the northern disk, and the outer western disk appears to have been more active in recent epochs than the outer eastern disk. Areas of the disk showing persistent, strong activity appear in areas possibly influenced by interactions with NGC 205 and/or M32.
There is evidence of star formation propagation across some gas-rich regions of the disk. The strongest evidence favors a process of star formation that has been episodic and confined mainly to gas-rich regions of the arms for the past few hundred Myr. If these episodes have been caused by propagating density waves, the waves appear not to have caused episodes of star formation as they passed through gas-poor interarm regions.
Combination of all of the results provides a global SFH for most of the M31 disk for the past 250 Myr. The total star formation rate appears to have decreased by about 50% from 250 to 50 Myr ago. The lowest global rate then occurred about 25 Myr ago followed by a 20% increase over the past 20 Myr. Overall, the mean total star formation rate for this 1.4 deg2 (75%) of the M31 disk over the past 64 Myr has been 0.630.07 M⊙ yr-1. Scaling this value to the rest of the disk provides an estimated star formation rate of 1 M⊙ yr-1 for the M31 disk.
I thank the LGS for supplying the data used for this project, especially Phil Massey for his work in observing, preparing and providing the images for the photometric measurements. I thank Andrew Dolphin for supplying the software package necessary for the SFH analysis. Support for this work was provided in part by NASA through grant number GO-9087 from the Space Telescope Science Institute and by the Chandra X-ray Center under grant GO2-3103X.
References
- Bellazzini et al. (2003) Bellazzini, M., Cacciari, C., Federici, L., Fusi Pecci, F., & Rich, R. M. 2003, A&A, submitted (astro-ph/0212531)
- Brinks & Shane (1984) Brinks, E., & Shane, W. W. 1984, A&AS, 55, 179
- Byrd (1978) Byrd, G. G. 1978, ApJ, 226, 70
- Dame et al. (1993) Dame, T. M., Koper, E., Israel, F. P., & Thaddeus, P. 1993, ApJ, 418, 730
- Devereux et al. (1994) Devereux, N. A., Price, R., Wells, L. A., & Duric, N. 1994, AJ, 108, 1667
- Dolphin (1997) Dolphin, A. 1997, New Astronomy, 2, 397
- Dolphin (2002) Dolphin, A. E. 2002, MNRAS, 332, 91
- Ferguson & Johnson (2001) Ferguson, A. M. N., & Johnson, R. A. 2001, ApJ, 559, L13
- Haas et al. (1998) Haas, M., Lemke, D., Stickel, M., Hippelein, H., Kunkel, M., Herbstmeier, U., & Mattila, K. 1998, A&A, 338, L33
- Hodge (1979) Hodge, P. W. 1979, AJ, 84, 744
- Hodge (1992) Hodge, P. W. 1992, The Andromeda galaxy (Astrophysics and Space Science Library, Dordrecht: Kluwer, 1992)
- Holland (1998) Holland, S. 1998, AJ, 115, 1916
- Hubble (1929) Hubble, E. P. 1929, ApJ, 69, 103
- Ibata et al. (2001) Ibata, R., Irwin, M., Lewis, G., Ferguson, A. M. N., & Tanvir, N. 2001, Nature, 412, 49
- Inoue et al. (2000) Inoue, A. K., Hirashita, H., & Kamaya, H. 2000, PASJ, 52, 539
- Ivanov & Kynchev (1985) Ivanov, G. R., & Kynchev, P. Z. 1985, Soviet Astronomy Letters, 11, 310
- Kim & Ostriker (2002) Kim, W., & Ostriker, E. C. 2002, ApJ, 570, 132
- Kodaira et al. (1999) Kodaira, K., Vansevicius, V., Tamura, M., & Miyazaki, S. 1999, ApJ, 519, 153
- Magnier et al. (1997a) Magnier, E. A., Hodge, P., Battinelli, P., Lewin, W. H. G., & van Paradijs, J. 1997a, MNRAS, 292, 490
- Magnier et al. (1992) Magnier, E. A., Lewin, W. H. G., van Paradijs, J., Hasinger, G., Jain, A., Pietsch, W., & Truemper, J. 1992, A&AS, 96, 379
- Magnier et al. (1997b) Magnier, E. A., Prins, S., Augusteijn, T., van Paradijs, J., & Lewin, W. H. G. 1997b, A&A, 326, 442
- Massey et al. (2001) Massey, P., Hodge, P. W., Holmes, S., Jacoby, G., King, N. L., Olsen, K., Saha, A., & Smith, C. 2001, in American Astronomical Society Meeting, Vol. 199, 13005
- Mochejska et al. (2001) Mochejska, B. J., Kaluzny, J., Stanek, K. Z., & Sasselov, D. D. 2001, AJ, 122, 1383
- Mochejska et al. (2000) Mochejska, B. J., Macri, L. M., Sasselov, D. D., & Stanek, K. Z. 2000, AJ, 120, 810
- Sarajedini & Van Duyne (2001) Sarajedini, A., & Van Duyne, J. 2001, AJ, 122, 2444
- Scoville et al. (2001) Scoville, N. Z., Polletta, M., Ewald, S., Stolovy, S. R., Thompson, R., & Rieke, M. 2001, AJ, 122, 3017
- Stanek & Garnavich (1998) Stanek, K. Z., & Garnavich, P. M. 1998, ApJ, 503, L131
- Stetson et al. (1990) Stetson, P. B., Davis, L. E., & Crabtree, D. R. 1990, in ASP Conf. Ser. 8: CCDs in astronomy, 289
- van den Bergh (1964) van den Bergh, S. 1964, ApJS, 9, 65
- Williams (2002) Williams, B. F. 2002, MNRAS, 331, 293
- Williams (2003) Williams, B. F. 2003, MNRAS, 340, 143 (W3)
- Williams & Garcia (2003) Williams, B. F., & Garcia, M. R. 2003, in press
- Williams & Hodge (2001a) Williams, B. F., & Hodge, P. W. 2001a, ApJ, 559, 851
- Williams & Hodge (2001b) Williams, B. F., & Hodge, P. W. 2001b, ApJ, 548, 190
- Xu & Helou (1996) Xu, C., & Helou, G. 1996, ApJ, 456, 152

| Cell Pair | RaaDistance between cell centers (arcmin) | bbAll epochs included | ccOne outlier epoch excluded |
|---|---|---|---|
| F1 3,1 and F2 2,4 | 2.03 | 1.25 | 0.87 |
| F1 3,1 and F2 2,5 | 2.68 | 0.90 | 0.66 |
| F1 3,2 and F2 2,6 | 0.69 | 2.37 | 1.35 |
| F1 3,3 and F2 2,7 | 2.89 | 1.36 | 1.36 |
| F1 3,3 and F2 2,8 | 1.82 | 1.51 | 0.11 |
| F1 4,1 and F3 1,7 | 2.95 | 1.33 | 1.33 |
| F1 4,1 and F3 1,8 | 2.51 | 2.08 | 1.30 |
| F1 4,2 and F2 3,6 | 2.96 | 0.40 | 0.40 |
| F1 5,1 and F2 5,4 | 1.98 | 0.70 | 0.63 |
| F1 5,1 and F2 5,5 | 2.65 | 1.54 | 1.26 |
| F1 5,1 and F3 3,8 | 1.81 | 0.99 | 0.84 |
| F1 5,2 and F2 5,6 | 0.54 | 2.58 | 2.58 |
| F1 5,3 and F2 5,7 | 2.85 | 2.11 | 1.76 |
| F2 3,1 and F3 1,4 | 1.54 | 0.52 | 0.34 |
| F2 3,2 and F3 1,5 | 1.54 | 0.69 | 0.14 |
| F2 3,3 and F3 1,6 | 1.54 | 2.88 | 1.92 |
| F2 3,4 and F3 1,7 | 1.54 | 0.80 | 0.34 |
| F2 3,5 and F3 1,8 | 1.55 | 4.26 | 2.62 |
| F2 4,1 and F3 2,4 | 1.54 | 5.33 | 3.79 |
| F2 4,2 and F3 2,5 | 1.54 | 1.70 | 1.44 |
| F2 4,3 and F3 2,6 | 1.54 | 2.19 | 1.61 |
| F2 4,4 and F3 2,7 | 1.54 | 6.25 | 2.23 |
| F2 4,5 and F3 2,8 | 1.55 | 9.31 | 2.15 |
| F2 5,1 and F3 3,4 | 1.54 | 2.33 | 2.17 |
| F2 5,2 and F3 3,5 | 1.54 | 2.92 | 1.14 |
| F2 5,2 and F3 3,6 | 2.28 | 2.67 | 1.58 |
| F2 5,2 and F4 1,8 | 3.46 | 1.75 | 1.48 |
| F2 5,3 and F3 3,6 | 2.92 | 3.63 | 2.37 |
| F2 5,3 and F3 3,7 | 2.28 | 6.87 | 4.34 |
| F2 5,4 and F3 3,7 | 2.92 | 0.98 | 0.68 |
| F2 5,4 and F3 3,8 | 2.28 | 4.13 | 0.65 |
| F2 5,5 and F3 3,8 | 2.92 | 9.05 | 2.01 |
| F2 6,1 and F3 4,4 | 1.54 | 2.98 | 2.02 |
| F2 6,1 and F4 2,7 | 3.46 | 3.47 | 2.29 |
| F2 6,2 and F3 4,5 | 1.54 | 3.80 | 2.31 |
| F2 6,2 and F4 2,8 | 3.46 | 1.33 | 0.41 |
| F2 6,3 and F3 4,6 | 1.54 | 1.51 | 1.17 |
| F2 6,4 and F3 4,7 | 1.54 | 1.46 | 1.24 |
| F2 6,5 and F3 4,8 | 1.55 | 2.81 | 1.20 |
| F2 7,1 and F3 5,4 | 1.54 | 3.15 | 2.11 |
| F2 7,2 and F3 5,5 | 1.54 | 3.12 | 0.76 |
| F2 7,2 and F4 3,8 | 3.46 | 2.01 | 1.35 |
| F2 7,3 and F3 5,6 | 1.54 | 1.03 | 0.44 |
| F2 7,4 and F3 5,7 | 1.54 | 4.16 | 1.06 |
| F2 7,5 and F3 5,8 | 1.54 | 5.80 | 2.28 |
| F2 8,1 and F3 6,4 | 1.54 | 5.36 | 1.23 |
| F2 8,2 and F3 6,5 | 1.54 | 1.02 | 0.80 |
| F2 8,3 and F3 6,6 | 1.54 | 2.65 | 2.17 |
| F2 8,4 and F3 6,7 | 1.54 | 3.20 | 0.60 |
| F2 8,5 and F3 6,8 | 1.54 | 4.39 | 2.52 |
| F3 3,1 and F4 1,4 | 1.93 | 17.05 | 4.33 |
| F3 3,2 and F4 1,5 | 1.94 | 3.04 | 1.39 |
| F3 3,3 and F4 1,6 | 1.94 | 5.29 | 4.67 |
| F3 3,4 and F4 1,7 | 1.94 | 2.78 | 1.30 |
| F3 3,5 and F4 1,8 | 1.94 | 3.42 | 2.14 |
| F3 4,1 and F4 2,4 | 1.93 | 1.89 | 1.03 |
| F3 4,2 and F4 2,5 | 1.93 | 1.00 | 0.79 |
| F3 4,3 and F4 2,6 | 1.94 | 4.03 | 2.97 |
| F3 4,4 and F4 2,7 | 1.94 | 1.29 | 1.04 |
| F3 4,5 and F4 2,8 | 1.94 | 1.18 | 0.95 |
| F3 5,1 and F4 3,4 | 1.93 | 0.39 | 0.33 |
| F3 5,2 and F4 3,5 | 1.93 | 16.79 | 0.63 |
| F3 5,3 and F4 3,6 | 1.94 | 1.02 | 0.74 |
| F3 5,4 and F4 3,7 | 1.94 | 1.09 | 0.65 |
| F3 5,5 and F4 3,8 | 1.94 | 7.76 | 2.34 |
| F3 6,1 and F4 4,4 | 1.93 | 0.52 | 0.38 |
| F3 6,2 and F4 4,5 | 1.93 | 0.72 | 0.46 |
| F3 6,3 and F4 4,6 | 1.93 | 1.15 | 0.94 |
| F3 6,4 and F4 4,7 | 1.94 | 1.93 | 1.50 |
| F3 6,5 and F4 4,8 | 1.94 | 1.48 | 1.33 |
| F3 7,1 and F4 5,4 | 1.93 | 1.55 | 1.33 |
| F3 7,2 and F4 5,5 | 1.93 | 0.64 | 0.51 |
| F3 7,3 and F4 5,6 | 1.93 | 7.56 | 2.38 |
| F3 7,4 and F4 5,7 | 1.94 | 5.73 | 3.27 |
| F3 7,5 and F4 5,8 | 1.94 | 0.86 | 0.30 |
| F3 8,1 and F4 6,4 | 1.93 | 4.05 | 3.14 |
| F3 8,2 and F4 6,5 | 1.93 | 3.60 | 1.14 |
| F3 8,3 and F4 6,6 | 1.93 | 0.97 | 0.44 |
| F3 8,4 and F4 6,7 | 1.94 | 30.65 | 17.11 |
| F3 8,5 and F4 6,8 | 1.94 | 2.53 | 0.79 |
| F8 3,1 and F9 1,4 | 2.02 | 1.96 | 0.49 |
| F8 3,2 and F9 1,5 | 2.02 | 0.84 | 0.66 |
| F8 3,3 and F9 1,6 | 2.02 | 3.51 | 2.18 |
| F8 3,4 and F9 1,7 | 2.03 | 0.97 | 0.44 |
| F8 3,5 and F9 1,8 | 2.03 | 5.32 | 3.53 |
| F8 4,1 and F9 2,4 | 2.02 | 1.57 | 1.04 |
| F8 4,2 and F9 2,5 | 2.02 | 0.84 | 0.19 |
| F8 4,3 and F9 2,6 | 2.02 | 4.22 | 1.97 |
| F8 4,4 and F9 2,7 | 2.03 | 1.03 | 0.72 |
| F8 4,5 and F9 2,8 | 2.03 | 2.43 | 2.12 |
| F8 5,1 and F9 3,4 | 2.02 | 1.46 | 1.01 |
| F8 5,2 and F9 3,5 | 2.02 | 2.73 | 2.02 |
| F8 5,3 and F9 3,6 | 2.02 | 2.75 | 0.24 |
| F8 5,4 and F9 3,7 | 2.03 | 1.31 | 0.95 |
| F8 5,5 and F9 3,8 | 2.03 | 1.63 | 1.44 |
| F8 6,1 and F9 4,4 | 2.02 | 3.98 | 3.31 |
| F8 6,2 and F9 4,5 | 2.02 | 3.21 | 2.34 |
| F8 6,3 and F9 4,6 | 2.02 | 4.67 | 2.49 |
| F8 6,4 and F9 4,7 | 2.03 | 5.81 | 2.36 |
| F8 6,5 and F9 4,8 | 2.03 | 2.11 | 1.73 |
| F8 7,1 and F9 5,4 | 2.02 | 4.57 | 1.65 |
| F8 7,2 and F9 5,5 | 2.02 | 6.51 | 0.94 |
| F8 7,3 and F9 5,6 | 2.02 | 1.99 | 1.32 |
| F8 7,4 and F9 5,7 | 2.02 | 1.66 | 0.94 |
| F8 7,5 and F9 5,8 | 2.03 | 2.42 | 1.25 |
| F8 8,1 and F9 6,4 | 2.02 | 0.79 | 0.64 |
| F8 8,2 and F9 6,5 | 2.02 | 0.83 | 0.69 |
| F8 8,3 and F9 6,6 | 2.02 | 3.09 | 2.00 |
| F8 8,4 and F9 6,7 | 2.02 | 1.09 | 0.68 |
| F8 8,5 and F9 6,8 | 2.03 | 1.53 | 0.99 |
| Epoch | Time (Myr ago) | SFR (M) |
|---|---|---|
| 1 | 256t128 | 1.320.29 |
| 2 | 128t64 | 1.540.16 |
| 3 | 64t32 | 0.620.09 |
| 4 | 32t16 | 0.570.05 |
| 5 | 16t8 | 0.760.04 |
| 6 | 8t4 | 0.710.05 |
| 3-6 | 64t4 | 0.630.07 |