Declination dependence of the cosmic-ray flux at extreme energies
Abstract
We study the large-scale distribution of the arrival directions of the highest energy cosmic rays observed by various experiments. Despite clearly insufficient statistics, we find a deficit of cosmic rays at energies higher than eV from a large part of the sky around the celestial North Pole. We speculate on possible explanations of this feature.
pacs:
98.70.Sa1 Introduction
The physics of the highest-energy cosmic rays continues to attract significant interest of both particle physicists and astrophysicists. Experimental data allow to determine energies and arrival directions of the cosmic particles and may give some hints about their nature. At energies of order eV, spectra measured by different experiments are in a good agreement modulo overall normalization. Contrary, two major experiments disagree about the observed flux and shape of the spectrum at highest energies, eV: the data from the HiRes experiment exhibit the suppression of the flux, the so-called GZK feature [1, 2], while the AGASA experiment does not see the suppression. Arrival directions of the cosmic rays with energies eV are distributed isotropically over the sky (see, for instance, Ref. [3]) and clustered at small angles [3, 4, 5]. In this note, we focus on the highest energy region, eV, and demonstrate that the current data exhibit a trend to non-uniform distribution of the arrival directions. Namely, there is a deficit of events from a large region around the celestial North pole.
For the most energetic cosmic rays observed by AGASA, the absence of particles coming from the North has been pointed out in Refs. [3, 6, 7, 8]. However, the distribution of the arrival directions of these AGASA events is consistent with isotropy [9], given the non-uniform exposure. To test the conjecture of anisotropy (and also to improve statistics, still very poor), we include the results from other Northern hemisphere experiments in our analysis. We do observe a non-uniform distribution of events with probability of this anisotropy to occur as a result of a chance fluctuation about one percent; this would correspond to two standard deviations for the Gaussian distribution. If confirmed by better statistics, this observation might mean that at highest energies, a new component appears in the cosmic ray flux. Indeed, it is widely believed now that at , the dominant part of the cosmic rays are protons [10, 11] from active galactic nuclei (in particular, BL Lac type objects suggested recently as the source candidates [12, 13, 14]). Due to the GZK effect, this component cannot explain even the most conservative HiRes flux at (see Refs. [15, 16] for a quantitative analysis). We will see that indeed, the anisotropy becomes significant at energies .
In the rest of the paper, we discuss in detail the datasets used, analyze the declination distribution of the highest-energy events detected by Northern-hemisphere experiments, present the results of the Monte Carlo simulations to estimate the chance probability of the observed anisotropy and study at what energies the anisotropic component becomes significant. We discuss possible ways to explain the effect and demonstrate its irrelevance to the AGASA/HiRes discrepancy. We emphasize that the number of events is too small to make a definite conclusion about the anisotropy and briefly discuss prospects for larger statistics.
2 The cosmic-ray sample
Our basic data set (hereafter, Set I) consists of the cosmic rays with energies higher than observed by all experiments in the Northern hemisphere. The choice of the eV cut is determined by the availability of data from fluorescent detectors at only. However, it is roughly consistent with the expected energy at which the super-GZK component could start to dominate. Alternatively, we consider a set of cosmic rays with observed by Volcano Ranch, Yakutsk and AGASA (Set II; arrival directions of events with are unpublished for other Northern-hemisphere experiments). The latter set is useful in determination of the ”critical” energy at which the new, anisotropically distributed, component becomes important. As it will be demonstrated below, this analysis points to as the critical energy.
When comparing data from different experiments, one should be careful about energy normalization. It is widely believed that at , where the shapes of the spectra measured by different experiments agree quite well, the difference in overall normalization is due to systematic errors in the energy determination. One possibility is to introduce correcting factors for energy values in such a way that the total flux measured at by different experiments would coincide, within one standard deviation, with the flux measured by a given (no matter which one) reference detector (in our study, we normalize all fluxes to HiRes data because otherwise the HiRes dataset is not complete). The study of the dependence on the choice of the reference detector is completely equivalent to the study of the dependence on the ”critical” energy performed in section 4. Quantitatively, this rescaling depends crucially on the assumed spectral index. We checked, however, that the effect discussed in this paper is insensitive to this choice: different normalizations (for spectral indices between two and four) do not change the result – absence of events with high declinations – compared to the case of no rescaling. For completeness, we report here (see Table 2) both the results obtained without energy normalization and with renormalizaton assuming spectral index three. In the latter case, the corrected energy , where is the reported energy of an event and (see, for instance, Ref. [8]). Here, and are the cosmic ray fluxes measured by the reference detector and the detector under consideration, respectively. The fluxes at and normalization factors are listed in Table 1 together with the information required to calculate and compare exposures of the experiments and with references.
-
Experiment (1) (2) (3) (4) (5) Volcano Ranch [17] 0.95 32 0.2 [18] Haverah Park 2.2 [18] 0.90 54 0.9 [18] Yakutsk [19] 0.70 62 1.8 [19] Fly’s Eye [20] 0.89 40 2.6 [20] AGASA, eV 0.85 36 5.3 [21] AGASA, eV [21] 0.85 36 4.0 [3] HiRes I mono [22] 1.00 40 6.5 [22] HiRes II mono [22] 1.00 40 0.7 [23] HiRes stereo [24] 0.95 40 4.6 [24]
For the data sample, we took the most recent publicly available data and impose zenith angle cuts of 45∘ for ground array experiments and 60∘ for fluorescent experiments.
Three experiments (Haverah Park, Yakutsk and HiRes II in the monocular mode) have considerable exposure at the ultra-high energies but contributed no events to the Set I (though their exposure was taken into account).
Energies of the Haverah Park events published in the Catalog [25] were reconsidered twice, in Refs. [26] and [27]. According to the most recent publication [27], the energy of the highest event is eV. Revised event-by-event data were not published.
The Yakutsk event with the energy eV has zenith angle and thus it is not included in Set I (note that its declination [28] is , so its account would only support our conclusions).
Coordinates of the Volcano Ranch events, both of the only shower with eV and of showers with lower energies (Set II) were taken from Ref. [25].
For the Set I, we use the most recent AGASA data from the experiment’s web page [9]. From eleven events, eight are left after rescaling from to . The lower energy data for the Set II are available for a shorter period of operation, Ref. [3]. This is the reason for smaller exposure used for the lower-energy data, as indicated in Table 1.
For fluorescent detectors, the data are published for the highest energy events only. The single Fly’s Eye event contributing to Set I is described in detail in Ref. [29]. For the HiRes detector in the monocular mode, we take the working period reported in Ref. [22]. The arrival direction of the single event with eV registered during that period and passed all cuts is taken from Ref. [30]. For the HiRes stereo experiment, we use the data reported in Refs. [24, 31]111According to Ref. [30], about 80% of the stereo events are not included in the HiRes I monocular data set because of different trigger requirements and quality cuts, so we consider the exposure of the stereoscopic observations as one of an independent experiment..
3 Declination-dependent exposure
Different parts of the sky are seen by various experiments with different exposures. In this paper, we use two different approaches: firstly, we model the dependence of the exposure on declination theoretically; secondly, we use the actual distribution of the lower-energy events to compare with one of the highest-energy events.
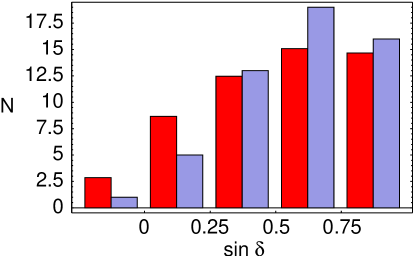
For a theoretical model of exposure of a ground array, we use the geometrical differential exposure. A small plaquette of area [sr] on the celestial sphere at the zenith angle is effectively seen by the area of a ground array, where is the maximal aperture. The total exposure for a plaquette can be found by integration over the working time of the detector. The explicit formulae which result from this integration for a continuously operating ground array are given in Ref. [32]. The exposure does not depend on the right ascension in this case. At energies these expressions are in rather good agreement with the observed data (see Fig. 1(b)). To obtain the normalization factor , important for any analysis which involves data of different experiments, one has to integrate over and to compare the resulting total exposure with the published value listed in Table 1.
For the fluorescent detectors, this simple geometrical estimate does not work. A monocular fluorescent detector accepts, at each particular moment, the cosmic rays uniformly in azimuth and in zenith angle up to about , with a relatively sharp drop at larger zenith angles [33]. In stereoscopic mode, acceptance depends also on the azimuthal angle. In all cases, fluorescent detectors work on clear moonless nights only. The information about typical weather and dark sky availability may be encoded in the dependence of acceptance on sidereal time [33]. For the HiRes experiment, we use the zenith angle dependence of acceptance from Refs. [33] (monocular detector with parameters of HiRes) and [24] (stereo HiRes detector), the azimuth angle dependence for the stereo mode from Ref. [24] and the sidereal time dependence from Ref. [33]. Though one could expect different zenith angle dependences of the exposure for different energies, the one we use agrees quite well with the actual distribution of the HiRes I high-energy events [34]. We are not aware about any published estimate of the coordinate-dependent exposure for the Fly’s Eye experiment in the monocular mode and (loosely) use the HiRes exposure for it. We present the results both with and without account of the Fly’s Eye event in Table 2.
4 Declination distribution of the cosmic rays
4.1 Illustration
We are ready to analyze the global distribution of the arrival directions. To illustrate the anisotropy, we divided the observed part of the sky into five bands in declination with equal areas, and integrated the exposure over these bands. These exposures were compared then to the number of observed events, band per band. The results for the Set I of cosmic rays are shown in Figure 1(a).
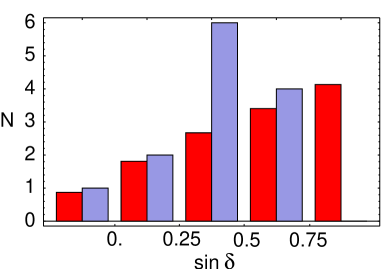
(a) (b)
The left (red) bar in each pair corresponds to the exposure per band, normalized to the total number of events in the sample. It represents the number of events expected from isotropy. The right (blue) bar corresponds to the actual number of observed events in the sample. The deficit of events in the Northern bin is clearly seen. To estimate this effect quantitatively, we perform Monte Carlo simulations of the arrival directions of cosmic rays.
4.2 Monte-Carlo simulations
Let us determine the exposure function
where the sum is taken over all relevant experiments, each one’s total exposure reflected in , and is the constant such that . The code generates a value of declination in such a way that the resulting cosmic rays cover the sky uniformly; then it either accepts (with the probability ) or rejects this event and proceeds to the next one until the total number of accepted events reaches the number of events in the real dataset 222For calculations without energy rescaling, one cannot sum the exposures of different experiments. Instead, we generate the actual number of observed events for each experiment in turn; in this way, we do not account the experiments which observed no events.. In this way, a sufficient number of mock sets is produced. The number of sets with no events in the Northern bin, divided by the total number of sets, determines the probability to observe the anisotropy by chance. The results are presented in Table 2.
To study the stability of our results, we calculated the probabilities to observe the actual number of events in the Northern bin, , for different values of (see Figure 2).
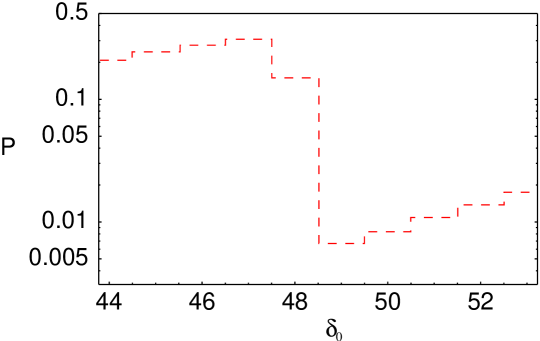
The position of the broad minimum determines the size of the Northern “zone of avoidance”.
To understand, at which energy the anisotropically distributed component becomes important, we use the Set II. In Figure 3,
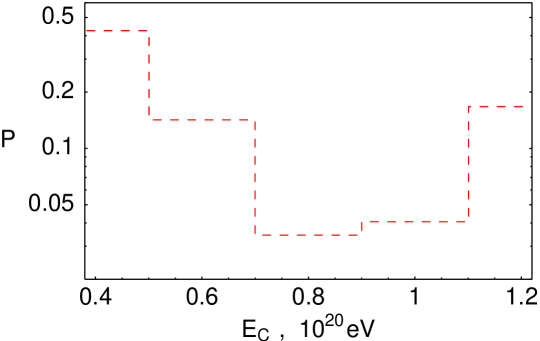
based on subsets of the Set II, we present the probability of the actual number of events to fall in the Northern bin as a result of a random fluctuation of the isotropic distribution for different cuts on the lower energy of the cosmic rays in the set. The result is consistent with our expectations: at lower energies, we confirm the well-known statement about isotropic distribution; at higher energies, eV, protons (from active galactic nuclei) are no longer dominant in the cosmic ray flux because of the GZK effect, and the new component is responsible for the observed events, distributed anisotropically.
Several comments are in order. First, the chance probabilities at eV presented in Figure 2 (Northern bin corresponds to ) and in Figure 3 are of the same order, but do not coincide exactly. The reason is that the sets of experimental data (Set I and Set II) used in the analysis are different.
Second, because of experimental uncertainties in the determination of the energies and arrival directions of the cosmic rays, it is not well-grounded to consider lowest values of probability P plotted in Figures 2 and 3 as exact numbers: some averaging over the uncertainty intervals in and should be performed to get more reliable numbers. The resulting probabilities will be higher, but still the isotropy is excluded at the level of about 2 for Gaussian distribution.
Third, the lowest probability in Figure 3 corresponds to the critical energy eV. With the available data it is impossible to conclude whether this is the exact energy scale where the anisotropic component of ultra–high-energy cosmic rays becomes dominant. Indeed, apart from experimental uncertainties in energy determination, a systematic error is caused by an arbitrary choice of the reference detector necessary for a joint analysis of the data from different experiments (for instance, normalization to one of the ground arrays instead of HiRes would shift the minimum in Fig. 3 to eV). Our choice of the eV cut in Set I and of HiRes as the reference detector was a priory determined by availability of data and hence was not adjusted to obtain better results (in fact, Fig. 3 suggests that the best results could be achieved with another choice). We thus do not introduce statistical penalty associated with this cut but consider our quantitative results only as an estimate.
-
Energy rescaling yes no eV versus theoretical exposure 1.2%(1.6%) 0.9%(1.4%) eV versus eV 1.3% 1.3%
5 Conclusions
Clearly, the number of events in our sample is insufficient to make a definite conclusion about anisotropy of the arrival directions. However, the current dataset gives a strong hint that the deficit of events with energies higher than eV and coming from the region is significant. If confirmed by future experiments, this fact might suggest that a new component emerges in the cosmic ray flux at extreme energies. The physics which could result in the observed distribution of declinations will be discussed elsewhere; we just mention here possible ways of explanation. One possibility is that the Northern region of the sky coincides with the direction to some large-scale cosmic structure which affects propagation of the cosmic rays at very high energies or causes inhomogeneous distribution of their sources (at eV this effect is not smeared out by the galactic magnetic field). Another option is that the primaries of the cosmic rays with eV interact with the geomagnetic field and produce showers in different ways at high and low latitudes. This may lead to a relative systematic error in the determination of energy between the particles arriving from different directions. One example of this effect was discussed in Ref. [35]: if the primary particle is a photon, then an electromagnetic cascade develops in the geomagnetic field before the particle reaches the top of the atmosphere. The observed superposition of several atmospheric showers mimics a single shower of the same energy as the primary particle but developed higher, so that its energy may be underestimated by a ground array. The current bounds on the chemical composition of UHECRs [36, 37] do not constrain strongly the fraction of photonic primaries at eV; to conclude that the primaries are protons on the base of the shower profiles and muon counting, one needs much better statistics than available. However, the data give some indications to the hadronic nature of primary particles. Primary protons do not produce pre-atmospheric cascades. Still, the development of proton-induced showers is affected by the geomagnetic field: for instance, the separation of muons and anti-muons is important for modelling [38, 39] and energy estimation [40] of inclined showers. The effects of the geomagnetic field would affect also the distribution of the arrival directions in azimuth, which will be considered elsewhere.
Future experiments with larger statistics will be able to support or disfavour the conjecture of anisotropy discussed here. The effects of the geomagnetic field could be studied with the Southern site of the Pierre Auger observatory. Clearly, to confirm or reject the option of a “favourite direction” occasionally coinciding with the North, large detectors in the Northern hemisphere (such as the second Auger site, the Telescope Array or the EAS-1000 experiment) or full-sky cosmic observatories (EUSO, OWL, TUS) would be required.
We stress that the use of currently unpublished data from Haverah Park, Fly’s Eye and HiRes at eV, as well as of the AGASA events with zenith angles larger than , would immediately enlarge the statistics without awaiting for the future experiments.
Finally, we comment on a recent proposal [8] that the discrepancy between the AGASA and HiRes fluxes at highest energies might be explained by different fields of view. Indeed, the HiRes’ differential exposure peaks in the Northern region while one of AGASA has a maximum at , the AGASA detector’s latitude. The “zone of avoidance” in the North affects the results of the flux measurements which usually assume the isotropic distribution of arrival directions. We estimate this effect by a rough assumption that the cosmic rays with eV are distributed uniformly at but are absent at . With this assumption, a flux measured by HiRes would be about smaller than one averaged over all sky, while a flux measured by AGASA decreases by about . Clearly, this effect cannot eliminate the conflict between the two experiments.
References
- [1] Greisen K, End to the cosmic ray spectrum?, 1966 Phys. Rev. Lett. 16 748
- [2] Zatsepin G T and Kuzmin V A, Upper limit of the spectrum of cosmic rays, 1966 JETP Lett. 4 78 [1966 Pisma Zh. Eksp. Teor. Fiz. 4 114]
- [3] Hayashida N et al., Updated AGASA event list above eV, 2000 [astro-ph/0008102]
- [4] Uchihori Y et. al., Cluster analysis of extremely high energy cosmic rays in the Northern sky, 2000 Astropart. Phys. 13 151 [astro-ph/9908193]
- [5] Tinyakov P G and Tkachev I I, Correlation function of ultra-high energy cosmic rays favors point sources, 2001 JETP Lett. 74 1 [2001 Pisma Zh. Eksp. Teor. Fiz. 74 3] [astro-ph/0102101]
- [6] Takeda M et. al., Recent results from the AGASA experiment, 1998 Proc. 19th Texas Symposium (Paris) 08/16
- [7] Bednarek W, Cascades in the Earth’s magnetosphere initiated by photons with parameters of the highest energy AGASA events, 2002 New Astron. 7 471 [astro-ph/0109015]
- [8] Stanev T, On the luminosity of the ultra-high-energy cosmic ray sources, 2003 [astro-ph/0303123]
- [9] http://www-akeno.icrr.u-tokyo.ac.jp/AGASA/ results.html#100EeV
- [10] Tinyakov P and Tkachev I, Sources of sub-GZK cosmic rays, 2002 [hep-ph/0212223]
- [11] Berezinsky V, Gazizov A and Grigorieva S, Signatures of protons in UHECR, 2003 [astro-ph/0302483]
- [12] Tinyakov P G and Tkachev I I, BL Lacertae are possible sources of the observed ultra-high energy cosmic rays, 2001 JETP Lett. 74 445 [2001 Pisma Zh. Eksp. Teor. Fiz. 74 499]
- [13] Uryson A V, Results of identification of UHECR sources, 2001 Proc. 27th ICRC (Hamburg) 551
- [14] Gorbunov D S et al., Evidence for a connection between gamma-ray and highest-energy cosmic ray emissions by BL Lacs, 2002 Astrophys. J. 577 L93 [astro-ph/0204360]
- [15] Kachelriess M, Semikoz D V and Tortola M A, New hadrons as ultra-high energy cosmic rays, 2003 Phys. Rev. D 68 043005 [hep-ph/0302161]
- [16] Kalashev O E, Ultra-high energy cosmic rays: propagation and possible sources, 2003 Ph.D. thesis (INR, Moscow)
- [17] Chi X et. al., Cosmic rays of the highest energies. 2: The mass composition and primary spectrum, 1992 J. Phys. G 18 553
- [18] Nagano M and Watson A A, Observations and implications of the ultrahigh-energy cosmic rays, 2000 Rev. Mod. Phys. 72 689
- [19] Ivanov A A, Knurenko S P and Shafer Yu G, 2003, Energy spectrum of primary cosmic rays in the energy region of – eV by Yakutsk array data, presentation at the 29th ICRC, Tsukuba
- [20] Bird D J et al. [HIRES Collaboration], The Cosmic Ray Energy Spectrum Observed By The Fly’s Eye, 1994 Astrophys. J. 424 491
- [21] Takeda M [AGASA Collaboration], 2003, Energy determination in the Akeno Giant Air Shower Array experiment, presentation at the 29th ICRC, Tsukuba
- [22] Abu-Zayyad T et al. [High Resolution Fly’s Eye Collaboration], Measurement of the flux of ultrahigh energy cosmic rays from monocular observations by the High Resolution Fly’s Eye experiment, 2002 [astro-ph/0208243, v.2]
- [23] Abu-Zayyad T et al. [High Resolution Fly’s Eye Collaboration], Measurement of the spectrum of UHE cosmic rays by the FADC detector of the HiRes experiment, 2002 [astro-ph/0208301]
- [24] Springer R W, 2003, Stereo spectrum of UHECR showers at the HiRes detector, presentation at the 29th ICRC, Tsukuba
- [25] Catalogue of highest energy cosmic rays, Vols. 1,2,3; World Data Center C2 for Cosmic Rays, Itabashi, Tokyo.
- [26] Lawrence M A, Reid R J and Watson A A, The cosmic ray energy spectrum above eV as measured by the Haverah Park array, 1991 J. Phys. G 17 (1991) 733
- [27] Ave M et al., The energy spectrum of cosmic rays above eV as measured with the Haverah Park array, 2003 Astropart. Phys. 19 47 [astro-ph/0112253]
- [28] http://eas.ysn.ru/yakutsk.html
- [29] Bird D J et al., Detection of a cosmic ray with measured energy well beyond the expected spectral cutoff due to cosmic microwave radiation, 1995 Astrophys. J. 441 144
- [30] Bellido J A, Anisotropy studies of the HIRES EHECR, 2002 Ph.D. thesis (Univ. of Adelaide)
- [31] Cao Z, http://taws300.icrr.u-tokyo.ac.jp/workshop2003/viewgraph/ZCao.pdf
- [32] Sommers P, Cosmic-ray anisotropy analysis with a full-sky observatory, 2001 Astropart. Phys. 14 271 [astro-ph/0004016]
- [33] Stokes B T, Jui C C H and Matthews J N, Using fractal dimensionality in the search for source models of ultra-high energy cosmic rays, 2003 [astro-ph/0307491].
- [34] Springer W, http://www.pi.infn.it/lathuile/2003/talks/Springer.pdf
- [35] Stanev T and Vankov H P, The nature of the highest energy cosmic rays, 1997 Phys. Rev. D 55 1365 [arXiv:astro-ph/9607011].
- [36] Ave M et al., Constraints on the ultra high energy photon flux using inclined showers from the Haverah Park array, 2002 Phys. Rev. D 65 063007 [astro-ph/0110613]
- [37] Shinozaki K et al., Upper limit on gamma-ray flux above eV estimated by the Akeno Giant Air Shower Array experiment, 2002 Astrophys. J. 571 L117
- [38] Antonov E E et al., Separation of positive and negative muons in a giant shower by the geomagnetic field, 1998 JETP Lett. 68 185 [1998 Pisma Zh. Eksp. Teor. Fiz. 68 177]
- [39] Ave M, Vazquez R A and Zas E, Modelling horizontal air showers induced by cosmic rays, 2000 Astropart. Phys. 14 91 [arXiv:astro-ph/0011490]
- [40] Antonov E E et al., Separation of muons in the giant air showers by the geomagnetic field, 2002 Comput. Phys. Commun. 147 501