Chandra Discovery of an X-ray jet and Extended X-ray Structure in z=0.63 quasar, B2 0738+313
Abstract
We have made a ksec Chandra observation of the redshift z=0.63 GPS quasar B2 0738+313. We detected X-ray emission from the core and have discovered a 200 kpc (projected on the sky) X-ray jet. The X-ray jet is narrow and curves, following the extended radio structure to the south of the quasar, and ending with a hot spot at the southernmost part of the radio lobe. The jet has a knot at arcsec away from the core. The knot emission is consistent with the X-rays being created by the inverse Compton scattering of the cosmic microwave background (CMB) photons and requires jet bulk Lorentz factors of a few (). We discuss the emission mechanisms that may be responsible for the jet emission. We present new VLA data of the core and jet, and discuss the relation between the extended radio and X-ray emission. Extended emission observed in several GPS sources has been interpreted as a signature of the source past activity, while the GPS source is young and newly expanded. We argue that B2 0738+313 may be an example of a new class of radio sources similar to the FRII radio galaxies in their high jet bulk velocities, but with the powerful GPS-like nucleus.
B2 0738+313 also has two damped Lyman- systems along the line of sight, at = 0.0912 and 0.2212. We discuss the possible connection between the X-ray absorption (7.2 cm-2) detected in the ACIS spectrum and these two intervening absorbers. We also investigate an extended structure within the central 10 arcsec of the core in the relation to structure seen in the optical.
1 Introduction
GigaHertz-Peaked Spectrum (GPS) and Compact Steep Spectrum (CSS) sources compose a significant fraction of the bright radio source population (10-20, O’Dea et al. 1998). However, because this classification is based entirely on the spectral shape in the radio band, the GPS/CSS sample is heterogeneous and contains both galaxies and quasars with a range of luminosities and morphology. Until recently, most GPS/CSS sources were thought to be very compact with the radio emission contained within kpc of the core. About of GPS/CSS sources exhibit faint extended radio emission on scales larger than the size of the host galaxy (Baum et al 1990, Stanghellini et al 1990, O’Dea 1998, Fanti et al 2001) with only a few sources showing any radio structures on Mpc scales (Schoenmakers et al 1999, Siemiginowska et al 2002, Marecki et al 2002). This extended radio emission is amorphous or jet-like, but is usually hard to classify because of being weak. A detection of a faint radio structure in the vicinity of a strong GPS/CSS core requires difficult, high dynamic range observations and careful data analysis. Even then the extended emission may be difficult to detect.
The unprecedented sub-arcsecond resolution (Van Speybroeck et al, 1997) of the Chandra X-ray Observatory (Weisskopf et al 2002) gives us, for the first time, the opportunity to study details of the X-ray structures in the vicinity of AGN and quasars. Discoveries of many X-ray jets associated with radio sources show that X-ray jets have large bulk Lorentz factors () at hundred kpc distances from the nucleus. Recent Chandra observations (Schwartz et al 2000, Tavecchio et al. 2000; Celotti et al. 2001; Siemiginowska et al. 2002; Brunetti et al. 2002, Sambruna et al. 2002) have shown that if even mildly relativistic plasma is present in a jet with high bulk velocity then it can result in a strong X-ray emission. The cosmic microwave background (CMB) photons Compton scatter off relatively low energy relativistic electrons () within a jet creating X-rays. Both high and the increased energy density of the CMB radiation (as ) contribute to the final X-ray intensity (see Celotti et al 2001, Harris & Krawczynski 2002, Schwartz 2002). Thus X-rays provide a good indicator of the large scale environment of GPS quasars revealing jets or diffuse cluster emission at high redshift (Siemiginowska et al 2003) allowing a differention between truly compact and “extended” sources within the GPS/CSS sample. The reliable separation of jet dominated GPS/CSS sources from others in this heterogeneous class may clarify the nature of non jet dominated GPS/CSS sources. At the end of Section 7.1 we discuss the similarities between B2 0738+313 and other core dominated quasars and the implications of our observation on the classification of this source.
B2 0738+313 (OI 363) is a redshift z=0.63 radio-loud quasar with a peak in its radio spectrum at 5 GHz. B2 0738+313 is a low polarization quasar. The radio structure (Stanghellini et al. 1997, 2001, Kellermann et al. 1998) shows a jet on the milliarcsecond scale. The jet is elongated towards the south for about 5 milliarcsec ( parsecs at z=0.63). It then bends by about 45 degrees in the south-west direction, where it is visible for other 5 milliarcseconds. A bright knot is located at the jet’s bend. Murphy et al. (1993) and Stanghellini et.al. (1998) presented a VLA radio map which shows a faint radio structure on the arcmin scale, extending north-south in both directions from the core.
B2 0738+313 has also two intervening damped Lyman- absorption systems (DLA) along the line of sight at redshifts 0.0912 and 0.2212 (Rao & Turnshek 1998). These large column density systems can produce significant low energy X-ray absorption (Bechtold et al 2001, Turnshek et al 2003). There is no Lyman- absorption at the quasar redshift.
We observed B2 0738+313 with Chandra in order to study both extended X-ray emission indicated by the ROSAT HRI imaging, and to search for absorption possibly related to the DLA systems. Here we present the results of both ROSAT and Chandra observations. In Chandra we detect a curved X-ray jet which extends away from the quasar. We also detect symmetric, extended X-ray emission within 10 of the quasar in the Chandra data.
We have obtained new VLA radio data, and combined previously published data to study B2 0738+313 at different frequencies and antenna configurations. We discuss the correlation between radio and X-ray structures. We model the radio to X-ray jet emission, and discuss the implications for possible emission processes. Synchrotron emission can explain the hot spot located at the furthest distance from the quasar core. The emission from the knot at from the nucleus requires an additional component and we argue that the interactions between the relativistic particles and the CMB photons are responsible for the observed X-ray flux.
We discuss briefly the X-ray spectrum of the quasar core, its luminosity and absorption column. We consider a possibility that the observed absorption is related to one or both of the two DLA systems. We also compare the X-ray structure within from the core to optical images and discuss their possible relation to the DLA galaxies.
We assume H0=75 km sec-1Mpc-1, q (1 arcsec kpc). Adopting the best fit cosmological parameters implied by the recent WMAP results (Spergel et al. 2003) H0=71 km sec-1Mpc-1, =0.7, and =0.3 changes the luminosity distance by about 10.
2 X-ray Data
Table 1 lists the dates of the X-ray observations. The purpose of the ROSAT HRI (Röntgen Satellite High-Resolution Imager111http://heasarc.gsfc.nasa.gov/docs/rosat/rosdocs.html) imaging of B2 0738+313 in 1994 was to search for the extended X-ray emission surrounding the source. The only published results from this observation is the conference contribution of Antonelli and Fiore (1997). There is a hint of the extended emission in the resolution image which prompted us to ask for the higher resolution Chandra observations. Here we present both the analysis and results of the ROSAT HRI observations and the new Chandra results.
2.1 ROSAT HRI observations
The ROSAT HRI observation was taken on April 5-12, 1994 with total exposure time of 47,508 sec. HRI source counts were accumulated in channels 2-12, to reduce the background and possible UV contamination and were extracted from a circle with 20 arcsec radius. Background was extracted in two ways: from annuli of inner and outer radii: 0.4’-0.8’ and 1.7’-2.1’ and from boxes of various sizes, from 20′′ to 3′ on side, around the quasar. Point sources with signal to noise ratio were excluded from the background regions. Different background regions gave essentially the same results. We obtain 860 source counts (within 20 arcsec radius circle) corresponding to the count rate of 0.018 counts sec-1 with the background level of 1.04 counts sec-1 arcsec-2 (e.g. 62 counts within 20 arcsec radius circle).
The ROSAT HRI observations were obtained over the span of a few days. There are groups of contiguous data (several OBIs, Observation Intervals) separated by gaps of 0.5-1 days. To search for systematic aspect-related errors we examined the HRI images from separate groups of contiguous OBIs. Each image contains between 80 and 200 counts. The faintness of the quasar count rate prevents a finer splitting of the data (as in Morse et al. 1995) since the error on the centroid position is of the order of a few arcsec ( arcsec) for images with about 80 counts. We found no evidence for a systematic shift of the image centroids between each data set and therefore no artificial broadening in the final image. The final location of the centroid is offset from the optical position by 1.9 arcsec which is within a typical accuracy ( arcsec) of the source location obtained with ROSAT HRI.
To check for residual spurious broadening of the HRI PSF we analyzed the observation of the bright quasar 3C273. 3C273 is a point-like source except for the jet emission and therefore can be used to evaluate the parameterization of the HRI PSF. In figure 1a we show the radial profile of B2 0738+313 compared with that of 3C273 (after removing the jet region) and with the HRI PSF, as parameterized by David et al (1993). The profile of 3C273 differs slightly from the HRI PSF beyond about 5 arcsec radius. This broadening is likely to be due to residual systematic uncertainties in the aspect solution as a function of time, as the satellite wobbled back and forth by several arcmin. The excess of counts in 3C273 with respect to the PSF is 20 between 5 and 10 arcsec and 45 between 10 and 20 arcsec. For B2 0738+313 the excess of counts with respect to the PSF is between 5 and 10 arcsec and between 10 and 20 arcsec. We therefore conclude that significant extended emission is present in B20738+313 on scales from 5 to about 20 arcsec, where the source starts to become fainter than the background. This is shown more clearly in the residual plot of Figure 1b, where we plot integrated counts at a given radius away from the center for both B2 0738+313 and 3C273 and show the difference between both profiles. We estimated the count rate in the extended emission to be within 4.8-5.8 counts ksec-1, which is about 30 of the total quasar count rate. The observed 0.1-2 keV flux in the extended component is of order 1.610-13ergs cm2 sec-1, which corresponds to the rest frame luminosity of 1.5ergs sec-1.
The Chandra observation described in the next section allowed further investigation of the extended emission seen in the HRI data.
2.2 Chandra ACIS-S Observations
We observed B2 0738+313 for 27,600 seconds with the spectroscopic array of the Chandra Advanced CCD Imaging Spectrometer (ACIS-S, Wiesskopf et al 2002) on 2000 October 10 (ObsID 377) without any transmission grating in place. The source was located on the back illuminated chip (S3) and offset by from the default aim point position to avoid the node boundary (Chandra Proposers’ Observatory Guide, POG, 2000). Chandra ACIS-S3 data were reprocessed with the pipeline version 6.0.1 on June 13, 2001. We have used the reprocessed data and calibration files available in CALDB v.2.9. We note that the aspect uncertainty on the absolute position is less than and the uncertainty of the aspect solution is less than (Aldcroft et al 2000). The PSF FWHM at the quasar core is about . The X-ray position of the quasar (J2000: 07:41:10.7 +31:12:00.2) agrees with the optical position (Johnston et al 1995) to better than 1, as expected given the quality of the Chandra aspect solution (Aldcroft et al 2000). We used CIAO (version 2.2 222http://asc.harvard.edu/ciao/) software to analyze the data.
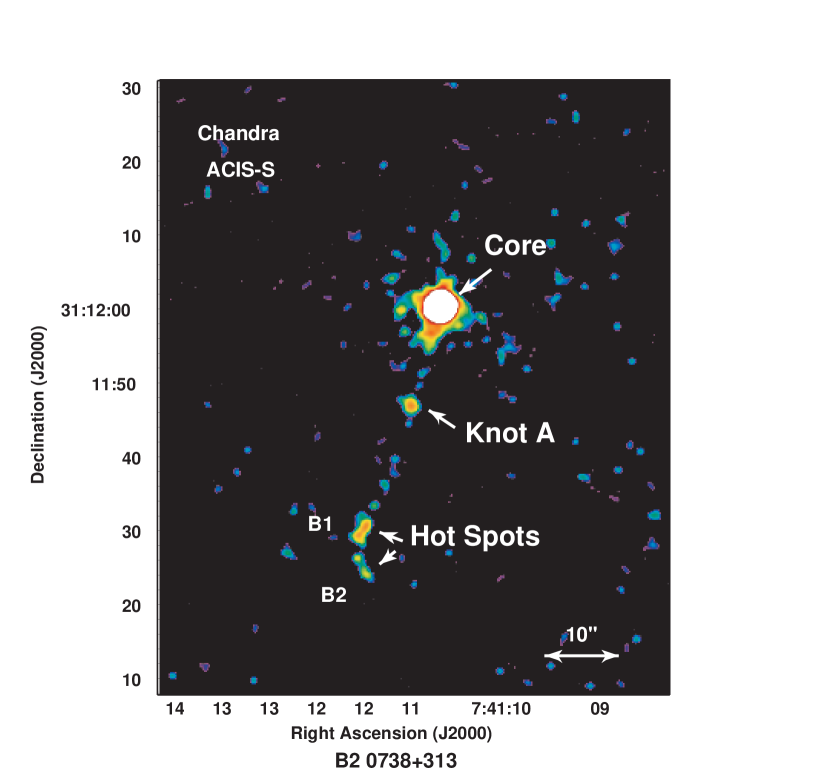
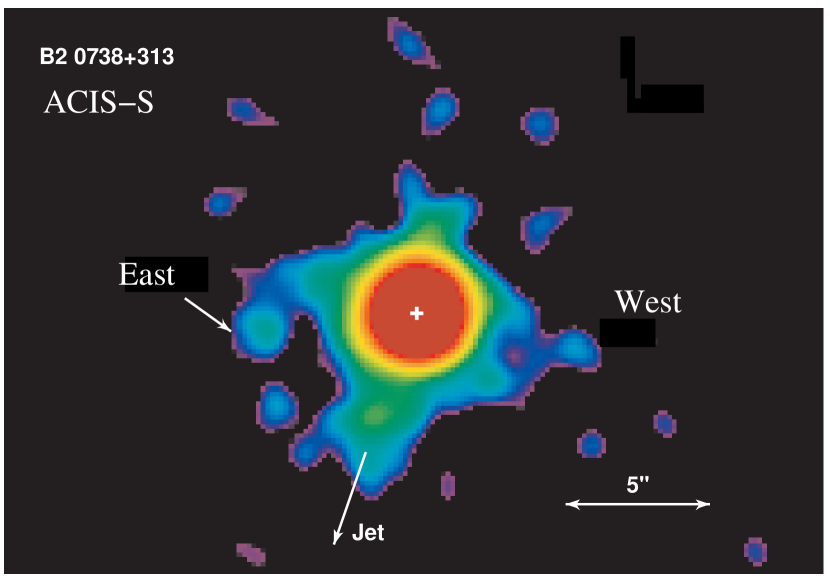
The extended emission detected with the ROSAT HRI observations is resolved into smaller structures in the Chandra ACIS-S data. Here we can clearly identify the bright quasar, a few features within 3-10 arcsec from the quasar and the curved jet extending up to into the South-East.
A smoothed image of B2 0738+313 in 0.3-6.5 keV is shown in Figure 2. The original event file was binned (into 1/3 of ACIS-S pixel size = 0.164), divided by the exposure map to obtain a surface brightness image and then smoothed with the Gaussian kernel (FWHM=0.75). The intensity in the image (Figure 2) has been scaled logarithmically to emphasize the faint jet emission. The small Chandra Point Spread Function (PSF), especially the low power in the scattering wings (), allows for a high dynamic range image, which is essential to the detection and resolution of the extended structure. A total of 3,691 counts was detected in the quasar core (for a 2.7 arcsec radius of the circular extraction region) and 124 counts in the jet (assuming a polygon region along the jet). Thus, the total jet emission is times fainter than the core and the individual components in the jet are times fainter than the core.
3 VLA Data and Radio Morphology
B2 0738+313 has been observed at the VLA 333The National Radio Astronomy Observatory is a facility of the National Science Foundation operated under cooperative agreement by Associated Universities, Inc. with various configurations and frequencies (see Table 1). The B configuration data at 1.36 and 1.66 GHz were taken during 2 observing sessions on August 22, 1998 and September 21, 1998. We did not use September 21, 1998 data in the analysis, because they were of poor quality due to strong interferences across the observing band. The C configuration data were taken on July 26, 1997 at 4.5, 4.9, 8.0 and 8.4 GHz. Two or three 5 minutes snapshots have been obtained at different hour angles for each data set to improve the UV coverage. To improve the resolution at low frequency we also made use of a short 10 minutes observation on August 10, 1999, at 1.36 GHz in A configuration. Calibration, self-calibration and imaging has been done in AIPS following the standard procedures. To improve the resolution and to better disentangle the more compact emitting regions from the diffuse emission, while preserving the good sensitivity the images at 1.36 GHz and 1.66 GHz were made with a tempered uniform weighting (ROBUST 0 in task IMAGR in AIPS), while at other frequencies (not shown) they were made with a natural weighting to maximize the sensitivity.
High dynamic range data are necessary to measure the low brightness structure in the presence of a very strong component. After several iterations of self calibration and clean/restore procedure, we have achieved an r.m.s. noise close to the thermal noise (mJy) in most of the field-of-view. This corresponds to a peak to r.m.s. noise ratio of 20000, but the removal of the side lobes is less accurate close to the strong core emission (Jy at 1.3/1.6 GHz, Jy at 4.7/8.2 GHZ), resulting in confusion between the true emission and some residual side lobes. This may be particularly true at 1.66 GHz which is known to be a frequency plagued by interference at the VLA. In addition it is hard to separate the contributions of the compact components from the diffuse lobe emission.
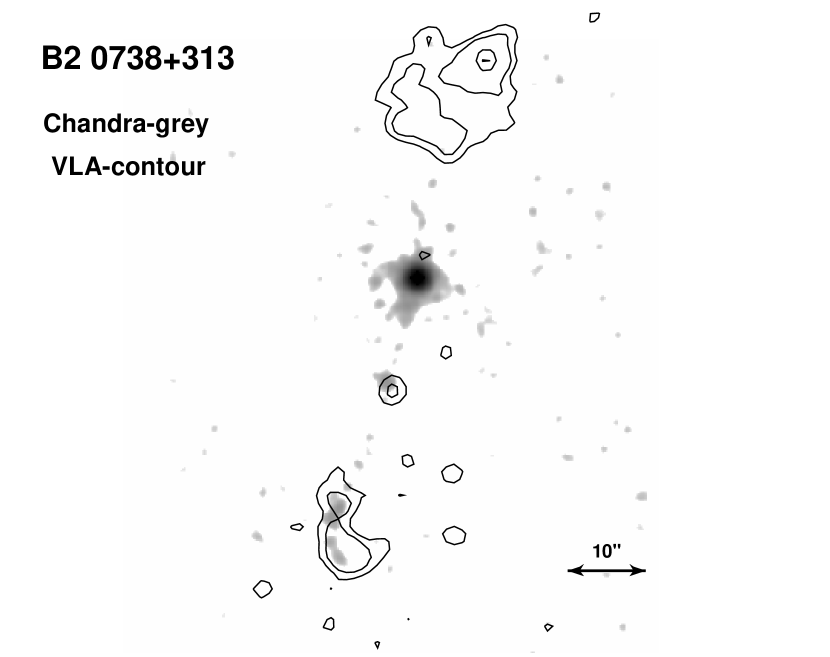
We have made images at different resolutions cutting or tapering the longest baselines in order to enhance different details, which resulted in roughly circular fitted beams of the size indicated below. In Fig.3(left) we show the 1.36 GHz image of B2 0738+313 from the August 1998 data, with a resolution of arcseconds where the FRII type large scale morphology is well evident. After subtraction of the variable core radio emission we combined the B configuration data at 1.36 GHz of August 1998, with the A configuration data at 1.36 GHz taken on August 1999 to get closer to the Chandra angular resolution. Then we obtained an image of arcseconds resolution, shown superimposed onto the X-ray image in Fig.4.
The image at 4.7 GHz, where the dominant component has a flat spectrum, has been obtained from the combined UV data sets at 4.5 and 4.9 GHz, while the data at 8.2 GHz have been obtained averaging the 8.0 and 8.4 GHz data. The combined images were used to obtain the flux density measurements of the core and extended structure.
The VLA radio images show a strong, dominant core (Table 3, partially subtracted in Fig.3 to expose emission close to the core) and a low brightness double-lobed structure extending approximately 1 arcmin in the north-south direction. Two relatively compact components are easily seen at the edges of the two radio lobes and can be interpreted as the two hot spots. The diffuse emission around the two hot-spots is due to the lobe emission and a possible contribution from the jet. Previous VLA A configuration observations (Stanghellini et al. 1998) did not reveal the extended lobes because they were shorter snapshots and because the longer baselines of the A configuration are less sensitive to extended emission.
The dominant radio core component is resolved in VLBI images into the core-jet structure shown in Fig.3(right) (Stanghellini et al 1997, 2001) suggesting that the core emission is a result of the inner jet emission relativistically boosted towards us.
4 Jet Morphology and Spectra
In Figure 4, we show a superposition of the X-ray and radio images (1.36 GHz). The resolution of the radio data is worse than the resolution of Chandra at this frequency. The X-ray jet follows the radio structure and curves when it reaches the end of the southern radio lobe. The enhancement between the core and the southern components can be identified as knot A and is seen in both radio and X-ray images.
There is no X-ray counterpart to the northern radio lobe at the level of 7.4 photons cm-2 sec-1 arcsec-2 (3 limit).
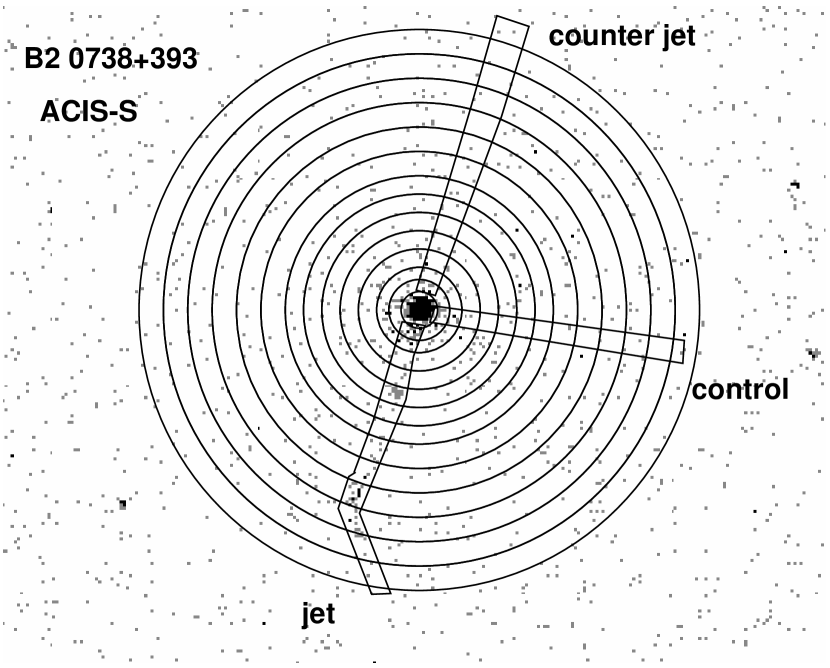
To investigate the jet structure and X-ray spectra we extracted the X-ray jet and counter-jet profiles from the event file including only the photons with energies between 0.3 and 6.5 keV. The Chandra background increases significantly above 6.5 keV and below 0.3 keV 444http://cxc.harvard.edu/cal/Acis/Cal_prods/bkgrnd/current/background. html. We defined the polygonal regions shown in Figure 5 for extracting the profiles. The profiles are shown in Figure 6. There is no counter-jet present in our X-ray data.
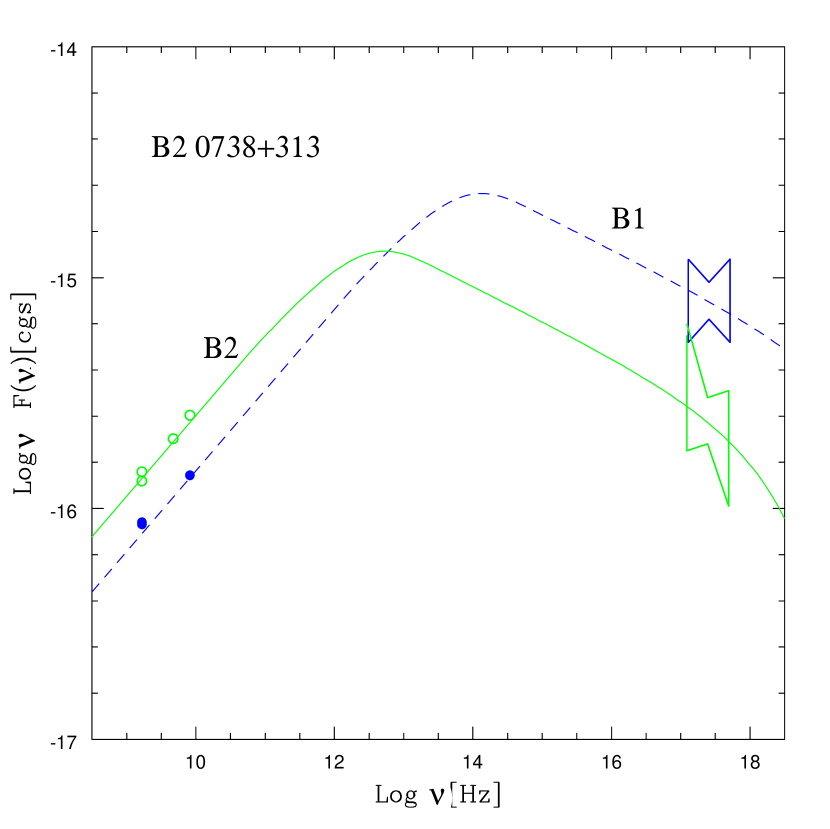
The jet profile is not smooth and uniform, but shows definite features 13 and 32 away from the core. The features are labeled A,B1,B2 moving away from the core (see Figure 2). The first feature A can be related to the knot visible in radio emission, while the outer B1 and B2 features can be associated with the Southern Lobe and may mark the position of hot spots. We extracted the counts from these three features (A,B1,B2) and fit a simple power law model to estimate the spectral index and the luminosity associated with each feature. The results are presented in Table 2. B1 component is the strongest. It seems that both B1 and B2 components are softer ( and respectively) than knot A () located closer to the core. The luminosity of each feature is listed in Table 2 and they range between erg sec-1. Figure7 show the spectral energy distribution for each feature.
We fit all the radio components with Gaussian models using JMFIT in AIPS (see Table 3). We attempted to match the components close to the X-ray emission. The knot A radio emission is not well constrained with the current data (uncertainties of order 10), but a slight shift between X-ray and radio knot emission can be noticed. With the current data we cannot really quantify the amount of shift.
The estimated radio flux densities are reliable for both northern and southern hot spots, while the flux densities for the subcomponents of the southern hot spot and the knot A are more ambiguous. These features are definitely detected in our radio observations, but their flux density cannot be determined accurately with the current data.
5 X-ray Spectrum of B2 0738+313
We have extracted the ACIS-S spectrum of the quasar core assuming the circular region with 2.7 arcsec radius for a source and an annulus between 5 and 55 (excluding the source and the jet) for the background. The total of 3691 counts in the spectrum were then fit in Sherpa (Freeman et al 2001). The spectrum is not significantly affected by pileup (). We included only the counts with energies between 0.3-6.5 keV. The background is significantly higher outside this energy range.
We assume the absorbed power law model to fit the data:
photons cm-2 sec-1 keV-1.
In this formula is the normalization at 1 keV and is the photon index of the power law. We have assumed two components for the absorption. The first component is related to the effective Galactic absorption characterized by the equivalent neutral hydrogen column N= 4.18 atoms cm-2 (COLDEN 555http://cxc.harvard.edu/toolkit/colden.jsp, which has column densities accurate to 5 Elvis, Wilkes & Lockman 1989). This absorption was constant during fitting. The second component is due to the intervening absorber located at redshift , with N as the equivalent hydrogen column. and are the corresponding absorption cross sections (Morrison & McCammon 1983, Wilms, Allen and McCray 2000). We used Powell optimization with Primini statistics (Kearns et al. 1995) to determine the best fit parameter values.
The best fit parameters are listed in Table 4 and the spectrum and residuals are presented in Figure 8. The structure in the residuals is due to the uncertainties in the Chandra calibration, in particular any spectral features at keV are related to the calibration uncertainties across the Si and Ir edges (CXC Calibration666http://cxc.harvard.edu/ciao/caveats/). The residuals below 1 keV are mostly caused by the uncertainties in the calibration of the time-dependent effects related to the ACIS contamination layer. This contamination layer affects modeling of the absorption in our source. To account for the contaminant we have applied the most recent correction file (apply_acisabs v.1.1-2777http://cxc.harvard.edu/ciao/threads/sherpa_acisabs/) and created an updated effective area file (ARF), which we used in modeling the data.
We find that the best fit equivalent hydrogen column for B2 0738+393 is 7.19cm-2, assuming solar abundances and that the absorber is at z=0, compared to the Galactic column of 4.18 cm-2 (COLDEN). Figure 9 represents confidence contours on column density vs. power law photon index plane for the best fit model parameters. The line representing the equivalent Galactic hydrogen column is outside 99.7 confidence contour drawn around the best fit equivalent hydrogen column of 7.19cm-2. Thus there is a small excess in the absorption towards the quasar, however our signal-to-noise and current knowledge of the instrument below 1keV make the evidence for the excess absorption uncertain. Note that pileup may affect the total detected column. Photon index and the absorption column are correlated. The pileup results in hardening of the spectrum and therefore in lower fitted absorption column, thus the true column density may be higher by a factor of 2. However, archival XMM-Newton data agree with the measured by Chandra column density (Siemiginowska & Bechtold 2003).
6 X-ray emission within 10 region around the quasar
ROSAT HRI data indicated that the extended emission is present at distances smaller than 10 away from B2 0738+393. We studied carefully this central 10 region in the Chandra ACIS-S image to identify the nature of the extended emission. Extended emission could be associated with the environment of the GPS quasar or with the intervening DLA systems.
First we ran wavdetect (detection tool in CIAO based on wavelets) on the central part of the image (50). The quasar and the jet features were detected. The Chandra PSF is very narrow (FWHM 0.75 at the location of our source) but the contribution from the PSF wings from the strong core could affect the extended structure at distances greater than from the quasar. Therefore, we have used three methods to understand the amount of the quasar contribution to the emission within the 10 circle.
(1) We excluded the core component (within a 1.5 circle) and fill the excluded regions with Poisson noise. We then smoothed the diffuse image assuming a Gaussian kernel. (2) We fit the image data with the PSF created from the PSF library using mkpsf and subtracted the PSF contribution related to the quasar core emission. We analyzed the residuals and also created a smoothed image of the residuals (assuming Gaussian kernel with FWHM=0.75). (3) We fit the surface brightness with 2D Gaussian and Lorentzian models as an approximation of a quasar PSF and analyzed the residuals for any significant structure.
The result in each case was the structure presented in Figure 10 with three distinct 1.3-3.6 features within arcsec to the south, west and east of the quasar. We extracted counts from each feature assuming regions specified in the Table 2. The X-ray emission is the strongest (3.6) at 3.8 south of the quasar core in the direction of the jet (shown with an arrow in Fig. 10). This emission can indicate the location of the innermost components of the jet.
The two features seen in our Figure 10 – one to the west and the structure to the east – may correspond to the structures observed in the optical by Turnshek et al.(2001; see their Fig.1). We extracted spectra from the west and east features. The number of counts and the corresponding flux for each feature are listed in the Table 2. The table lists also the regions used to extract the spectra (dmextract tool in CIAO). We calculate the X-ray flux assuming galactic NH of 4.18 cm-2 and a power law index =1.25. We obtained 5.34 ergs cm-2sec-1 for the east feature and 3.9 ergs cm-2sec-1 for the west components.
The location of the west and east X-ray features correspond to the location of the optical “arm” and a “jet-like” structures, identified by Turnshek et al (2001) with the DLA system at z=0.0912. The agreement in position is less than 1 arcsec. Assuming that both X-ray components are related to the DLA system at z=0.0912 their X-ray (0.1-2keV) luminosity 8.5 ergs sec-1 and 6.5 ergs sec-1 respectively (Hkm sec-1Mpc-1, ).
These two features may also be associated with the emission at the quasar redshift and not related to the DLA system. They may indicate a presence of a cluster or a group at the quasar redshift. The east and the west X-ray emission would be then associated with individual galaxies and indicate their X-ray luminosities of order 5.1 ergs sec-1 and 3.7 ergs sec-1 respectively.
ROSAT HRI data indicated an extended emission within 5-20 arcsec from the quasar of a total (0.5-2 keV) flux of order 1.3-1.6 ergs cm-2 sec-1. The Chandra flux including all the resolved structures (jet and three features) accounts only for about 50 of the ROSAT HRI flux. This discrepancy could be related to the difference in the PSF wings, which could affect the ROSAT HRI measurements.
7 Discussion
7.1 Jet models
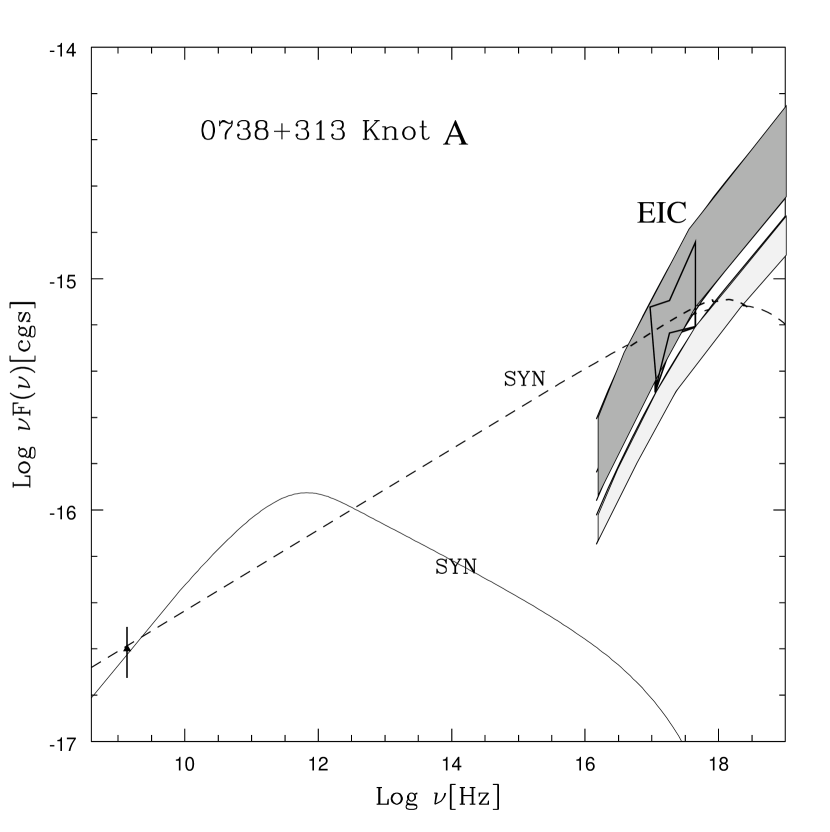
Several emission processes are potentially responsible for the jet X-ray emission: synchrotron, synchrotron self-compton (SSC), external inverse compton (EIC) models, and thermal emission (for review see Harris & Krawczynski 2002). Thermal emission from jet knots or hot spots is quite unlikely since the observed X-ray luminosities require unphysical conditions. We fit the radio-X-ray data of the knot and two components of the southern hot spot considering only non-thermal processes.
The X-ray emission from the two components of the hot spot in the southern lobe (B1 and B2) is consistent with the synchrotron model (Figure 7). From the measured size of the radio emitting regions and the flux density we can estimate the equipartition magnetic field in the hot spot to be of order of 20 G. The radio flux symmetry between the South and North hot spots indicate an absence of strong Doppler boosting of the radio photons. We can also put a rough limit on the Doppler boosting in the hot spots using the difference in the length of the two lobes. Assuming that the hot spot is moving at velocity , the difference in the length (factor of about 1.3) is compatible with an angle with the line of sight of 15-25 and .
The radio data do not provide good constraints for the synchrotron radio emission of knot A. Figure 7 shows the radio and data points and X-ray spectrum together with allowed models for knot A. The spectral break at high frequencies in synchrotron models provides a measure of the maximum energy of the oldest plasma in the post shock region. In general, powerful jets have spectral breaks within Hz (Hardcastle et al 2002a, Sambruna et al 2002). Here this break is at Hz and implies electron energies of at least (where is the Lorentz factor) with very short lifetimes ( years) for the magnetic field expected in the jet. However, the quality of the present radio and X-ray data for knot A do not rule out the synchrotron emission completely and one can find a solution with a spectral break below Hz.
The second model for the knot A X-ray emission is Inverse Compton scattering of cosmic-microwave background (CMB) photons off the relativistic electrons in the jet (Figure 7). The radio to X-ray luminosity ratio as well as the difference in the spectral slopes between radio and X-ray bands requires the jet to move with the high relativistic bulk velocities (, where is the jet Lorentz factor) towards the observer ( degrees, where is an angle between the observer and the direction of the jet motion). In Figure 7 we show X-ray spectra for a range of model parameters, ,, - magnetic field and the assumed slope of the energy distribution of relativistic electrons, . With only one radio data point for knot A the models are unconstrained, although assuming the inclination angle can be up to 10-15 . This is still in contradiction with the morphology of the extended radio lobe structure.
The small angle indicates that either (1) the radio lobes are Mpc in size and the jet is aligned with the lobes and very long; or (2) that the inclination angle of the knot is different from that of the lobes and the projected extension is of the order of 500 kpc. Because the radio lobe morphology and radio intensity suggest a large inclination angle, while the jet requires the small inclination angle, the second possibility may indicate either a sharp bend in the jet or the presence of precession of the jet direction within the last 10 years.
Megaparsec scale radio emission in GPS sources has also been interpreted as a remnant of much earlier source activity (Baum et al 1990, Owsianik, Conway & Polatidis 1998, Marr et al 2001; Stanghellini et al 1990, Schoenmakers et al 1999, Marecki et al 2002). In this model the GPS “core” indicates current source activity rejuvenated by an inflow of new matter from a recent merger (e.g. Mihos & Hernquist 1996) or accretion disk instability (Siemiginowska, Czerny & Kostyunin 1996, Mineshige & Shields 1990). Repetitive activity of the source may also come from feedback mechanisms (Ciotti & Ostriker 2001) in which the accreting source heats the ambient gas to the point at which the accretion stops, since the Compton temperature of the emitted radiation exceeds the virial temperature of the galactic gas. Accretion restarts after the gas has cooled. The outburst phase is short in comparison to the cooling phase.
The above interpretation of the extended radio emission is probably more appropriate for the sources with their sub-kpc core observed edge-on. In such a source one can separate two jet components and the core on the milliarcsec scale VLBI observations. For example, Compact Symmetric Objects (CSO) which have the peaked radio spectra, but show two jet components on both sides of the strong core have been monitored for several years now. The dynamical timescales in these sources can be measured and suggests young ages (years). The extended, Mpc emission observed in two cases (0108+388 , Baum et al 1990 and PKS 1245+676, Marecki et al. 2002) is at least 106years old. Owsianik et al (1998) argued based on the radio morphology that the outer structure in 0108+388 has been left unsupplied for at least 2 years, while the core activity is only 300-400 years old.
B2 0738+313 is not a CSO type source and we do not have any estimate of the characteristic timescale for the activity of the core. In fact the milliarcsec core-jet morphology may indicate that B2 0738+313 could be similar to other core dominated quasars, but with a peaked radio spectrum. The peak in the radio spectrum could be therefore due to the dominant contribution from the miliarcsec jet component at this frequency. This quasar could be an example of the FRII type quasar with a high bulk jet velocity () which has been observed in the other FRII sources (see for example Hardcastle et al (2002)), but with a more complex radio nuclear spectrum than usually associated with the FRII class.
7.2 Absorption towards B2 0738+313
We found X-ray absorption in the core of B2 0738+313. The X-ray absorption may be arising in the material associated with B2 0738+313 itself, and/or one or both of two intervening damped Lyman- (DLA) absorbers known, at redshifts and (Rao & Turnshek 1998). The intervening absorbers have neutral hydrogen columns derived from the DLA profiles of 1.5 cm-2 and 8 cm-2 respectively (Rao & Turnshek 1998). There is no Ly absorption at the quasar redshift, so it is possible that the X-ray absorption is associated with one of the damped systems. Unfortunately ACIS-S spectral resolution does not allow us to obtain the redshift of the X-ray absorption or to separate these two systems to obtain their individual contribution to the total absorbing column. We can only obtain the total column of the two absorbers or fit individual columns assuming that the absorption comes from either system (see Table 4). It is interesting to note that the total equivalent column of hydrogen observed with ACIS is smaller than the neutral column in either DLA. This suggests that the metallicity of the absorbers may be sub-solar. We defer a more detailed analysis of the X-ray absorption until details of the calibration for energies below 1 keV are well understood.
7.3 Extended Emission
We can use the X-ray to H-band luminosity ratios collected for a large sample of galaxies by Shapley, Fabbiano and Eskridge (2001, SFE01) to identify the type of galaxy possibly associated with the two X-ray features. Turnshek at al (2001) gives the K band magnitudes for both components (their Table 2). which we use to calculate the H-band luminosity for the sources located at z=0.0912: L=6.5erg sec-1 and L=4.6erg sec-1. For such low H-band luminosity these two features are very X-ray bright. Based on SFE01 (their Fig.6) these features cannot be associated with the early or intermediate type of galaxies. They might be related to late type galaxies which are disk/arm dominated or irregular, although our X-ray luminosities are still higher than the luminosities in SFE01 sample. Deeper observations in the future in both optical and X-ray domains are needed in order to better understand the nature of these two features.
It is also possible that the west and east X-ray features are related to the cluster or a group at the quasar redshift. If this is the case their would have H-band to X-ray luminosity ratios typical to the early type galaxies in SFE01 diagrams.
We do not detect an X-ray emission from the dwarf galaxy identified by Turnshek et al (2001) with DLA system at redshift zabs=0.2212. In fact the X-ray emission is weakening towards the location of the optical peak emission of the galaxy which is 5.7 away from the quasar peak.
8 Summary
In summary we report new X-ray and radio observations of GPS quasar B2 0738+313. We find that B2 0738+313
-
•
is a powerful X-ray and radio source with total X-ray luminosity ergs sec-1;
-
•
has extended radio emission on 1 arcmin scale with FRII type morphology;
-
•
has a 35 long, one-sided X-ray jet with high bulk velocity,reaching the southern radio lobe.
-
•
has diffuse, extended X-ray emission within the central 10;
-
•
has excess X-ray absorption on the line of sight which may be intrinsic to the AGN, or related to one or two known intervening DLA systems.
This is the second GPS source imaged with Chandra. Like PKS 1127-145 (Siemiginowska et al 2002) it shows complex structures related to the radio emission on arcsec scale and absorption in the core spectrum. The studies of GPS sources appears to be a fertile field for understanding the evolution of AGN.
References
- (1) Aldcroft, T.L., Karovska, M., Cresitello-Dittmar, M. L., Cameron, R.A., Markevitch, M.L., 2000, in Proc. SPIE Vol. 4012, p. 650-657, X-Ray Optics, Instruments, and Missions III, Joachim E. Truemper; Bernd Aschenbach, Eds.
- (2)
- (3) Antonelli L.A. & Fiore F., 1997, Proceedings of the II National Meeting on AGNs ”From Micro to Mega Parsec” Comastri A., T. Venturi, M. Bellazzini eds., Memorie della Societa Astronomica Italiana, (Journal of the Italian Astron. Society) vol.68, 299
- (4)
- (5) Baum, S. A.; O’Dea, C. P.; de Bruyn, A. G.; Murphy, D. W., 1990, A&A, 232, 19
- (6)
- (7) Bechtold, J., Siemiginowska, A., Aldcroft, T. L., Elvis, M., & Do brzycki, A. 2001, ApJ, 562, 133
- (8)
- (9) Brunetti, G., Bondi, M., Comastri, A., & Setti, G. 2002, A&A, 3 81, 795
- (10)
- (11) Celotti,A., Ghisellini, G. & Chiaberge, M. 2001, MNRAS,321,1
- (12)
- (13) Chartas, G., Worrall, D. M., Birkinshaw, M.; Cresitello-Dittmar, M.; Cui, W.; Ghosh, K. K.; Harris, D. E.; Hooper, E. J.; Jauncey, D. L.; Kim, D.-W.; Lovell, J.; Mathur, S.; Schwartz, D. A.; Tingay, S. J.; Virani, S. N.; Wilkes, B. J., 2000, Ap.J., 542, 655
- (14)
- (15) Ciotti, L. & Ostriker, J.P., 2001, ApJ, 551, 131
- (16)
- (17) David, L.P, Harnden, F.R., Kearns, K.E. & Zombeck, M.V., 1992, “The ROSAT High Resolution Imager” (Technical Report US ROSAT Science Data Center, SAO)
- (18)
- (19) Elvis, M., Fiore,F., Wilkes, B., McDowell, J., Bechtold, J., 1994, Ap.J. 422, 60
- (20)
- (21) Elvis, M., Wilkes, B. J., & Lockman, F. J. 1989, AJ, 97, 777
- (22)
- (23) Fanti, C., Pozzi, F., Dallacasa, D., Fanti, R., Gregorini, L., Stanghellini, C., & Vigotti, M. 2001, A&A, 369, 380
- (24)
- (25) Freeman, P., Doe, S., Siemiginowska A., 2001, “Sherpa: a mission-independent data analysis application”, in Proc. SPIE Vol. 4477, p. 76-87, Astronomical Data Analysis, Jean-Luc Starck; Fionn D. Murtagh; Eds.
- (26)
- (27) Harris, D. E. & Krawczynski, H. 2002, ApJ, 565, 244
- (28)
- (29) Harris, D. 2001, “Current Problems for X-ray Emission from Radio Jets”, in ’Particles and Fields in Radio Galaxies’, R. A. Laing and K. M. Blundell, editors. ASP Conference Series, in press.
- (30)
- (31) Harris, D. E.; Carilli, C. L.; Perley, R. A., 1994, Nature, 367,71 3
- (32)
- (33) Hardcastle, M. J., Worrall, D. M., Birkinshaw, M., Laing, R. A., & Bridle, A. H. 2002a, MNRAS, 334, 182
- (34)
- (35) Hardcastle, M. J., Birkinshaw, M., Cameron, R. A., Harris, D. E., Looney, L. W., & Worrall, D. M. 2002, ApJ, 581, 948
- (36)
- (37) Hardcastle, M. J., Birkinshaw, M., & Worrall, D. M. 2001, MNRAS, 326, 1499
- (38)
- (39) Hartman, R.C., et al 1999, ApJS, 123, 79
- (40)
- (41) Holtzman, J. A. et al. 1995, PASP, 107, 156
- (42)
- (43) Impey, C.D., & Tapia, S. 1990, ApJ.354,124
- (44)
- (45) Johnston, K.J. et al 1995, AJ, 110,880
- (46)
- (47) Kallerman,K.I. & Owen, F.N., 1988, in “Galactic and Extragalactic Radio Astronomy” , Eds. Verschuur, G.L and Kallerman, K.I., Springer-Verlag, p.563
- (48)
- (49) Kearns, K., Primini, F., & Alexander, D. 1995, Astronomical Data Analysis Software and Systems IV, ASP Conference Series, Vol. 77, 1995, R.A. Shaw, H.E. Payne, and J.J.E. Hayes, eds., p. 331., 4, 331
- (50)
- (51) Lane, W., Briggs, F.H. & Smette A., 2000, ApJ, 532,146
- (52)
- (53) Marecki, A., Barthel,P.D., Polatidis, A., Owsianik, I., 2002, A contribution to The Third Workshop on Compact Steep Spectrum and GHz-Peaked Spectrum Radio Sources, Kerastari, Greece May 28-31, 2002. PASA in press (astro-ph/0209212)
- (54)
- (55) Marr. J.M, Taylor, G.B. & Crawford III, F., 2001, Ap.J. 550.160
- (56)
- (57) Marshall, H. L.; Harris, D. E.; Grimes, J. P.; Drake, J. J.; Fruscione, A.; Juda, M.; Kraft, R. P.; Mathur, S.; Murray, S. S.; Ogle, P. M.; Pease, D. O.; Schwartz, D. A.; Siemiginowska, A. L.; Vrtilek, S. D.; Wargelin, B. J, 2001a,ApJ., 549, L167
- (58)
- (59) Marshall, H. L., Miller, B. P., Davis, D. S., Perlman, E. S., Wise , M., Canizares, C. R., & Harris, D. E. 2002, ApJ, 564, 683
- (60)
- (61) Morse, J. A., Wilson, A. S., Elvis, M., & Weaver, K. A. 1995, ApJ, 439, 121
- (62)
- (63) Morrison, R. & McCammon, D. 1983, ApJ, 270, 119
- (64)
- (65) Murphy, D. W., Browne, I. W. A., & Perley, R. A. 1993, MNRAS, 2 64, 298
- (66)
- (67) Murphy, E.M., Lockman, F.J., Laor, A. & Elvis,M., 1996, ApJS. 105,369
- (68)
- (69) Mihos, J.C. & Hernquist, L., 1996, ApJ, 464,641
- (70)
- (71) Mineshige & Shields, G., 1990, Ap.J, 351,47
- (72)
- (73) O’Dea, C.P. 1998, PASP, 110, 493
- (74)
- (75) O’Dea, C.P., Baum, S.A., & Stanghellini,C., 1991, ApJ, 380,66
- (76)
- (77) Owsianik, I., & Conway, J.E. 1998, A&A, 337, 69
- (78)
- (79) Owsianik, I., Conway, J.E., & Polatidis, A.G.,1998, A&A, 336, 37
- (80)
- (81) Owsianik, I., Conway, J.E., & Polatidis, A.G., 1999, NewAR, 43, 669
- (82)
- (83) Phillips, R.B., & Mutel, R.L. 1982, A&A, 106, 21
- (84)
- (85) Rao, S. & Turnshek, D.A, 1998, ApJ, 500, L115
- (86)
- (87) Readhead, A.C., 1994, Ap.J., 426, 51
- (88)
- (89) Reynolds, C. & Begelman, M.,1997, Ap.J., 487, L135
- (90)
- (91) Rybicki, G.B. & Lightman, A.P., “Radiative Processes in Astrophysics”, Wiley and Sons. Inc, 1979
- (92)
- (93) Sambruna, R. M., Maraschi, L., Tavecchio, F., Urry, C. M., Cheung, C. C., Chartas, G., Scarpa, R., & Gambill, J. K. 2002, ApJ, 571, 206
- (94)
- (95) Schwartz, D.A, Marshall, H. L.; Lovell, J. E. J.; Piner, B. G.; Tingay, S. J.; Birkinshaw, M.; Chartas, G.; Elvis, M.; Feigelson, E. D.; Ghosh, K. K.; Harris, D. E.; Hirabayashi, H.; Hooper, E. J.; Jauncey, D. L.; Lanzetta, K. M.; Mathur, S.; Preston, R. A.; Tucker, W. H.; Virani, S.; Wilkes, B.; Worrall, D. M.,2000 ApJ, 540, 69
- (96)
- (97) Schwartz, D.A. 2002, ApJ, 569, L23.
- (98)
- (99) Schoenmakers, A.P., de Bruyn A.G., Rottgering, H.J.A. & H.van der Laan, 1999, A&A 341, 44
- (100)
- (101) Shapley, A., Fabbiano, G., & Eskridge, P. B. 2001, ApJS, 137, 1 39
- (102)
- (103) Siemiginowska, A. & Bechtold, J., 2003, at “The First Constellation-X Spectroscopy Workshop”, meeting held in New York on May 4-7, 2003.
- (104)
- (105) Siemiginowska, A., Czerny, B., & Kostyunin, V. 1996, ApJ, 458, 491
- (106)
- (107) Siemiginowska, A., Aldcroft, L.T., Bechtold, J., Brunetti, G., Elvis, M. & Stanghellini, C. 2003, to appear in PASA, as a part of the proceedings of the 3rd GPS/CSS Workshop held in May 2002 in Kerastari, Greece, in press
- (108)
- (109) Siemiginowska, A., Bechtold, J., Aldcroft, T. L., Elvis, M., Harris, D. E., & Dobrzycki, A. 2002, ApJ, 570, 543
- (110)
- (111) Snellen, I. A. G., Schilizzi, R. T., Miley, G. K., de Bruyn, A. G., Bremer, M. N., R ttgering, H. J. A. 2000, MNRAS, 319, 445
- (112)
- (113) Stanghellini, C., Dallacasa, D., O’Dea, C. P., Baum, S. A., Fanti, R., Fanti, C., 2001, A&A 377, 377
- (114)
- (115) Stanghellini, C., O’Dea, C. P., Dallacasa, D., Baum, S. A., Fanti, R., & Fanti, C. 1998, A&AS, 131, 303
- (116)
- (117) Stanghellini, C., O’Dea, C. P., Baum, S. A., Dallacasa, D., Fanti, R., & Fanti, C. 1997, A&A, 325, 943
- (118)
- (119) Stanghellini, C., Dallacasa, D., O’Dea, C. P., Baum, S. A., Fanti, R., & Fanti, C. 1996, in Proc. Second Workshop on Gigahertz Peaked-Spectrum and Compact Steep-Spectrum Radio Sources, ed. I. A. G. Snellen, R. T. Schilizzi, H. J. A. R ttgering, & M. N. Bremer (Leiden: Leiden Obs.), 4
- (120)
- (121) Stanghellini, C., Baum, S.A., O’Dea, C.P., Morris, G.B. 1990, A&A , 233,379
- (122)
- (123) Tavecchio, F., Maraschi, L., Sambruna, R.M., Urry, M.C., 2000, ApJ, 544, L23
- (124)
- (125) Tingay,S.J., Murphy D.W. & Edwards,P.G., 1998, Ap.J.,500, 673
- (126)
- (127) Turnshek, D.A, Rao, S., Nestor, D., Lane, W., Monier, E., 2001, ApJ 553, 288
- (128)
- (129) Turnshek, D.A, Rao, S., Ptak, A., Griffiths, R.E, Eric M. Monier E.M., 2003, Ap.J in press (astro-ph/0302550)
- (130)
- (131) Van Speybroeck, L.P, Jeriu, D.,Edgar, R.J., Gaetz, T.J., Zhao, P., Reid, P.B., 1997, in Proc. SPIE Vol. 3113, Grazing Incidence and Multilayer X-Ray Optical Systems, Richard B. Hoover; Arthur B. Walker; Eds. p. 89-104
- (132)
- (133) Weisskopf, M. C., Brinkman, B., Canizares, C., Garmire, G., Murray, S., & Van Speybroeck, L. P. 2002, PASP, 114, 1
- (134)
- (135) Wilms, Allen and McCray 2000, ApJ 542, 914
- (136)
- (137) Wilson, A., 2003, in the proceedings of the Bologna conference “The Physics of Relativistic Jets in the Chandra and XMM Era”, New Astronomy Review in press (astro-ph/0301125)
- (138)
| Instrument | Date | E(keV)/(GHz) | Exposure (s) |
|---|---|---|---|
| ROSAT HRI | (05-12)-Apr-1994 | 0.1-4 | 47508 |
| Chandra ACIS-S | 10-Oct-2000 | 0.1-10 | 27600 |
| VLA (C) | 26-July-1997 | 4.5,4.9,8.0,8.4 | |
| VLA (B) | 22-Aug-1998 | 1.36,1.66 | |
| VLA (B) | 21-Sep-1998 | 1.36,1.66 | |
| VLA (A) | 10-Aug-1999 | 1.36 |
| Component | Region | Counts | Net | F(0.1-2) | L(0.1-2) | F(2-10) | L(2-10) | |
|---|---|---|---|---|---|---|---|---|
| Core | circle(4126.1,4023.8,5.5) | 3691 | 3674.5±61.2 | 1.55 | 346.1 | 44.52 | 868.1 | 44.92 |
| South | ellipse(4123.97,4015.78,3.23,3.23,0) | 21 | 17.9 | 1.27±0.38 | 1.42 | 42.13 | 5.79 | 42.75 |
| East | circle(4115.23,4022.96,3.40) | 12 | 6.9±3.6 | 1.25±0.82 | 0.53 | 41.71 | 1.88 | 42.26 |
| West | ellipse(4138.24,4022.08,6.57,2.78,0.127) | 15 | 5.0±3.9 | 1.2±1.1 | 0.39 | 41.57 | 1.35 | 42.11 |
| A | 3.6 x 7.8 (4118,3996)c | 30 | 21.85±4.8 | 1.54 ±0.37 | 1.58 | 42.18 | 4.31 | 42.61 |
| B1 | 3.6 x 7.8 (4105,3963)c | 36 | 27.95±5.6 | 2.0 1±0.33 | 2.39 | 42.36 | 3.21 | 42.49 |
| B2 | 5.8 x 3.5 (4106,3951)c | 19 | 12.95±3.8 | 2.4±0.5 | 1.05 | 42.00 | 0.81 | 42.89 |
Galactic hydrogen column of N atoms cm-2 was assumed in all models; a flux within given energy band (0.1-2 keV or 2-10 keV) in 10-15 ergs cm-2sec-1; b rest frame log luminosity within given energy range in ergs sec-1 assuming =0.5, H0=75 km sec-1Mpc-1; c The location of the center of the region box in Chandra physical coordinates.
| Component | 1.4GHza | 1.7GHza | 4.7GHzb | 8.2GHzb | 1.4GHzc | ||||
|---|---|---|---|---|---|---|---|---|---|
| Peak | Tot | Peak | Tot | Peak | Tot | Peak | Tot | Tot | |
| Core | 2040 | 2478 | 4052 | 3942 | |||||
| North HS | 13.2 | 21.5 | 9.5 | 15.9 | 4.4 | 8.9 | 2.8 | 4.9 | 15.2 |
| A | 1.5 | 2.3 | 0.7 | 1.5 | 1.1 | 4.17 | 0.6 | 1.3 | 2. |
| B1 | 3.9 | 11.27 | 2.7 | 5.3 | 2.0 | 8.6 | 0.8 | 1.7 | |
| B2 | 7.7 | 12.9 | 5.5 | 8.8 | 2.7 | 4.3 | 1.5 | 3.1 | 7.9 |
a August 1998; b July 1997; c combined August 1998 and August 1999;
Flux density measurements given in mJy. The measurements for July 1997 and August 1998 JMFIT assuming a box region of a few (5 or 6) pixels centered on the component. The noise in the data mJy. Total flux density may vary by 1 or 2 mJy depending on the location of the boxes. North HS is a radio hot spot to the North. The combined 1998 and 1999 data have much smaller measurement errors around 1 mJy at the hot spots and 0.2 mJy for the knot A.
| Model | a | NH()b | Normc | d | |
|---|---|---|---|---|---|
| A | 0 | 7.19 | 1.56 | 1.71 | 422.7(416) |
| B | 0.09 | 3.28 | 1.55 | 1.69 | 422.9(416) |
| C | 0.22 | 3.85 | 1.55 | 1.68 | 422.6(416) |
| D | 0.63 | 6.61 | 1.54 | 1.68 | 421.73(416) |
a redshift of the absorber. Model A assumes that the entire absorption is related to the Galaxy, while models B,C and D assume that the Galactic column is constant at 4.181020 atoms cm-2 and the additional absorption comes from the intervening absorber at a given, fixed redshift. b equivalent hydrogen column of the absorber in 1020 atoms cm-2 c Normalization in 10-4photons cm-2 sec-1 keV-1 at 1 keV. d calculated with Sherpa using Chi Primini statistics. Number degrees of freedom is given in the brackets.