Giant Arc Statistics In Concordance With A Concordance LCDM Universe
Abstract
The frequency of giant arcs— highly distorted and strongly gravitationally lensed background galaxies— is a powerful test for cosmological models. Previous comparisons of arc statistics for the currently favored concordance cosmological model (a flat lambda-dominated universe) with observations have shown an apparently large discrepancy. We present here new ray-shooting results, based on a high resolution ( particles in a Mpc box) large-scale structure simulation normalized to the WMAP observations. We follow light rays through a pseudo-3D matter distribution approximated by up to 38 lens planes, and evaluate the occurrence of arcs for various source redshifts. We find that the frequency of strongly lensed background sources is a steep function of source redshift: the optical depth for giant arcs increases by a factor of five when the background sources are moved from redshift to . This is a consequence of a moderate decrease of the critical surface mass density for lensing, combined with the very steep cluster mass function at the high mass end. Our results are consistent with those of Bartelmann et al. (1998) if we— as they did— restrict all sources to be exactly at . But if we allow for a more realistic distribution of source redshifts extending to or beyond , the apparent discrepancy vanishes: the frequency of arcs is increased by about a factor of ten as compared to previous estimates, and results in roughly one arc per 20 square degrees over the sky. This prediction for an LCDM model is then in good agreement with the observed frequency of arcs. Hence we consider the “missing arc” problem for a concordance LCDM cosmology to be solved.
1 Introduction
The occurrence of giant luminous arcs as a result of strong gravitational lensing by galaxy clusters is a potentially strong test for cosmological models. With the recent WMAP results (Spergel et al. 2003), parameters of viable models are now fixed at very high redshift, in addition to the well-known constraints at redshift zero. Strong lensing is one of the very few tools which allows us to probe the intermediate redshift regime, redshifts , in order to confirm the cosmic background radiation (CBR) results and to break the strong degeneracies permitted by even the best CBR results (cf. Bridle et al. 2003).
In recent years, this strong lensing test— formulated as the frequency of giant arcs— has been one of the few astrophysical results which seemed to disfavor a flat lambda-dominated universe (LCDM). Bartelmann et al. (1998) (hereafter B98) had shown that an LCDM model appears to underpredict the observed occurrence of arcs by a factor of 5 to 10. By simulating the cluster population as singular isothermal spheres distributed according to Press-Schechter theory, Cooray (1999a, 1999b) had found no discrepancy between predicted and observed number of arcs for a flat lambda-dominated universe. Several attempts have been undertaken to determine the reason for the apparent disagreement between the observed number of arcs and the predictions according to B98: Meneghetti et al. (2000) investigated whether including individual galaxies in the dark matter simulations of galaxy clusters could change this, but found only a small effect. Similarly, Flores, Maller & Primack (2000) found that the galaxy contribution can enhance the cross section by up to 15%— not enough to explain the discrepancy. Meneghetti, Moscardini & Bartelmann (2003) looked into the question of whether the contribution of the cD galaxy to the cluster lensing can increase the cross section for arcs significantly and concluded that this can only moderately enhance the probability for the production of arcs and cannot explain the discrepancy between predicted and observed arcs. Zaritsky & Gonzalez (2003) re-investigated the observational side of the arc statistics by studying the frequency of strong lensing in a subsample of the Las Campanas Distant Cluster Survey (LCDCS). Their results (though based on a small number of cases) confirm earlier observational results, and also agree with previous arc studies based on X-ray selected clusters (Gioia & Luppino 1994). Similarly, Gladders et al. (2003) find that the Red-Sequence Cluster Survey (RCS) has too many arcs compared to the expectation from B98.
We present here a new analysis of the predicted frequency of arcs produced by strong lensing of galaxy clusters in a concordance LCDM model consistent with CMB and low redshift observations. We follow light rays through a pseudo three-dimensional matter distribution, drawn from a state-of-the-art high resolution large-scale structure simulation. Our analysis shows that the expected number of giant arcs in an LCDM universe is significantly higher than previously thought, and is in fact in good agreement with the observations. In the next section we briefly describe our simulations. In Section 3 we present the results in terms of arc statistics. In the discussion (Section 4) we compare our simulations and results with those of B98 and explain the differing conclusions.
2 Simulations
In order to simulate the three-dimensional lensing effect of a universe filled with dark matter, we first performed a large-scale structure simulation with a Tree-Particle-Mesh (TPM) code (Bode & Ostriker 2003). TPM uses the Particle-Mesh method for long-range forces and a tree code for sub-grid resolution; individual isolated, overdense regions are each treated as a separate tree, thus ensuring efficient use of parallel computers. We used the following parameters for our cosmological model: matter content , cosmological constant , Hubble constant km/sec/Mpc, linear amplitude of mass fluctuations =0.95, and primordial power spectral index =1. These parameters are consistent with the 1 WMAP derived cosmological parameters (Spergel et al. 2003, Table 2). The simulations were performed in a box with a comoving side length of Mpc. We used particles, so the individual particle mass is M⊙. The cubic spline softening length was set to kpc, producing a ratio of box size to softening length of . The output was stored at 19 redshift values out to , such that the centers of the saved boxes matched comoving distances of Mpc, where .
To produce lens planes, first the box was divided into separate square cylinders running the length of the box. This was done for three orthogonal projections, leading to 243 subvolumes. Two lens planes were produced for each subvolume by bisecting along the line-of-sight and projecting the mass in each Mpc–long volume onto a plane. At the highest redshift, each plane has a side length of Mpc and contains pixels, making the pixel size kpc comoving. At lower redshifts, we kept the number of pixels constant but decreased the size of the planes, such that the opening angle of about 20 arcmin (set by the sidelength of the highest redshift source plane) remains constant. Thus in the lowest redshift box the lensing planes are Mpc on a side and the pixel size is kpc. Because at lower redshifts the plane does not cover all of the corresponding subvolume, there is a random offset perpendicular to the line of sight within each subvolume.
Light rays are then propagated backwards through these lens planes, beginning with a regular grid at the lowest redshift lens plane (i.e. the image plane) and working to higher redshift (cf. Wambsganss et al. 1995, 1998). For each realization of our ray shooting simulations, one of the 243 pairs of lens planes was taken randomly from each redshift; thus the chance of repeating structures is very small. Altogether we performed 100 different realizations. For each of these, the lensing properties are evaluated at seven different source redshifts: 0.5, 1.0, 1.5, 2.5, 3.7, 4.8, and 7.5. More details on the simulations can be found in Wambsganss, Bode & Ostriker (2003).
3 Arc Statistics
To analyze arc statistics, it is first necessary to identify those strongly lensed background sources to be interpreted as arcs. For a given realization and a specific source redshift, we populated the source plane by a regular grid of 800 by 800 sources, with separations of about 1.5 arcseconds. For each of these sources, we determined the image position(s) and magnification(s) in the image plane. We then selected only multiple images and demanded that at least one of the images had to have a magnification higher than a certain “threshold” magnification. We chose five different values for this threshold magnification: 5, 10, 15, 20, and 25.
A strongly lensed source is almost always highly distorted in the tangential direction, i.e. for circular sources, the magnification is very similar to the length-to-width ratio (this is exactly true for isothermal spheres). In general, however, the magnification of an image can be both in the tangential and radial direction. So, in principle, there could also be highly magnified undistorted images (Williams & Lewis 1998). However, as shown by Williams & Lewis (1998), for massive clusters with realistic profiles, almost all highly magnified images are indeed strongly elongated distorted arcs. We confirmed this by randomly checking various highly magnified images in our simulations; this has been found by other groups simulating lensing by galaxy clusters as well (Meneghetti 2003, personal communication). Hence, from here on we will take the length-to-width ratio of highly magnified images to be equal with their magnification: .
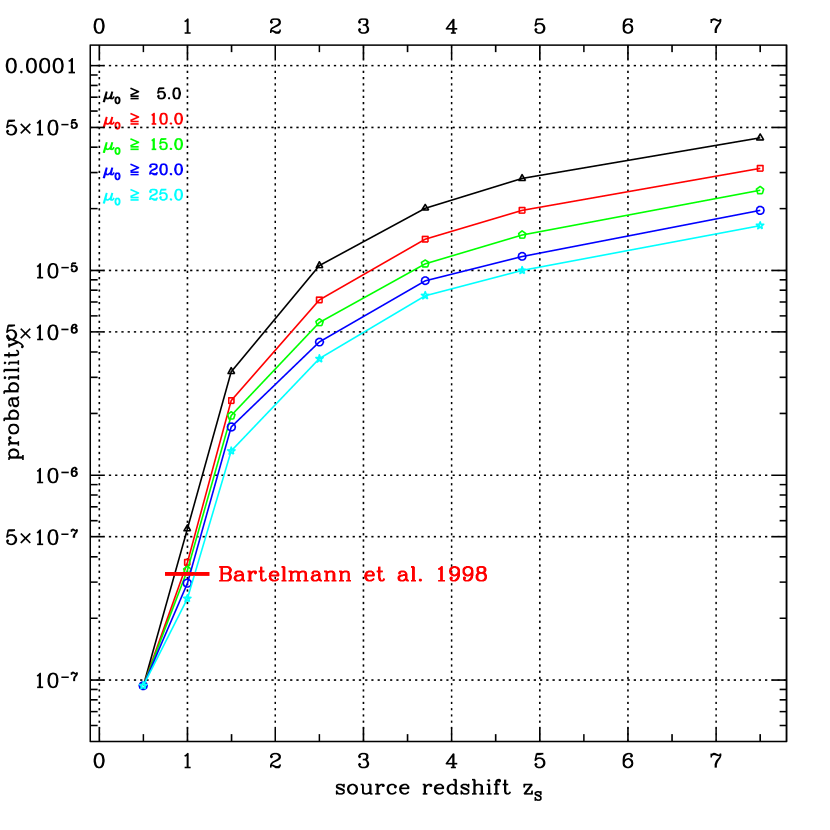
In order to evaluate the occurrence of arcs for the LCDM concordance model, we determine for the seven chosen source redshifts the frequency of multiply imaged sources containing at least one image with magnification greater than a given threshold . Figure 1 shows, as a function of source redshift, the distribution of this lensing optical depth for arcs with magnifications 5, 10, 15, 20, and 25. As can be seen, the probability for strong (arc) lensing is a very steep function of for source redshifts between ; the distribution gets somewhat shallower for sources at . This is independent of the chosen threshold magnification (or length-to-width ratio).
In order to compare our results with those of B98, we need to look at a source redshift of and a length-to-width ratio of : our value for this particular optical depth (red squares in Figure 1; see also Table 1) is , about 12% higher than the B98 value, indicating relatively good agreement between our result and the B98 value for this particular source redshift. The slightly higher result here can be partly understood as a consequence of our higher mass and spatial resolution (by factors of about five), and the fact that we consider a three-dimensional matter distribution. Our normalization (proportional to ) may be slightly higher than that adopted by B98. Using the method of Bode et al. (2001) we estimate the mass (within an Abell radius) at which the cumulative number density of clusters equals Mpc-3 to be ; some of the clusters used by B98 may have been less massive than this. Given the differences in technique, the agreement between the two numerical results for sources at is remarkably good.
Our analysis of the occurrence of arcs as presented here is “conservative” in the following sense: the underlying N-body simulations use only dark matter particles, i.e. there is no baryonic component included. As a consequence, the density profiles of the inner cores of the galaxy clusters are probably too shallow. Inclusion of baryons will lead to a steepening of the surface mass density profiles, which in turn would produce additional giant arcs (cf. Li and Ostriker 2002). In this sense our simulation is only a lower limit to the arc frequency. We shall investigate this effect quantitatively in a forthcoming paper (Bode, Ostriker, & Wambsganss, in preparation).
4 Discussion
In B98 the observational situation concerning the frequency of giant arcs is described and discussed in detail, with particular respect to the EMSS survey (Gioia & Luppino 1994, Le Fevre et al. 1994). In a new observational study, Zaritsky & Gonzalez (2003) have recently analyzed the occurrence of arcs around clusters in the Las Campanas Distant Cluster Survey. They found at least two giant arcs with a length-to-width ratio of in the sample of clusters within a redshift range , plus one strong lensing system outside this range. Their result confirms and strengthens the previous result that the observed frequency of arcs exceeds the B98 predictions by a factor of about 10. They also discuss in detail previous lensing surveys, which consistently point in the same direction. Gladders et al. (2003) likewise confirm that the incidence of arcs found in the Red-Sequence Cluster Survey “shows significant disagreement with theoretical predictions”.
With regard to this disagreement, the results of the numerical investigation presented in the previous section on the frequency of gravitationally lensed arcs with given length-to-width ratios in an LCDM cosmology have three important aspects:
-
1.
We find that the optical depth for the occurrence of giant arcs with a length-to-width ratio of at least for galaxies/sources at a redshift of is slightly higher, but essentially the same as what B98 have found, when corrected for the slight difference in the adopted cosmological model.
-
2.
The lensing optical depth is a very steep function of the source redshift for , and it is increasing even further for .
-
3.
Combining these two aspects with a realistic galaxy/source redshift distribution that extends beyond (and allows for a fraction of the galaxies to be at ) naturally results in a much higher probability for giant arcs than previously proposed for LCDM models.
The second aspect above is the key to the solution of the puzzle, and the reason that our conclusions with regard to the frequency of arcs in an LCDM cosmology are different from those of B98. They argue that the exact source redshift has only very little influence on the resulting optical depth for long arcs. The average cluster redshift in their models is , and they point out that the critical surface mass density for multiple images changes only little when sources are shifted from to . In fact, for a lens redshift of e.g. , the critical surface mass density does indeed change by only about 25% between these two source redshift values. However, the most important aspect here is not the fractional decrease of the critical surface mass density . What matters is rather how many more galaxy clusters become super-critical when the critical surface mass density is lowered by that amount. The cluster mass function at the high mass end is very steep, with a logarithmic slope of about -5 or even steeper (see, e.g., Bahcall, Fan & Cen 1997, or Jenkins et al. 2001). This means that even a relatively modest decrease in the value of the critical surface mass density for source redshifts slightly larger than unity can result in a relatively large increase of clusters with central surface mass density above this value, hence producing strongly lensed arcs (cf. Li and Ostriker 2002). The resulting values for the optical depth of arcs with different are shown in Figure 1 for various source redshifts; the corresponding numerical values are listed in Table 1. In particular, we find that for a source redshift of the optical depth for arcs (with length-to-width ratio ) is increased by about a factor of six, compared to its value for !
Another factor that contributes slightly to an increase of the probability of arcs for higher source redshifts is that the extra matter added at higher redshifts can boost non-critical clusters over the threshold for multiple images and/or strongly magnified arcs. This effect— which is automatically included by our method— can be surprisingly large for higher source redshifts (Wambsganss, Bode & Ostriker, in preparation).
It is important to note that the redshifts of known luminous arcs extend out to redshifts beyond . Table 2 lists a selection of clusters with measured arc redshifts. This is only meant to serve as an illustrative example, since most of these lens systems were not found in any systematic arc searches. But, even though we cannot take the redshift distribution of these arcs as representative, the fact that there are so many arcs with redshifts beyond and extending to , clearly means that high redshift sources have to be included in the determination of the overall optical depth for arcs. The very recent result of Gladders et al. (2003) confirms this trend of high arc redshifts: their arcs with measured redshifts range between , and the correspondingly very large distances of the RCS lensing clusters for which no arc redshift could be measured yet () point to (very) high redshifts for those arcs, too.
To explore the effect of including higher redshift sources more quantitatively, we defined three “test cases” for different redshift distributions of sources, convolved them with the corresponding optical depths, and compared the resulting value of the total optical depth with , the value obtained by B98. The three cases are: (1) sources divided evenly between three redshifts =0.5, 1.0, and 1.5, with a resulting optical depth of ; (2) sources divided evenly between three redshifts =1.0, 1.5, and 2.5, with a resulting optical depth of ; and (3) 33% of sources at , 30% at , 20% at , 10% at , 5% at , and 2% at , which yields an optical depth of . Our case 1 still has an average value of , but due to the “spread” in redshift, the value of the optical depth is increased by almost a factor of three compared to the case with “all arcs at redshift one”. The other two cases, which allow for a fraction of arcs with higher redshift, produce increases of factors of 10 and 7.3, when compared to the B98 values of the optical depth.
The examples of the previous paragraph show that for a realistic source redshift distribution which extends out to , we get about an order of magnitude more arcs for a LCDM concordance model. In particular for our test cases 2 and 3, the higher optical depth results in between 2000 and 3000 strongly lensing cluster producing arcs across the sky, or one arc per 14 to 20 square degrees. This is perfectly consistent with the observational studies of Gioia & Luppino (1994), Gladders et al. (2003) and Zaritsky & Gonzalez (2003). Gladders et al. (2003) had realized that their sample “probes a somewhat different redshift range” compared to the assumptions of B98. They had suggested that “the resulting differences should be factors of order unity”. We show here that relaxing the assumption that all the sources have a redshift of , i.e. allowing for a realistic source population with redshifts well beyond unity, means that an LCDM model can easily account for a factor of ten more arcs than was previously predicted.
5 Summary
We performed ray-shooting simulations through a pseudo-3D matter distribution obtained for a concordance lambda-dominated flat cosmological model (LCDM). We determined the frequency of giant arcs, as a tool to test the predictions of a such an LCDM cosmology. When we put all our sources at a redshift of , we basically reproduce the results of Bartelmann et al. (1998) for the frequency of arcs with a length-to-width ratio of at least ten: our results are about 12 % higher than theirs, which can be understood as a consequence of a slightly higher normalization and the inclusion of the full 3D matter distribution.
However, we find that the optical depth is a very steep function of the source redshift. The contribution of sources at redshifts beyond one easily dominates the statistics. Even for an average redshift of the lensed galaxies of roughly with a broad distribution, the frequency of arcs could be increased easily by a factor of three.
The redshift distribution of the known luminous arcs shows that many of them are at . If we hence give up the constraint that all viable sources for giant arcs are at redshift one, and allow for a distribution of source redshifts, then we find good agreement between the frequency of arcs predicted by an LCDM cosmological model and the observed situation, as evaluated by Gioia & Luppino (1994), Zaritsky & Gonzalez (2003) or Gladders et al. (2003). The predicted frequency of giant arcs for a concordance LCDM model goes up by about an order of magnitude compared to previous estimates (Bartelmann et al. 1998) and results in about one arc per 20 square degrees. Hence we consider the “missing arc” problem for a concordance LCDM cosmology to be solved.
References
- (1) Allen, S.W., Fabian, A.C., & Kneib, J.P. 1996, MNRAS, 279, 615
- Bartelmann et al. (1998) Bartelmann, M., Huss, A., Colberg, J.M., Jenkins, A., & Pearce, F.R. 1998, A&A, 330, 1 (B98)
- Bahcall, N.A., Fan, X., & Cen, R. (1997) Bahcall, N.A., Fan, X., & Cen, R. 1997 ApJ, 485, L53
- (4) Bézecourt, J., Soucail, G., Ellis, R.S., & Kneib, J.-P. 1999, A&A, 351, 433
- Bode et al. (2001) Bode, P., Bahcall, N.A., Ford, E.B., & Ostriker, J.P. 2001, ApJ, 551, 15
- Bode & Ostriker (2002) Bode, P. & Ostriker, J.P. 2003, ApJS, 145, 1
- Bridle et al. (2003) Bridle, S., Lahav, O., Ostriker, J.P., & Steinhardt, P.J. 2003, Science, 299, 1532
- (8) Broadhurst, T., Huang, X., Frye, B., & Ellis, R. 2000, ApJ, 534, L15
- (9) Campusano, L.E., Pelló, R., Kneib, J.-P., Le Borgne, J.-F., Fort, B., Ellis, R.S., Mellier, Y., & Smail, I. 2001, A&A, 378, 394
- (10) Cooray, A. 1999a, A&A, 341, 653
- (11) Cooray, A. 1999b, ApJ, 524, 504
- (12) Ebbels, T.M.D., Le Borgne, J.-F., Pelló, R., Ellis, R.S., Kneib, J.-P. et al. 1996, MNRAS, 281, L75
- (13) Ellis, R., Allington-Smith, J., & Smail, I. 1991, MNRAS, 249, 184
- (14) Franx, M., Illingworth, G.D., Kelson, D., van Dokkum, P.G., & Tran, K.-V. 1997, ApJ, 486, L75
- (15) Frye, B., & Broadhurst, T. 1998, ApJ, 499, L115
- Gladders et al. (2003) Gladders, M., Hoekstra, H., Yee, H.K.C., Hall, P.B., & Barrientos, L.F. 2003, ApJ, submitted (astro-ph/0303341)
- (17) Gladders, M., Yee, H.K.C., & Ellingson, E. 2002, AJ, 123, 1
- Gioia & Luppino (1994) Gioia, I.M. & Luppino, G.A. 1994, ApJS, 94, 583
- Flores, Maller, & Primack (2000) Flores, R.A., Maller, A.H., & Primack J.R. 2000, ApJ, 535, 555
- Fort & Mellier (1994) Fort, B., & Mellier, Y. 1995, A&A Rev., 5, 239
- Jenkins et al. (2001) Jenkins, A., Frenk, C.S., White, S.D.M., Colberg, J.M., Cole, S., Evrard, A.E. & Yoshida, N. 2001, MNRAS, 321, 372
- (22) Kneib, J.-P., Melnick, J., & Gopal-Krishna 1994, A&A, 290, L25
- Li & Ostriker (2002) Li, L-X. & Ostriker, J.P. 2002, ApJ, 566, 652
- Luppino et al. (1999) Luppino, G. A., Gioia, I. M., Hammer, F., Le Fevre, O., & Annis, J. A. 1999, ApJS, 136, 117
- (25) Le Fèvre, O., Hammer, F., Angonin, M.-C., Gioia, I., & Luppino, G.A. 1994, ApJ, 422, L5
- (26) Mellier, Y., Fort, B., Soucail, G., Mathez, G., & Cailloux, M. 1991, ApJ, 380, 334
- Meneghetti et al. (2000) Meneghetti, M., Bolzonella, M., Bartelmann, M., Moscardini, L., & Tormen, G. 2000, MNRAS, 314, 338
- Meneghetti et al. (2003) Meneghetti, M., Moscardini, L., & Bartelmann, N., 2003 preprint astro-ph/0302603
- (29) Miralda-Escudé, J., & Babul, A. 1995, ApJ, 449, 18
- (30) Natarajan, P., Loeb, A., Kneib, J.-P., & Smail, I. 2002, ApJ, 580, L17
- (31) Pelló, R., Bolzonella, M., Campusano, L.E., Dantel-Fort, M., Fort, B., Kneib, J.-P., Le Borgne, J.-F., Mellier, Y., Ellis, R.S., & Smail, I. 2001, Ap&SS, 277, 547
- (32) Pelló, R., Le Borgne, J.F., Sanahuja, B., Mathez, G., & Fort, B. 1992, A&A, 266, 6
- (33) Pelló, R., Kneib, J.-P., Le Borgne, J.-F., Bézecourt, J., Ebbels, T.M. et al. 1999, A&A, 346, 359
- (34) Ravindranath, S., & Ho, L.C. 2002, ApJ 577, 133
- (35) Sahu, K. C., Shaw, R.A., Kaiser, M.E., Baum, S.A., Ferguson, H.C. et al. 1998, ApJ, 492, L125
- (36) Sand, D.J., Treu, T., & Ellis, R.S. 2002, ApJ, 574, L129
- (37) Schindler, S., & Wambsganss, J. 1997, A&A, 322, 66
- (38) Seitz, S., Saglia, R.P., Bender, R., Hopp, U., Belloni, P., & Ziegler, B. 1998, MNRAS, 298, 945
- (39) Soucail, G., Mellier, Y., Fort, B., Mathez, G., & Cailloux, M. 1988, A&A, 191, L19
- Spergel et al. (2003) Spergel, D.N., Verde, L., Peiris H.V., Komatsu E., Nolta M.R., et al. 2003, ApJ, submitted (astro-ph/0302209)
- Wambsganss et al. (1995) Wambsganss, J., Cen, R., Ostriker, J.P., & Turner, E.L. 1995, Science, 268, 274
- Wambsganss et al. (1998) Wambsganss, J., Cen, R., & Ostriker, J.P. 1998, ApJ, 494, 29
- Wambsganss et al. (2003) Wambsganss, J., Bode, P., & Ostriker, J.P. 2003, (to be submitted to ApJ)
- Williams & Lewis (1998) Williams, L.L.R., & Lewis, G. 1998, MNRAS, 294, 299
- Zaritsky & Gonzalez (2003) Zaritsky, D., & Gonzalez, A.H. 2003, ApJ, 584, 691
| length-to-width ratioaaWe assume here that the length-to-width ratio of the arc is equal to its magnification | source redshift: | ||||||
|---|---|---|---|---|---|---|---|
| 1.0 | 1.5 | 2.5 | 3.7 | 4.8 | 7.5 | ||
| 9.4 | 5.5 | 3.2 | 1.1 | 2.0 | 2.8 | 4.4 | |
| 9.4 | 3.8 | 2.3 | 7.2 | 1.4 | 2.0 | 3.2 | |
| 9.4 | 3.5 | 2.0 | 5.6 | 1.1 | 1.5 | 2.5 | |
| 9.4 | 3.0 | 1.7 | 4.5 | 8.9 | 1.2 | 2.0 | |
| 9.4 | 2.5 | 1.3 | 3.7 | 7.5 | 1.0 | 1.7 |
| Cluster | Cluster redshift | Arc redshift | reference |
|---|---|---|---|
| A370 | z | zarc = 0.735, 0.81, 1.3 | Soucail et al. (1988), Bézecourt et al. (1999) |
| A963 | zcl = 0.206 | zarc = 0.771 | Ellis et al. (1991) |
| A2163 | z | zarc = 0.728 | Miralda-Escude & Babul (1995) |
| A2218 | z | zarc = 0.70, 1.03, 2.52, 5.60 | Pelló et al. (1992), Ebbels et al. (1996), Natarajan et al. (2002) |
| A2390 | z | zarc = 0.913, 4.04 | Frye & Broadhurst (1998), Pelló et al. (1999) |
| AC114 | z | zarc = 1.69, 1.87, 3.347 | Pelló et al. (2001), Campusano et al. (2001) |
| CL0024+17 | zcl = 0.39 | zarc = 1.675 | Broadhurst et al. (2000) |
| CL0500-24 | zcl = 0.327 | zarc = 0.913 | Schindler & Wambsganss (1997) |
| CL1358+62 | zcl = 0.328 | zarc = 4.92 | Franx et al. (1997) |
| CL2236-04 | zcl = 0.56 | zarc = 1.12, 1.33 | Kneib et al. (1994) |
| CL2244-02 | z | zarc = 2.24 | Mellier et al. (1999) |
| MS0440+0204 | z | zarc = 0.532, 1.63 | Gioia et al. (1998), Luppino et al. (1999) |
| MS1512+36 | z | zarc = 2.72 | Seitz et al. (1998) |
| MS2137-23 | z | zarc = 1.50 | Sand et al. (2002) |
| PKS0745-191 | z | zarc = 0.433 | Allen et al. (1996) |
| RCS0224-002 | z | zarc = 1.7, 4.88 | Gladders, Yee & Ellingson (2002), Gladders et al. (2003) |
| RCS2319-004 | z | z | Gladders et al. (2003) |
| RXJ1347-1145 | z | zarc = 0.81 | Sahu et al. (1998); Ravindranath & Ho (2002) |
| 1E0657-56 | z | zarc = 2.34, 3.08, 3.24 | Mehlert et al. (2001) |