High Angular Resolution, Sensitive CS and Imaging of the
Protostar L1551 NE:
Evidence for Outflow-Triggered Star Formation
?11affiliation:
Based on the observations made at the Nobeyama Radio Observatory (NRO),
which is a branch of the National Astronomical Observatory, an
interuniversity research institute operated by the Ministry of
Education, Science, Sports, Culture, and Technology.
Abstract
High angular resolution and sensitive aperture synthesis observations of CS () and CS () emissions toward L1551 NE, the second brightest protostar in the Taurus Molecular Cloud, made with the Nobeyama Millimeter Array are presented. L1551 NE is categorized as a class 0 object deeply embedded in the red-shifted outflow lobe of L1551 IRS 5. Previous studies of the L1551 NE region in CS emission revealed the presence of shell-like components open toward L1551 IRS 5, which seem to trace low-velocity shocks in the swept-up shell driven by the outflow from L1551 IRS 5. In this study, significant CS emission around L1551 NE was detected at the eastern tip of the swept-up shell from = 5.3 km s-1 to 10.1 km s-1, and the total mass of the dense gas is estimated to be 0.18 0.02 . Additionally, the following new structures were successfully revealed: a compact disklike component with a size of 1000 AU just at L1551 NE, an arc-shaped structure around L1551 NE, open toward L1551 NE, with a size of AU, i.e., a bow shock, and a distinct velocity gradient of the dense gas, i.e., deceleration along the outflow axis of L1551 IRS 5. These features suggest that the CS emission traces the post-shocked region where the dense gas associated with L1551 NE and the swept-up shell of the outflow from L1551 IRS 5 interact. Since the age of L1551 NE is comparable to the timescale of the interaction, it is plausible that the formation of L1551 NE was induced by the outflow impact. The compact structure of L1551 NE with a tiny envelope was also revealed, suggesting that the outer envelope of L1551 NE has been blown off by the outflow from L1551 IRS 5.
1 Introduction
Star formation is often affected by various external disturbances due to active phenomena such as expansion of H II regions, UV radiation from massive stars, and shock waves from supernova remnants. In contrast, the Taurus Molecular Cloud (TMC), the most intensively studied low-mass star-forming region lying at a distance of 140 pc (Elias, 1978), has been regarded as a site where star formation occurs spontaneously: the formation of each star progresses in an isolated environment. This is supported by the following two facts: 1) Although the TMC is located near the center of the Cas-Tau OB association, the association is old (25 Myr) and has already been dispersed into a wide area of 90∘ 40∘ (Blaauw, 1991). 2) Since the number density of the YSOs in the association is quite low, stars pc-3 (Gomez et al., 1993), the neighboring systems cannot gravitationally interact with each other during star formation. In the L1551 dark cloud, however, the protostars such as L1551 IRS 5 (hereinafter IRS 5), L1551 NE (hereinafter NE), HL Tau, and HH 30 might be mutually affected through their outflows. IRS 5, the most luminous protostar ( 30) in the TMC, has powerful outflows, and NE is located just in its red-shifted outflow lobe. It is therefore likely that the environment around NE is strongly affected by the outflows (Bachiller et al., 1994). Furthermore, both HL Tau and HH 30 have optical jets deeply penetrating the L1551 region, which would disturb the entire cloud: recent studies have revealed that dozens of parsec-scale HH flows driven by low-mass young stars are thought to disrupt surrounding molecular cloud cores and drive supersonic turbulence (Reipurth et al., 1997; Reipurth & Bally, 2001). Consequently, even in the TMC, outflows can play important roles in neighboring star formation.
L1551 NE, which was discovered by Emerson et al. (1984), is the second brightest protostar ( 6) in the TMC, and is categorized as a class 0 object (e.g., Barsony & Chandler 1993). Recent high angular resolution observations at = 3.6 cm have revealed that NE is a close binary of sources A and B with a separation of 05 at P.A. of 297∘ (Reipurth et al., 2002). The sources are likely to drive Harbig-Haro objects HH 28, HH 29, and HH 454 as well as the well collimated infrared [Fe II] jet (Devine et al., 1999; Reipurth et al., 2000). In addition, the interaction features between NE and the outflow lobe of IRS 5 have been revealed: high-velocity CS emission was detected around NE, and the distribution of the emission has a clumpy and shell-like structure open toward IRS 5, suggesting that the swept-up shell of the outflow from IRS 5 has impacted on NE (Plambeck & Snell, 1995). The detailed spatial and velocity structures of the swept-up shell, however, are still unknown owing to the insufficient angular resolutions and sensitivities. To investigate the detailed structures of the dense gas around NE and to reveal the relationship between NE and the red-shifted outflow lobe of IRS 5, we made aperture synthesis observations of NE in CS () and CS () emissions, which trace high-density and shocked gas, with higher angular resolution and better sensitivity.
2 Observations
2.1 CS () and CS () emissions with the Nobeyama Millimeter Array
Aperture synthesis observations of NE were carried out in CS () (97.980968 GHz) and CS () (146.969049 GHz) with the Nobeyama Millimeter Array (NMA), which consists of six 10 m antennas, during a period from 1999 November to 2002 February. The CS images were obtained using all the array configurations, D, C, and AB, whose ranges of the projected baseline lengths were , , and k at 98 GHz, and , , and k at 147 GHz, respectively. The system noise temperatures of SIS receivers in DSB mode were about 150 K at 98 GHz and 200 K at 147 GHz toward the zenith. We used a 1024 channel FX spectrocorrelator with a total bandwidth of 32 MHz, resulting in velocity resolutions of 0.095 km s-1 at 98 GHz and 0.063 km s-1 at 147 GHz. The center of the field was set on the NE position of (, ) = (4h 31m 44s.42, +18∘ 08 323). The FWHM sizes of the primary beam were 70 for 98 GHz and 51 for 147 GHz. Since the minimum baseline lengths at 98 GHz and 147 GHz were 3 k and 5 k, respectively, our observations were insensitive to structures extending more than 69 (104 AU at 140 pc) at 98 GHz and 41 (6 103 AU) at 147 GHz. The response across the observed passband for each sideband was determined from minutes observations of 3C454.3 and 3C279. Gain calibrators 0446+112, 0507+179, 0528+134 were observed every minutes. The flux density of each calibrator was derived from observations of Uranus. The overall uncertainty in the flux calibration was about 10 %. After these calibrations, only the data taken under good weather conditions were used in imaging. Using the AIPS package developed at the NRAO, we CLEANed maps by natural weighting with no taper in the UV plane.
The continuum data were also obtained with the digital spectral correlator UWBC (Okumura et al., 2000), which has 128 frequency channels and a 1024 MHz bandwidth per baseline. Visibility data of 100 GHz ( = 3 mm) continuum emission in both the lower ( GHz) and upper ( GHz) sidebands were obtained simultaneously with a phase-switching technique. The data of 150 GHz ( = 2 mm) continuum emission were obtained in the lower ( GHz) and upper ( GHz) sidebands. More details of the observational parameters are summarized in Table 1.
2.2 CS () emission with the Nobeyama 45 m telescope
Mapping observations of the CS () emission were carried out in 2001 February with the Nobeyama 45 m telescope. The beam size (HPBW) was 16 at the frequency of CS (). The main-beam efficiency, , was about 0.5. We used a cooled SIS receiver with a single sideband filter. The typical system noise temperature was 350 K (in SSB) at an elevation of 70∘. At the backend, an acousto-optic-spectrometer (AOS) which has 2048 channels with a 40 MHz bandwidth was employed, and the frequency resolution was 37 kHz corresponding to 0.11 km s-1 for CS (). A 2 2 area whose center is the NE position was mapped with a grid spacing of 10. The typical noise level in the map was 0.2 K in .
3 Results
3.1 3 mm and 2 mm continuum emission
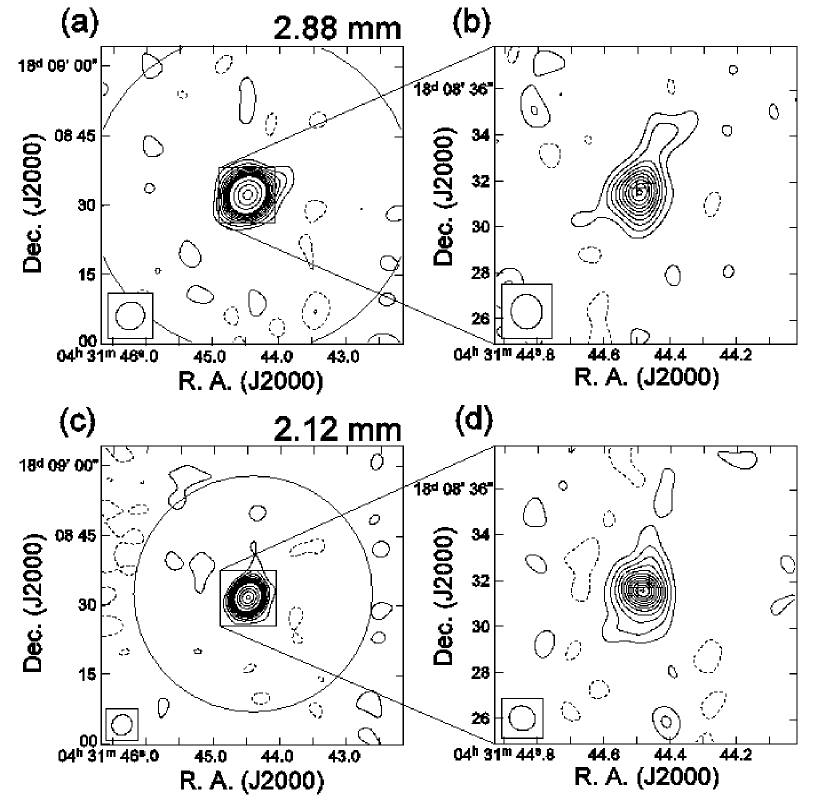
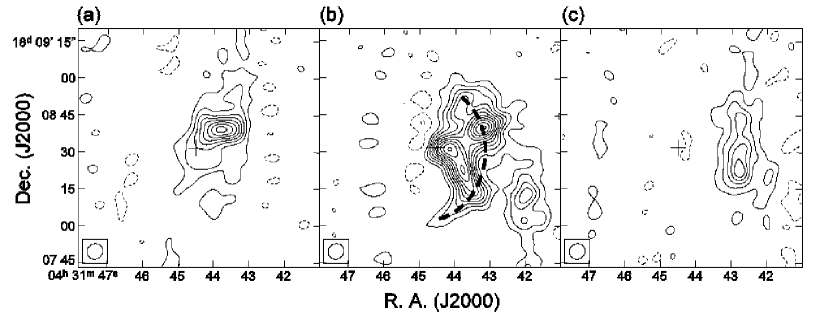
We have obtained = 3 mm and 2 mm continuum maps of NE with resolutions. Continuum emission at these wavelengths is thought to mainly come from thermal radiation of dust particles. Maps with the lowest and highest angular resolutions are shown in Figure 1. To obtain higher signal-to-noise ratios (S/N) in the 3 mm and 2 mm images, the data of both the lower and upper sidebands were combined into final images. Therefore, the center frequency of the 3 mm continuum images is 104 GHz ( = 2.88 mm), and that of the 2 mm continuum images is 141 GHz ( = 2.12 mm). The total flux densities of the continuum emission are 92.5 9.4 mJy at 104 GHz and 202 22 mJy at 141 GHz with the D configuration, and are 68.3 7.1 mJy at 104 GHz and 130 13 mJy at 141 GHz with the AB configuration (see Table 2). Both the images in the AB configuration show disklike structures elongating along the direction at P.A. = 159∘ 13∘ with the mean size of 139 100 (FWHM) (200 AU 140 AU), which is almost perpendicular to both the [Fe II] jet (Reipurth et al., 2000, P.A. 243∘) and the HH jets HH 28, HH 29, and HH 454 (Devine et al., 1999, P.A. 242∘). The peak positions of the continuum emission are (, ) = (04h 31m 44s.487, +18∘ 08 3157) at 3 mm, and (, ) = (04h 31m 44s.482, +18∘ 08 3158) at 2 mm. Since the typical positional error, which includes the effect of atmospheric seeing, is 03, both the peak positions are the same within the errors. We regard these positions as the source position of NE.
Recent VLA observations at = 3.6 cm revealed that NE is a close binary system with a 05 separation, corresponding to 70 AU at 140 pc. The stellar positions are (, ) = (04h 31m 44s.497, +18∘ 08 3167) for NE-A, and (, ) = (04h 31m 44s.465, +18∘ 08 3188) for NE-B (Reipurth et al., 2002), which are shown as crosses in Figure 1. Since both the binary components are surrounded by the disklike structure we revealed, this corresponds to a circumbinary disk around the stars. The peak positions of the 3 mm and 2 mm continuum emission, however, are almost consistent with the position of NE-A which probably ejects the [Fe II] jet (Reipurth et al., 2000), suggesting that the dust is more concentrated at NE-A than NE-B. In Figure 1, one cannot identify any inner hole, which could be generated by tidal force from the binary system. This is probably because NE is still in an active accretion stage and the accreting matter prevents the growth of the inner hole. To spatially resolve such a detailed structure of the circumbinary disk, extremely high angular resolution observations are required, and will be done with the Atacama Large Millimeter/ submillimeter Array (ALMA). The presence of another companion located to the 14 south of NE-A and B is suggested by Moriarty-Schieven et al. (2000), but we did not detect such a companion in both the 3 mm and 2 mm images in spite of our sufficient angular resolutions.
Assuming that the dust continuum emission around NE is optically thin at the millimeter wavelengths, and the dust temperature, , is uniform, we can estimate the mass of the disklike structure by
| (1) |
where is the dust mass absorption coefficient which is usually given by cm2 g-1 (Beckwith et al., 1990), is the Planck function, is the total flux density of the continuum emission, and is the distance to NE (140 pc). The power-law index of , , is derived as 0.70 from our results and the previous interferometric studies at 87 GHz and 230 GHz (Saito et al., 2001; Moriarty-Schieven et al., 2000). With = 42 K (Moriarty-Schieven et al., 1994), a mass of 0.032 0.003 is obtained.
3.2 CS emission
3.2.1 CS () and CS () emissions with the Nobeyama Millimeter Array
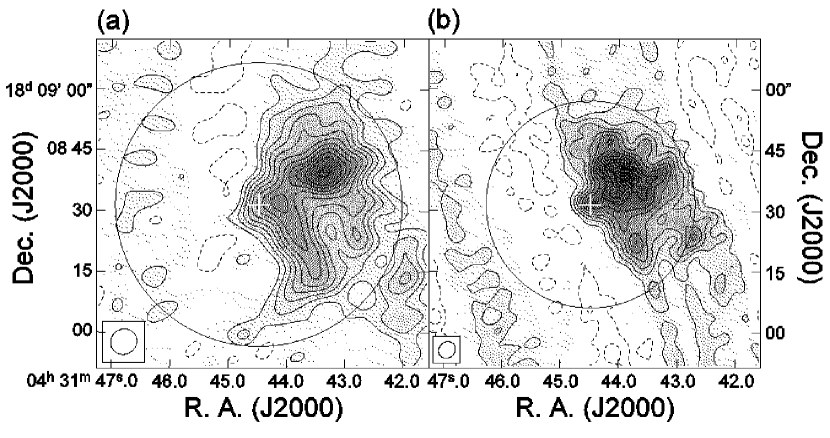
The emission above the 3 level is detected within the velocity range of km s-1 for CS () and km s-1 for CS (). The total intensity maps integrated over these ranges are shown in Figure 2. Both the images have revealed extended and clumpy components on the west side of NE. The brightest peak is seen to the northwest of NE. Another bright component is seen in the vicinity of NE. The elongated emission from the NE position to the southwest, which looks like a ridge with 20 in length, is seen in the CS () map, and a corresponding southwest peak is seen in the CS () map. No distinct emission, however, is seen on the east side of NE.
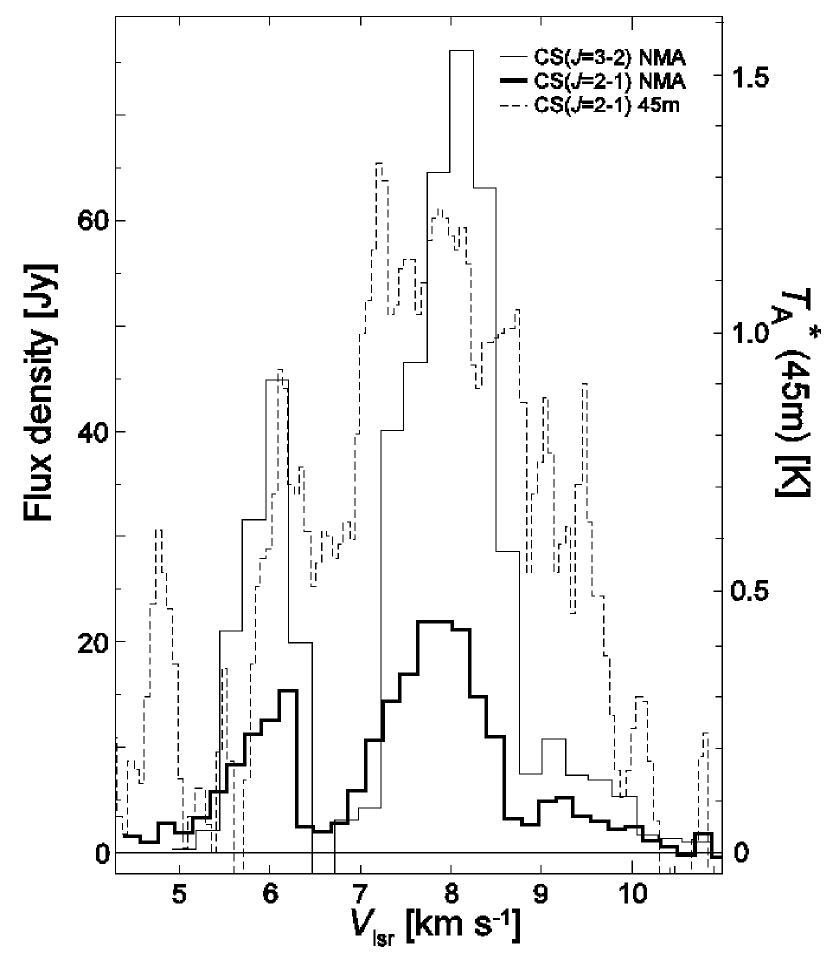
Figure 3 shows the CS () and CS () line profiles integrated over a 50 square around NE as well as the CS () line profile in the same region obtained with the 45 m telescope, which will be described in detail in § 3.2.2. Both the NMA profiles can be decomposed into three components: a blue-shifted component smaller than km s-1 (hereafter low-velocity blue: LVB), a red-shifted component in km s-1 (hereafter low-velocity red: LVR), and a highly red-shifted wing component greater than 8.5 km s-1 (hereafter high-velocity red: HVR). The emission around the systemic velocity of 6.7 km s-1, which was determined by the optically thin H13CO+ line emission (Saito et al., 2001), is not detected owing to self-absorption and resolving out of extended components caused by the lack of short spacing data in our observations. The three components can also be identified in channel maps (Figures 4 & 6) and a position-velocity (P-V) diagram along the outflow axis from IRS 5 (Figure 8a), which will be described later.
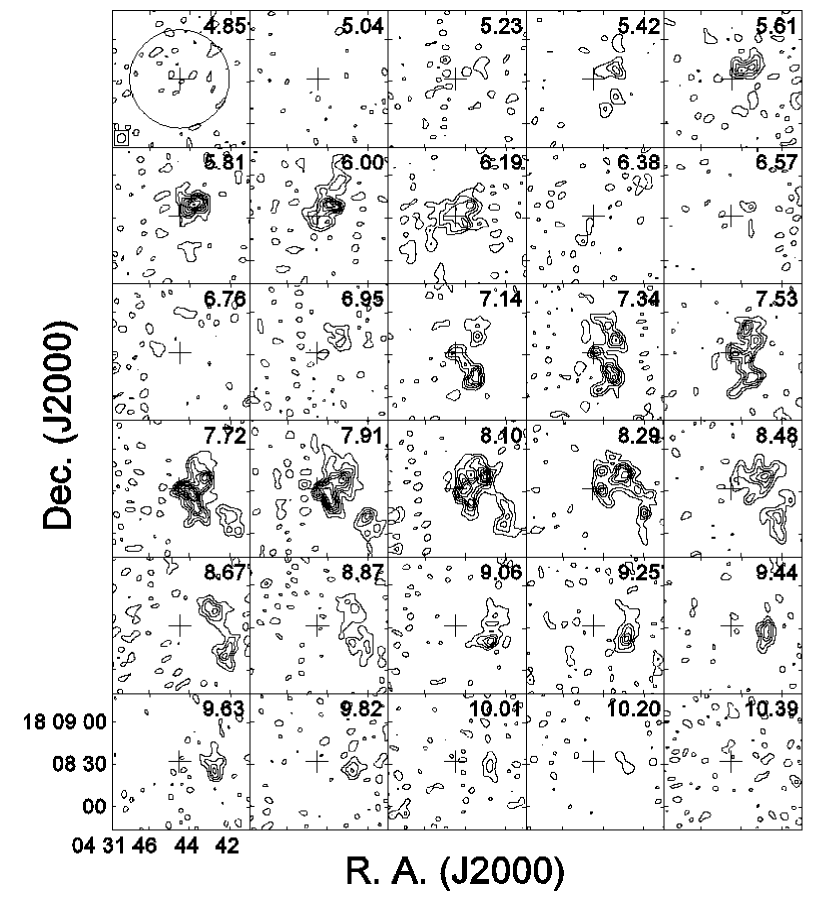
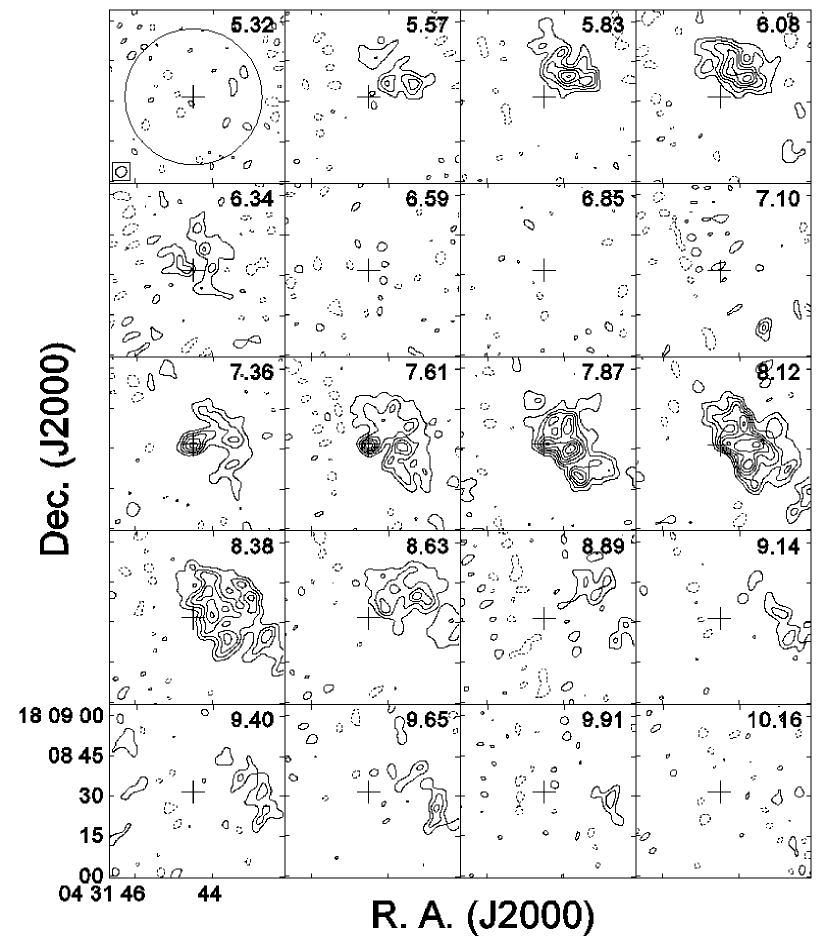
Figure 4 shows channel maps of CS () with a velocity resolution of 0.19 km s-1. From km s-1 to 6.19 km s-1, the CS gas is mainly distributed to the northwest of NE. In just the vicinity of NE, however, there is no emission in the range of km s-1 and is only weak extended emission in and 6.19 km s-1. No significant emission is detected in the range of km s-1, including the systemic velocity, mainly owing to the resolving out. In the following channels from km s-1 to 7.53 km s-1, a compact component is detected just at the NE position. The beam deconvolved size of the component is 110 65 (FWHM) (1540 910 AU) at P.A. of 60∘. This component possibly comes from the disk/envelope system around NE (hereafter the NE component). In these channels, other strong peaks are seen to the northwest and southwest of NE, and an inclined “W” shaped structure, which contains all the peaks, can be recognized. From km s-1 to 8.29 km s-1, the NE component and a peak located 20 northwest of NE are distinct. A new weak component 40 southwest of NE appears beyond km s-1. In the channels from km s-1 to 10.01 km s-1, the southwest and northwest components gradually merge into a west component which is apparent beyond km s-1.
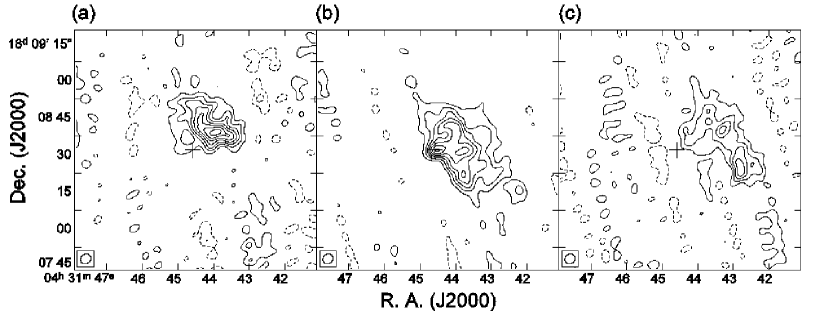
Figure 5 shows CS () maps for the LVB ( km s-1), LVR ( km s-1), and HVR ( km s-1) components. The LVB component is mainly distributed to the northwest of NE and its total flux density integrated over the region above the 3 level is 6.8 Jy km s-1. The LVR component shows an inclined “W” shaped structure with a southwest detached component. The overall emission is distributed along the north-south direction and is shifted to the west of NE. One bright peak is the NE component, and the other bright peaks show an arc-shaped structure open toward NE with a length of 7000 AU, as shown by the dashed line in Figure 5b. Although all the peaks seem to compose an arc open toward the west or IRS 5 as previously suggested (e.g., Plambeck & Snell 1995), we consider that the NE peak corresponds to the circumbinary disk while the other peaks, which originate from the gas swept up by the outflow from IRS 5, make the arc open toward NE. This arc-like structure is seen in the CS () maps at km s-1 and 7.53 km s-1 in Figure 4, and becomes more prominent in the CS () maps at km s-1 and 7.61 km s-1 in Figure 6. The arc can also be identified in the CS () maps from km s-1 to 10.01 km s-1 in Figure 4: the peak seen in 9.25 km s-1 gradually splits into the two peaks at the lower red-shifted velocities, which can be explained in terms of a bow shock around NE caused by the outflow from IRS 5. The middle part of the arc seems relatively weak, as easily recognized in the channel maps at = 7.14 and 7.34 km s-1 of Figure 4. This might be due to the blowing off of the dense gas by the collimated outflows or the HH jets from NE at P.A. 243∘. The total flux density above the 3 level is 21.9 Jy km s-1. The HVR component is distributed on the west side of the LVR component, and its total flux density is 8.1 Jy km s-1 (see Table 3).
Figure 6 shows channel maps of CS () with a velocity resolution of 0.25 km s-1. The features of the CS () emission shows a good agreement with those of CS () as follows: From km s-1 to 6.34 km s-1, extended emission is seen to the north of NE. From km s-1 to 7.10 km s-1, the emission is absent because of the resolving out. In the following channels from km s-1 to 8.12 km s-1, particularly to km s-1, one can clearly see the bright NE component surrounded by clumpy arc-shaped components which open toward NE. The size of the NE component is 74 46 (FWHM) (1040 640 AU) at P.A. of 126∘. In km s-1 to 9.91 km s-1, clumpy emission is seen to the west of the source. Figure 7 shows CS () maps for the LVB ( km s-1), LVR ( km s-1), and HVR ( km s-1) components. The overall features are almost consistent with those of CS () in Figure 5, but the NE component in the LVR range is much more prominent compared to the CS () case. This is probably because the NE component is denser and hotter than the surrounding extended component. The total flux densities of the LVB, LVR, and HVR components, are 22.9, 50.3, and 21.0 Jy km s-1, respectively (see Table 3).
We estimate the total mass of the dense gas around NE. Although the CS emission is generally optically thick around a protostar, the lower limit of the mass can be obtained under the simple assumption of optically thin condition. The mass of the dense gas can be calculated by the following equation (Scoville et al., 1986):
| (2) |
where is the excitation temperature, (CS) is the fractional abundance of CS relative to H2, is the distance to NE, and is the integrated flux density of CS () or CS (). With (CS) of 10-9 (Linke & Goldsmith, 1980) and of 20 K (Plambeck & Snell, 1995), the total mass of the dense gas is estimated to be 0.18 0.02 , and the mass of the NE component detected in the LVR range is estimated to be (1.0 0.1) 10-2 . The mass estimate is not sensitive to the adopted temperature: in the case of = 50 K, the upper limit temperature (Plambeck & Snell, 1995), the total mass becomes 0.39 0.04 , and the NE component mass becomes (2.4 0.3) 10-2 . Our total mass is in good agreement with the previously reported mass of from CS observations, considering (CS) they adopted (Plambeck & Snell, 1995). The mass of the NE component, however, is about a half of the mass derived from the continuum observations, suggesting that the CS emission is optically thick.
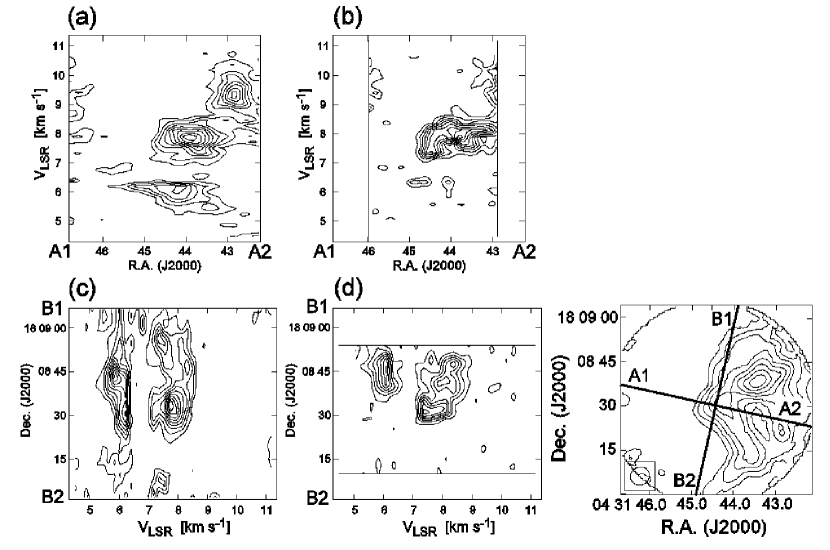
Figure 8 shows P-V diagrams of the CS () and CS () emission of NE. In the diagram along the direction between IRS 5 and NE (P.A. = 78∘, Figures 8a & b), which is roughly parallel to the outflow and jets of IRS 5 (Devine et al., 1999, P.A. 242∘), there exist three distinct components, corresponding to the LVB, LVR, and HVR components. Note that the emission near the systemic velocity ( 6.7 km s-1) is absent, owing to the resolving out of extended components. Figure 8a clearly shows a velocity gradient along the direction between IRS 5 and NE: as farther from IRS 5 or closer to NE, the amount of redshift gets smaller. This can be interpreted in terms of deceleration of the swept up shell associated with the red-shifted outflow lobe of IRS 5. In the diagram of CS () cut along the direction perpendicular to the outflow axis of IRS 5 (Figure 8c), on the other hand, no systematic motion was detected. The P-V diagrams of CS () show similar features to those of CS () (Figures 8b & d).
3.2.2 CS () emission with the Nobeyama 45 m telescope
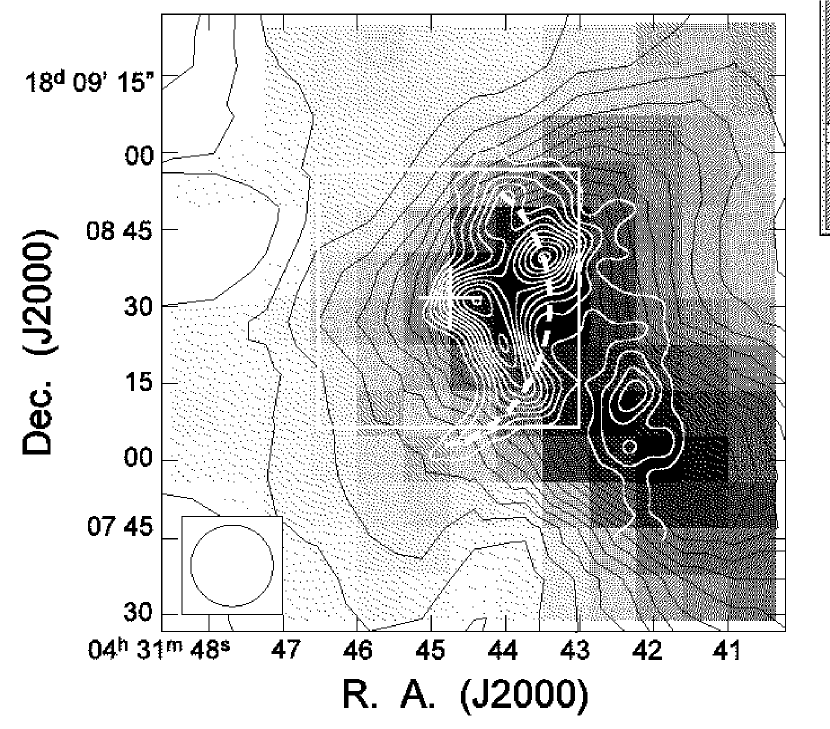
A total intensity map of CS () emission around NE integrated over km s-1 to 11.0 km s-1, which is obtained with the 45 m telescope, is shown as a gray scale image with contour lines in Figure 9. Two bright peaks can be seen: One is to the 15 west of NE which corresponds to the bright northwest peak seen in the NMA images of Figures 2a & 5b, and the other is to the 40 southwest of NE which corresponds to the southwest detached component seen in Figure 5b. The overall emission shows an arc-shaped structure (large-scale CS arc-shaped structure) which is open to the west, and NE is located at the eastern tip of the arc. The line profile integrated over a 50 square around NE is shown in Figure 3. The profile is mainly red-shifted compared to the systemic velocity of NE ( = 6.7 km s-1) where the self-absorption can be recognized. These features have been found in previous studies (e.g., Plambeck & Snell 1995), and the large-scale CS arc-shaped structure has been thought to trace the swept-up shell of the outflow powered by IRS 5. Another arc-shaped structure (small-scale CS arc-shaped structure) indicated by the white dashed line in Figure 9 has been newly discovered by this study (see also Figure 10).
In order to estimate the missing flux of the NMA observations, we compare the CS () flux densities with the NMA and the 45 m telescope in the same area of 50 square around NE. The total flux density with the 45 m telescope is 129 Jy km s-1 in the range km s-1 to 11.0 km s-1, while that with the NMA is 36.8 Jy km s-1 in almost the same velocity range km s-1. With the total flux density of the 45 m observations, equation (2) gives a total gas mass of 0.55 0.07 under the same assumptions as in the NMA case. The flux difference can mainly be attributed to the resolving out of extended components in the NMA observations. In the LVB ( km s-1) and LVR ( km s-1) ranges, the fraction of the missing flux density is about %. In the HVR range ( 8.5 km s-1) and around the systemic velocity ( 6.7 km s-1), more than 80 % of the 45 m flux density is missing. These indicate that the smoothly extended components are dominant in the HVR range as well as around the systemic velocity, suggesting that the red-shifted outflow gas from IRS 5 has a smooth structure.
4 Discussion
The NMA observations of the CS () emissions have revealed the small-scale arc-shaped structure around NE and the deceleration of the outflowing gas, suggesting that a distinct interaction exists between NE and the outflowing gas. We discuss the interaction between them in § 4.1. Next, we propose a plausible scenario of the outflow-triggered formation of NE in § 4.2. Finally, we discuss the possibility that the outflow from IRS 5 has blown off the outer envelope around NE in § 4.3.
4.1 Interaction between NE and the red-shifted outflow lobe of IRS 5
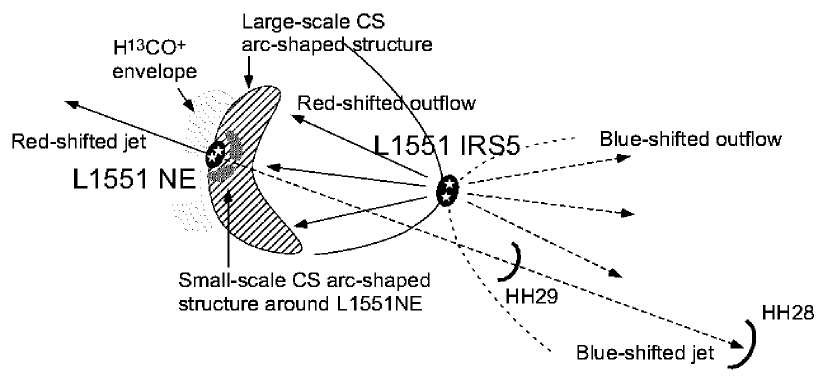
The circumstellar environment around NE has been strongly affected by the outflow from IRS 5, judging from the spatial distribution and velocity structure of the CS emission around NE. Figure 10 is a schematic illustration of NE and IRS 5, which briefly summarizes our results. The large-scale CS arc-shaped structure open toward IRS 5 around NE, which was revealed by the 45 m observations, is thought to trace the swept-up shell of the outflow from IRS 5, because the shell exhibits the highly red-shifted emission compared to the systemic velocities of IRS 5 and NE. Since NE is located at the leading edge of the shell, it is most likely that the shell has impacted on the natal core of NE.
The impact of the shell on NE is strongly supported by the small-scale CS arc-shaped structure, which is newly discovered by our observations. The arc is open toward NE and exhibits the distinct deceleration feature along the outflow axis of IRS 5. These suggest that the swept-up gas accelerated by the outflow from IRS 5 has impacted on NE or the natal core of NE, forming the bow-shock-like arc as well as the deceleration revealed in Figure 8a. Here, we estimate the deceleration of the gas, , under a simple assumption of constant deceleration. The projected distance between NE and the peak position of the HVR component in Figure 8a is 20, corresponding to 2800 AU. The HVR component has 9.2 km s-1, whereas the gas associated with NE has 6.7 km s-1. Considering the inclination angle of the outflow from IRS 5 to be with respect to the plane of the sky (Liseau & Sandell, 1986; Fridlund & Liseau, 1994; Momose et al., 1998), is estimated to be 10-3 km s-1 yr-1, and the timescale of the deceleration becomes 103 yr.
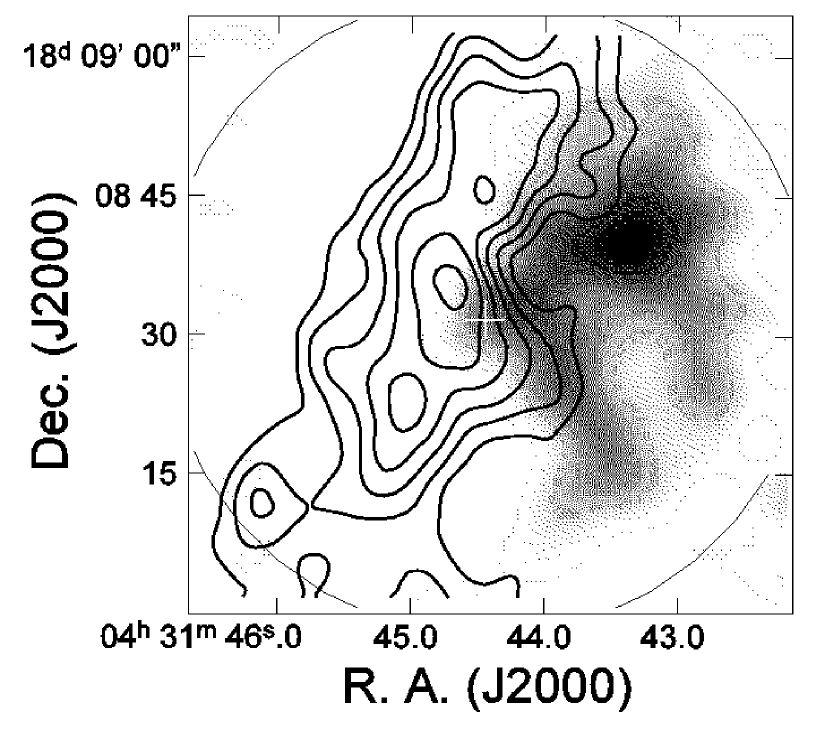
The comparison of the CS and H13CO+ emissions suggests that NE has formed at the shock front caused by the impact of the CS shell. Figure 11 shows the total intensity map of the H13CO+ emission (Saito et al., 2001) superposed onto the CS () map of NE by this study. Although both the CS and H13CO+ emissions trace dense gas, their distributions show clear anti-correlation. The H13CO+ emission is mainly distributed to the east of the source, which can be interpreted in terms of the depletion of H13CO+ by the outflow (Saito et al., 2001): Bachiller & Perez Gutierrez (1997) suggested that the H13CO+ molecules are rapidly destroyed in shocked regions owing to dissociative recombination caused by enhanced electron abundance. Thus, the H13CO+ emission seems to be distributed in the pre-shocked region. On the other hand, CS, a tracer of dense and shocked gas, is mainly distributed to the west of NE, suggesting that the CS emission is distributed in the post-shocked region disturbed by the outflow of IRS 5. Therefore, it is most likely that NE is located at the interface between the pre-shocked and post-shocked regions. This interpretation is also consistent with the fact that the H13CO+ emission was only detected within a range of km s-1 and no high-velocity components were detected, whereas the CS emission was detected in a wide range of km s-1.
The timescale for the interaction between the natal core of NE and the outflow of IRS 5 is characterized by the crossing time in which the outflow passes through the core, although there is ambiguity in the core radius. The curvature radius of the small-scale CS arc-shaped structure, AU, can be taken as the lower limit for the core radius, giving an interaction timescale of yr. This timescale is only twice the timescale of the ongoing deceleration of the CS gas of yr. The upper limit of the core radius, on the other hand, should be AU as suggested by the continuum map at 1.3 mm (Motte & André 2001), giving a timescale of yr. Note that the radius of AU agrees with the mean radius of the cores in the TMC (Onishi et al., 2002). The possible range of the interaction timescale, therefore, is yr. Since the separation between NE and IRS 5 is AU, only twice larger than the above upper limit of the core radius, the upper limit timescale of the interaction can also be regarded as a possible traveling time from IRS 5 to NE of the outflow ( yr).
4.2 Outflow-triggered star formation
In addition to the strong interaction between NE and the outflow of IRS 5, we discuss the possibility that the formation of NE was triggered by the impact of the outflow by comparing several timescales. Motte & André (2001) estimated the age of NE to be yr: The shortest age was derived from the assumption that the mass accretion rate declines exponentially given by
| (3) |
and the longest one was derived from the steady mass accretion rate of 2.0 10-6 yr-1. The interaction timescale between the NE core and the outflow from IRS 5, on the other hand, is yr, and this agrees with the above-mentioned age of NE. Although both the estimates of timescale contain uncertainty, this agreement suggests that the mass accretion of NE was triggered by the outflow from IRS 5: it is unlikely that the NE formation and the interaction between NE and the outflow have occurred independently but simultaneously at the same place in such a short span compared with a period of the protostellar phase ( yr). This would be the first evidence for the outflow triggered star formation in low-mass star forming regions.
In the blueshifted outflow lobe of IRS 5, there is another CS clump which resembles the shell near NE in spatial distribution, sizescale and the amount of velocity shifts with respect to the systemic velocity of IRS 5 (see Fig.3 of Plambeck & Snell 1995). A straight line connecting these two shells or clumps passes directly through IRS 5, suggesting these two shells were simultaneously ejected from IRS 5 with similar velocities. The separation from IRS 5 of the blueshifted shell, however, is about twice larger than that of the redshifted shell near NE. This difference might be caused by the obstruction by the NE core in the redshifted outflow lobe of IRS 5. If this is the case, the duration of the interaction between the NE core and the outflow from IRS 5 should be comparable to the traveling time from IRS 5 to NE of the outflow.
4.3 Blown off envelope around L1551 NE
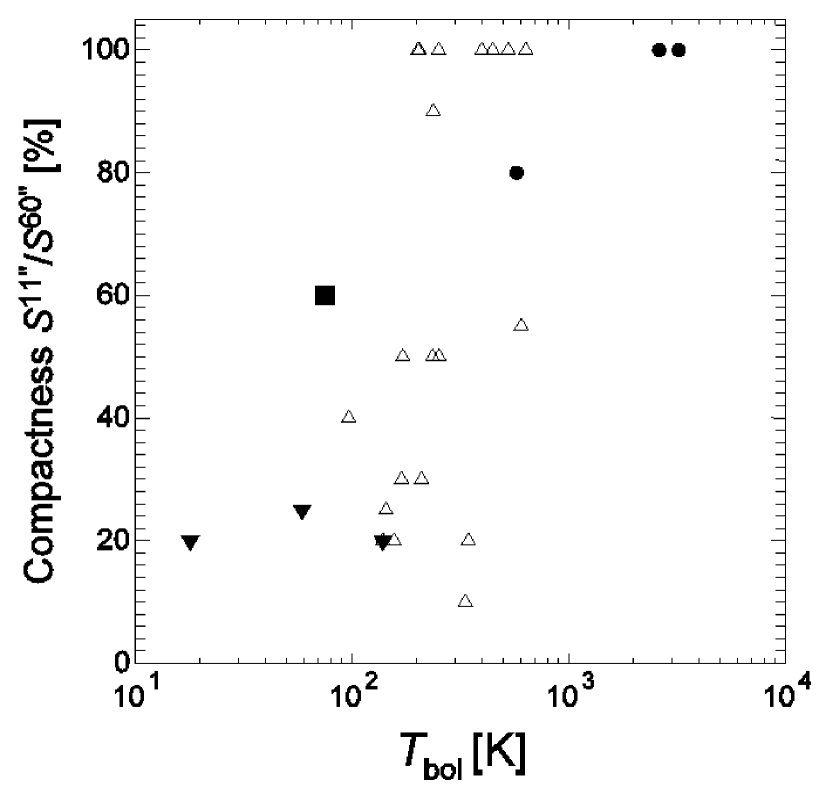
Class 0 protostars are usually surrounded by dense envelopes with a few 1000 AU sizes. As they evolve, the dense envelopes are dispersed, and T Tauri stars without the envelopes appear (Looney et al., 2000; Saito et al., 2001). NE, however, might be an exceptional class 0 protostar with a tiny envelope, which is probably caused by the impact of the swept-up shell of IRS 5. The compactness of the NE envelope is clearly demonstrated by the 1.3 mm continuum imaging survey of YSOs with the IRAM 30 m telescope (Motte & André, 2001). Figure 12 shows the compactness of YSOs defined by the ratio of the peak intensity with an 11 beam to the flux density within a diameter of 60 at 1.3 mm. Although NE has a low bolometric temperature of 75 K, the degree of the compactness of 60 % is considerably high compared to the other class 0 objects. Moriarty-Schieven et al. (2000) also showed that the 1.3 mm flux density of 0.851 0.084 Jy obtained by the OVRO interferometer (129 107 in HPBW) agrees with that of 0.83 0.03 Jy obtained by the JCMT (20 in HPBW) within the errors, indicating that the dust emission is centrally condensed. Furthermore, the NE component seen in Figures 4 & 6 has a small size of 1000 AU, suggesting the gas envelope is also compact. One possible interpretation of such an unusually compact envelope is that the swept-up shell accelerated by the outflow from IRS 5, which likely to trigger the NE formation, has blown off the outer parts of the envelope.
The outflow of IRS 5 seems to have enough power to blow off the circumstellar envelope around NE as follows: The momentum flux put into the dense gas around NE by the decelerating swept-up shell is given by
| (4) |
where is the mass of the swept-up shell of 0.18 , and is estimated to be 10-4 km s-1 yr-1. Here we assume that all the momentum flux which the outflow lost is put into the dense gas for simplicity. On the other hand, for a typical protostar with a mass of 0.5 surrounded by an envelope with 2000 AU radius and 0.1 mass, the momentum required to dissipate the envelope would be 7.0 10-2 km s-1. Since the age of NE is 104 yr, the momentum flux required to blow off the envelope have to be larger than 10-5 km s-1 yr-1. This flux is one order of magnitude smaller than , indicating that the outflow from IRS 5 might have blown off the outer parts of the envelope around NE.
5 Summary
We have presented the new results of the high angular resolution and high sensitivity CS (/) observations of the protostar L1551 NE. The main results are as follows:
-
1.
Both the CS () and () emissions were detected from 5.3 to 10.1 km s-1, and their distributions are quite similar to each other. The arc-shaped structure open toward NE and the compact disklike structure at the NE position were clearly resolved. The total mass of the dense gas is estimated to be 0.18 0.02 , and the mass contained in the disklike structure is (1.0 0.1) 10-2 .
-
2.
One-arcsec resolution imaging of 3 mm and 2 mm continuum emission has revealed the disklike structure, perpendicular to the [Fe II] jet and the HH jets HH 28, 29, and 454. The size of the structure is 139 100 (200 AU 140 AU) at P.A. of 159 13∘ and the estimated mass is 0.032 0.003 . Although NE is a binary system consisting of NE-A and NE-B, the main contributor of the dust continuum emission seems to be NE-A.
-
3.
The CS gas around NE shows the distinct velocity gradient along the outflow axis of IRS 5. This can be explained by the deceleration of the swept-up shell accelerated by the outflow from IRS 5, suggesting that the swept-up shell has impacted on NE.
-
4.
The distributions of the CS and H13CO+ emissions show clear anti-correlation, suggesting that CS is abundant in the post-shocked regions, whereas H13CO+ is abundant in the pre-shocked regions.
-
5.
Since the timescale of the interaction is comparable to the age of NE, it is likely that the formation of NE was triggered by the impact of the swept-up shell of the outflow from IRS 5.
-
6.
Our and previous results suggest that NE has a compact circumstellar envelope with a size of 1000 AU, although NE is categorized as a class 0 object. The outer parts of the envelope might be blown off by the outflow from IRS 5, because the momentum put in by the swept-up shell is sufficient to blow off the envelope.
Acknowledgements
We are grateful to the staff of the Nobeyama Radio Observatory (NRO)
for both operating the Millimeter Array and helping us with data
reduction. We also thank an anonymous referee for providing helpful
suggestions to improve the paper. S. Y. was financially supported by a
Research Fellowship of the Japan Society for the Promotion of Science
for Young Scientists.
References
- Bachiller et al. (1994) Bachiller, R., Tafalla, M., & Cernicharo, J. 1994, ApJ, 425, L93
- Bachiller & Perez Gutierrez (1997) Bachiller, R. & Perez Gutierrez, M. 1997, ApJ, 487, L93
- Barsony & Chandler (1993) Barsony, M. & Chandler, C. J. 1993, ApJ, 406, L71
- Beckwith et al. (1990) Beckwith, S. V. W., Sargent, A. I., Chini, R. S., & Guesten, R. 1990, AJ, 99, 924
- Blaauw (1991) Blaauw, A. 1991, NATO ASIC Proc. 342: The Physics of Star Formation and Early Stellar Evolution, 125
- Devine et al. (1999) Devine, D., Reipurth, B., & Bally, J. 1999, AJ, 118, 972
- Emerson et al. (1984) Emerson, J. P., Harris, S., Jennings, R. E., Beichman, C. A., Baud, B., Beintema, D. A., Wesselius, P. R., & Marsden, P. L. 1984, ApJ, 278, L49
- Elias (1978) Elias, J. H. 1978. ApJ, 224, 857
- Fridlund & Liseau (1994) Fridlund, C. V. M. & Liseau, R. 1994, A&A, 292, 631
- Gomez et al. (1993) Gomez, M., Hartmann, L., Kenyon, S. J., & Hewett, R. 1993, AJ, 105, 1927
- Linke & Goldsmith (1980) Linke, R. A. & Goldsmith, P. F. 1980, ApJ, 235, 437
- Liseau & Sandell (1986) Liseau, R. & Sandell, G. 1986, ApJ, 304, 459
- Looney et al. (2000) Looney, L. W., Mundy, L. G., & Welch, W. J. 2000, ApJ, 529, 477
- Momose et al. (1998) Momose, M., Ohashi, N., Kawabe, R., Nakano, T., & Hayashi, M. 1998, ApJ, 504, 314
- Moriarty-Schieven et al. (1994) Moriarty-Schieven, G. H., Wannier, P. G., Keene, J., & Tamura, M. 1994, ApJ, 436, 800
- Moriarty-Schieven et al. (2000) Moriarty-Schieven, G. H., Powers, J. A., Butner, H. M., Wannier, P. G., & Keene, J. 2000, ApJ, 533, L143
- Motte & André (2001) Motte, F. & André, P. 2001, A&A, 365, 440
- Okumura et al. (2000) Okumura, S. K. et al. 2000, PASJ, 52, 393
- Onishi et al. (2002) Onishi, T., Mizuno, A., Kawamura, A., Tachihara, K., & Fukui, Y. 2002, ApJ, 575, 950
- Plambeck & Snell (1995) Plambeck, R. L. & Snell, R. L. 1995, ApJ, 446, 234
- Reipurth et al. (1997) Reipurth, B., Bally, J., & Devine, D. 1997, AJ, 114, 2708
- Reipurth et al. (2000) Reipurth, B., Yu, K., Heathcote, S., Bally, J., & Rodríguez, L. F. 2000, AJ, 120, 1449
- Reipurth & Bally (2001) Reipurth, B. & Bally, J. 2001, ARA&A, 39, 403
- Reipurth et al. (2002) Reipurth, B., Rodríguez, L. F., Anglada, G., & Bally, J. 2002, AJ, 124, 1045
- Saito et al. (2001) Saito, M., Kawabe, R., Kitamura, Y., & Sunada, K. 2001, ApJ, 547, 840
- Scoville et al. (1986) Scoville, N. Z., Sargent, A. I., Sanders, D. B., Claussen, M. J., Masson, C. R., Lo, K. Y., & Phillips, T. G. 1986, ApJ, 303, 416
| Observation period | 1999 November - 2002 February | |
|---|---|---|
| Molecular line | CS () | CS () |
| Frequency [GHz] | 97.980968 | 146.969049 |
| Velocity resolution [km s-1] | 0.19 | 0.25 |
| Synthesized beam size | 653 615 | 435 386 |
| Position angle [∘] | -56.0 | -44.9 |
| Noise level (1 ) [Jy beam-1] | 0.12 | 0.18 |
| Continuum [GHz] | 98 0.512, 110 0.512 | 135 0.512, 147 0.512 |
| Synthesized beam size (D/AB)∗ | 628 587 / 152 135 | 451 419 / 118 110 |
| Position angle [∘] (D/AB)∗ | -49.9/ 5.2 | -41.6/ 54.8 |
| Noise level (D/AB)∗ [mJy beam-1] | 1.4 / 2.0 | 2.6 / 2.6 |
| Phase amplitude calibrator (flux density) | 0446+112 (1.4Jy) | |
| 0507+179 (1.4Jy) | 0507+179 (1.9Jy) | |
| 0528+134 (2.6Jy) | ||
| Bandpass calibrator | 3C454.3, 3C279 | |
| [K] (in DSB) | 150 K | 200 K |
Note. — ∗ D and AB are the NMA array configurations D (lowest angular resolution) and AB (highest angular resolution), respectively.
| Frequency | Total flux density | Peak flux density | Deconvolved size | P.A. | Beam size | P.A. | NMA config. |
|---|---|---|---|---|---|---|---|
| [mJy] | [mJy beam-1] | [ ] | [ ∘ ] | [ ] | [ ∘ ] | ||
| 104 GHz | 92.5 9.4 | 74.6 | 3.99 2.64 | 147 | 6.28 5.87 | -49.9 | D |
| 68.3 7.1 | 41.5 | 1.36 0.78 | 154 | 1.52 1.35 | 5.2 | AB | |
| 141 GHz | 202 22 | 159 | 2.41 1.12 | 155 | 4.51 4.19 | -41.6 | D |
| 130 13 | 60.4 | 1.43 1.29 | 180 | 1.18 1.10 | 54.8 | AB |
| CS (=2-1) | CS (=3-2) | ||||||
|---|---|---|---|---|---|---|---|
| Mean Mass | |||||||
| [ km s-1 ] | [ Jy kms-1 ] | [ km s-1 ] | [ Jy kms-1 ] | [10-2 ] | |||
| Low-velocity blue (LVB) | 5.32 - 6.47 | 6.8 | 5.43 - 6.47 | 22.9 | 3.9 0.5 | ||
| NE component | 6.47 - 8.57 | 2.6 | 6.47 - 8.51 | 4.9 | 1.0 0.1 | ||
| Low-velocity red (LVR) | 7.04 - 8.57 | 21.9 | 7.23 - 8.51 | 50.3 | 10.0 0.8 | ||
| High-velocity red (HVR) | 8.57 - 10.11 | 8.1 | 8.51 - 10.04 | 21.0 | 4.0 0.4 | ||
| Total | 36.8 | 94.2 | 17.9 1.7 | ||||