Large disk-like galaxies at high redshift11affiliation: Based on service mode observations collected at the European Southern Observatory, Paranal, Chile (ESO Programme 164.O-0612). Also based on observations with the NASA/ESA Hubble Space Telescope, obtained at the Space Telescope Science Institute which is operated by AURA, Inc., under NASA contract NAS5-26555.
Abstract
Using deep near-infrared imaging of the Hubble Deep Field South with ISAAC on the Very Large Telescope we find 6 large disk-like galaxies at redshifts . The galaxies, selected in (), are regular and surprisingly large in the near-infrared (rest-frame optical), with face-on effective radii or kpc in a CDM cosmology, comparable to the Milky Way. The surface brightness profiles are consistent with an exponential law over effective radii. The WFPC2 morphologies in Hubble Space Telescope imaging (rest-frame UV) are irregular and show complex aggregates of star-forming regions ( kpc) across, symmetrically distributed around the -band centers. The spectral energy distributions show clear breaks in the rest-frame optical. The breaks are strongest in the central regions of the galaxies, and can be identified as the age-sensitive Balmer/4000 Å break. The most straightforward interpretation is that these galaxies are large disk galaxies; deep NIR data are indispensable for this classification. The candidate disks constitute 50% of galaxies with at . This discovery was not expected on the basis of previously studied samples. In particular, the Hubble Deep Field North is deficient in large galaxies with the morphologies and profiles we report here.
Accepted for publication in the Astronomical Journal Letters
1 Introduction
Disk galaxies are believed to undergo a relatively simple formation process in which gas cools and contracts in dark matter halos to form rotationally supported disks with exponential light profiles (Fall & Efstathiou, 1980; Mo, Mao, & White, 1998). A critical test of any theory of galaxy formation is to reproduce the observed properties and evolution of galaxy disks.
Previous optical spectroscopy and HST imaging have yielded a wealth of data on disk galaxies at (e.g., Vogt et al. 1996, 1997; Lilly et al. 1998; Barden et al. 2003), although contradictory claims have been made regarding the implications for the size and luminosity evolution with redshift (see Lilly et al. 1998; Mao, Mo, & White 1998; Barden et al. 2003), and the importance of surface brightness selection effects (see Simard et al. 1999; Bouwens & Silk 2002).
It is still unknown what the space density and properties are of disk galaxies at substantially higher redshift. Many galaxies at have been identified using the efficient U-dropout technique (Steidel et al., 1996a, b). Most of these objects are compact with radii kpc, while some are large and irregular (Giavalisco, Steidel, & Macchetto, 1996; Lowenthal et al., 1997). However, the U-drop selection requires high far-UV surface brightness due to active, spatially compact, and unobscured star formation. As a result, large and UV-faint disk galaxies may have been overlooked and, additionally, the morphologies of LBGs could just reveal the unobscured star-forming regions rather than the more evolved underlying population which forms the disk.
The most direct evidence for the existence of large disks at high redshift has come from observations in the NIR, which provide access to the rest-frame optical. Here the continuum light is more indicative of the distribution of stellar mass than in the UV and nebular lines are accessible for kinematic measurements. van Dokkum & Stanford (2001) discuss a -selected galaxy at with a rotation velocity of km s-1. Erb et al. (2003) detect km s-1 rotation at kpc radii in the emission line of galaxies at and Moorwood et al. (2003) find km s-1 rotation at kpc from the center of a galaxy at , seen in the NIR spectrum of the [O III]5007 Å emission line.
The imaging data in these studies, however, are of limited depth and resolution, making it difficult to determine morphological properties. In this Letter, we present an analysis of the rest-frame ultraviolet-to-optical morphologies and spectral energy distributions (SEDs) of 6 large candidate disk galaxies at using the deepest groundbased NIR dataset currently available (Labbé et al., 2003). Throughout, we adopt a flat -dominated cosmology ( kms-1Mpc-1). All magnitudes are expressed in the Johnson photometric system.
| Galaxya | ||||||||
|---|---|---|---|---|---|---|---|---|
| 302 | 19.70 | 1.439i | -22.70 | 19.70 | 0.89 | 0.70 | 0.86 | 0.46 |
| 267 | 19.98 | 1.82 | -22.88 | 19.92 | 0.75 | 0.74 | 0.88 | 0.37 |
| 257 | 20.25 | 2.027i | -23.08 | 19.53 | 0.74 | 0.74 | 0.84 | 0.36 |
| 657 | 20.68 | 2.793i | -23.56 | 19.33 | 0.76 | 0.70 | 0.74 | 0.18 |
| 611 | 20.53 | 2.94 | -23.59 | 18.51 | 0.65j | 0.52 | 0.97 | 0.27 |
| 494 | 21.14 | 3.00 | -23.31 | 18.84 | 0.75j | 0.56 | 0.86 | 0.47 |
| a Catalog identification numbers (see Labbé et al. 2003) | f half-light radii (arcsec) |
|---|---|
| b -band total magnitudes | g half-ligt radii, PSF-matched to (arcsec) |
| c Rest-frame absolute -band magnitudes | h Ellipticity |
| d Face-on rest-frame -band central surface brightnesses | i Spectroscopic redshifts |
| e Face-on best-fit effective radii (arcsec) | j Two-component models (point + exponential) |
2 Observations
We obtained 102 hours of NIR and imaging in the HDF-S () under excellent seeing (FWHM046), using ISAAC (Moorwood, 1997) on the VLT. The observations were taken as part of the Faint InfraRed Extragalactic Survey (FIRES; Franx et al., 2000). We combined our data with existing deep optical HST/WFPC2 imaging (version 2; Casertano et al., 2000), in the and bands, and we assembled a -selected catalog of sources with SExtractor (Bertin & Arnouts, 1996). Photometric redshifts and rest-frame luminosities were derived by fitting a linear combination of empirical galaxy spectra and stellar population models to the observed flux points (Rudnick et al., 2001, 2003a). The reduced images, photometric catalog, and redshifts are presented in Labbé et al. (2003) and are all available on-line at the FIRES homepage111http://www.strw.leidenuniv.nl/~fires. Furthermore, we obtained optical spectroscopy with FORS1 on the VLT for some of the sources (Rudnick et al., 2003b). Additional redshifts were obtained from Vanzella et al. (2002). As discussed in Rudnick et al. (2001, 2003a), our photometric redshifts yield good agreement with the spectroscopic redshifts, with rms for .
Large disk galaxies in the HDF-South were identified by fitting exponential profiles convolved with the Point Spread Function (PSF) to the -band images. Six objects at have effective radii kpc, three of which have spectroscopic redshifts. The mean redshift of the sample is 2.4. We will focus on these large galaxies in the remainder of the Letter. The structural properties of the full -selected sample will be discussed in Trujillo et al. (2003).
3 Rest-frame Optical versus UV Morphology
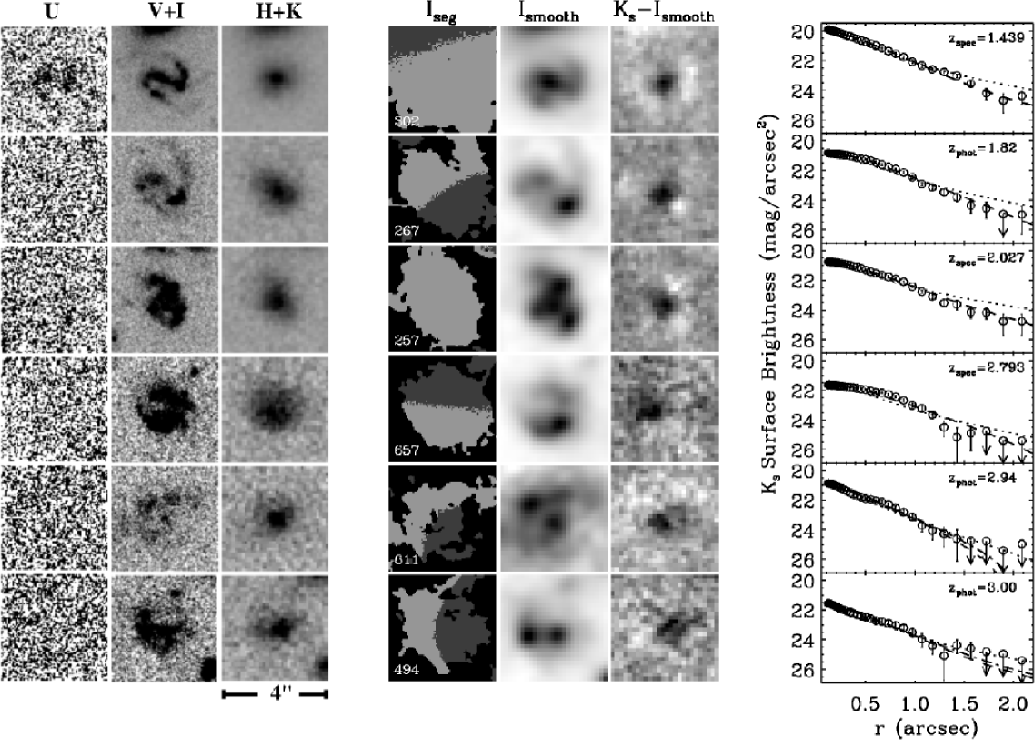
The large galaxies are shown in Figure 1. They have a regular morphology in the ISAAC -band (), which probes rest-frame optical wavelengths between 5400 and 9000 Å. In contrast, the WFPC2 and -band morphologies, which map the unobscured star-forming regions at rest-frame UV wavelengths between 1500 and 3300 Å, are irregular with several knots up to ( kpc) apart, symmetrically distributed around the -band centers. In a few cases the observed optical light is spatially almost distinct from the NIR.
As a result of the structure in the WFPC2 imaging, 4 of the large objects have been split up into two sources by Casertano et al (2003). Fig. 1 shows the corresponding “segmentation” map by “SExtractor” which illustrates how the pixels in each image are allocated to different sources. The galaxies were not split up when the band image was used to detect objects. However, the broader PSF in the -band image can play a role: if we smooth the -band data to the same resolution, we find that SExtractor only splits up 1 galaxy.
Hence, the question remains whether these 4 objects split up in are superpositions or whether they are part of larger systems. We tested this by subtracting the PSF-matched -band images from the -band images. The -band images were scaled to the -band images to minimize the residuals. The residuals are shown in Fig. 1. In all cases, we find strong positive residuals close to the centers of the objects as defined in the -band, whereas residuals at any of the -band peaks might be expected in case of a chance superposition. Furthermore, we performed photometric redshift analyses for subsections of the images and found no evidence for components at different redshifts.
4 Profile fits and sizes
Next, we fitted simple models convolved with the PSF (FWHM046) to the two-dimensional surface brightness distributions in the -band. The images are well-described by a simple exponential law over effective radii (galaxy 302, 267, 257 and 657) or by a point source plus exponential (galaxy 611 and 494), where the point source presumably represents the light emitted by a compact bulge contributing about 40% of the light. We also derived intensity profiles by ellipse fitting. As can be seen in Figure 1, most galaxies are well described by an exponential. The central surface brightnesses and effective radii, enclosing half of the flux of the model profile, are corrected to face-on and shown in Table LABEL:tab.a. The central surface brightness is multiplied with , as an intermediate case between optically thin and optically thick, and corrected for cosmological dimming.
The effective radii (semi-major axes) are surprisingly large, ( kpc in a CDM cosmology), comparable to the Milky Way and much larger than typical sizes of “normal” Ly-break galaxies (Giavalisco, Steidel, & Macchetto, 1996; Lowenthal et al., 1997). As might be expected from the previous section, the I-band images have even larger effective radii. All galaxies have a “red” nucleus, and the colors become bluer in the outer parts.
Overall, the optical-to-infrared morphologies and sizes are strikingly similar to disk galaxies in the local universe, with red bulges, more diffuse bluer exponential disks and scattered, UV-bright star forming regions. Some even show evidence of well-developed grand-design spiral structure. However, the mean central surface brightness of the disks is mag higher than that of nearby disk galaxies and the mean rest-frame color is mag bluer (c.f. Lilly et al. 1998). Passive evolution can lead to disks with normal surface brightnesses at low redshift. Alternatively, the disks are disrupted later by interactions or evolve into S0’s, which have higher surface brightnesses (e.g., Burstein 1979).
5 Spectral Energy Distribution
The overall SEDs of the galaxies show a large variety. Four of the galaxies (257, 267, 494 and 657) satisfy conventional U-dropout criteria (Madau et al., 1996; Giavalisco & Dickinson, 2001). One galaxy is at too low redshift (302) to be classified as a U-dropout, and one other galaxy is too faint in the rest-frame UV (611). It has , and is part of the population of evolved galaxies identified by Franx et al (2003) and van Dokkum et al (2003).
The red colors of the central components can be due to either dust, higher age, emission line contamination, or a combination of effects. The SEDs show stronger Balmer/4000 Å breaks in the inner parts than in the outer parts (see Fig. 2 for an example). We derived colors inside and outside of a 0.7 arcsec radius centered on the -band center. The mean differences are mag in observed and mag in rest-frame . Higher resolution NICMOS data are required to address the population differences in more detail.
![[Uncaptioned image]](/html/astro-ph/0306062/assets/x2.png)
The spectral energy distribution of source 611 in a circular diameter aperture (left) and in a concentric diameter ring (right), normalized to the -band flux. Overplotted are independent model fits from Rudnick et al. (2003a).
6 Discussion
We have found 6 large galaxies with characteristics similar to those of nearby disk galaxies: exponential profiles with large scale lengths, more regular and centrally concentrated morphologies in the restframe optical than in the rest-frame UV, and, as a result, red nuclei. It is very tempting to classify these galaxies as disk galaxies, given the similarities with low redshift disk galaxies. However, kinematic studies are necessary to confirm that the material is in a rotating disk. Photometric studies of larger samples are needed to constrain the thickness of the disks. We note that simulations of Steinmetz & Navarro (2002) can show extended structures during a merging or accretion event. The expect duration of this phase is short, however, while the disk galaxies comprise a high fraction of the bright objects. It is therefore unlikely that a significant fraction of the galaxies presented here are undergoing such an event.
The density of these large disk galaxies is fairly low: over a survey area of arcmin2 and to a magnitude limit of they make up 6 out of 52 galaxies at . However, they do constitute 6 out of the 12 most rest-frame luminous galaxies in the same redshift range. The comoving volume density is Mpc-3 at a mean redshift . Obviously, larger area surveys are needed to establish the true density. We note that three of the galaxies only have photometric redshifts, one of which (a U-drop galaxy at ) is in the poorly tested range . The volume density of disk galaxies with kpc in the local universe is much higher at Mpc-3 (de Jong, 1996), although many nearby disks would not be present in our high redshift sample because their surface brightness would be too low.
We note that similar galaxies are absent in the very deep Near-IR imaging data on the HDF-N ( Williams et al. 1996; Dickinson 2000) Although notable differences between optical and NIR morphologies were reported for two of the largest LBGs in the HDF-N, no large galaxies were reported to have red nuclei and exponential profiles as in the HDF-S. The two fields are different in other aspects as well. We found earlier that the HDF-N is deficient in red sources (e.g., Labbé et al. 2003 versus Papovich, Dickinson, & Ferguson 2001) and the disk galaxies are more luminous in the -band than most of the high-redshift galaxies found in the HDF-N (Papovich, Dickinson, & Ferguson, 2001). The larger number of red galaxies in the HDF-S (e.g., Labbé et al. 2003, Franx et al. 2003) and their strong clustering (Daddi et al., 2003) may indicate that the red galaxies and large disks are both part of the same structures with high overdensities, and evolve into the highest overdensities at low redshift, i.e. clusters. If this is the case, the large disk galaxies may be the progenitor of large S0 galaxies in the nearby clusters, which have very similar colors as elliptical galaxies (e.g., Bower, Lucey, & Ellis 1992).
Finally, we can compare the observed disk sizes to theoretical predictions. It is often assumed (Fall & Efstathiou, 1980; Mo, Mao, & White, 1998) that the disk scale length is determined by the spin parameter and the circular velocity of the virialized dark matter halo (Fall & Efstathiou, 1980; Mo, Mao, & White, 1998). For a CDM cosmology, Mo, Mao, & White (1999) predict that the space density of large ( kpc) bright U-dropouts is 1.1 Mpc-3, whereas we find Mpc-3 for our 4 U-drops at a mean . This difference of a factor of two is not very significant, given our low number statistics and small survey volume. The combination of sizes and rotation velocities will give much stronger constraints on these models; it may be possible to measure the kinematics of some of these large galaxies using NIR spectrographs on large telescopes.
References
- Barden et al. (2003) Barden et al., 2003, ApJ, submitted (astro-ph/0302392)
- Bertin & Arnouts (1996) Bertin, E. & Arnouts, S. 1996, A&AS, 117, 393
- Bouwens & Silk (2002) Bouwens, R. & Silk, J. 2002, ApJ, 568, 522
- Bower, Lucey, & Ellis (1992) Bower, R. G., Lucey, J. R., & Ellis, R. S. 1992, MNRAS, 254, 601
- Burstein (1979) Burstein, D. 1979, ApJ, 234, 435
- Casertano et al. (2000) Casertano, S. et al., AJ, 120, pp. 2747–2824, 2000
- Daddi et al. (2003) Daddi, E., et al., ApJ, in press
- de Jong (1996) de Jong, R. S. 1996, A&A, 313, 45
- Dickinson (2000) Dickinson, M., Philos. Trans. R. Soc. London A 358, p. 2001, 2000
- Erb et al. (2003) Erb et al., 2003, ApJ, in press
- Fall & Efstathiou (1980) Fall, S. M. & Efstathiou, G. 1980, MNRAS, 193, 189
- Förster Schreiber et al. (2003) Förster Schreiber, N.M. et al. 2003, in preparation
- Franx et al. (2000) Franx, M. et al., The Messenger 99, pp. 20–22, 2000
- Franx et al. (2003) Franx, M. et al. 2003, ApJ, 587, L79
- Giavalisco, Steidel, & Macchetto (1996) Giavalisco, M., Steidel, C. C., & Macchetto, F. D. 1996, ApJ, 470, 189
- Giavalisco & Dickinson (2001) Giavalisco, M. & Dickinson, M. 2001, ApJ, 550, 177
- Labbé et al. (2003) Labbé, I. et al. 2003, AJ, 125, 1107
- Lilly et al. (1998) Lilly, S. et al. 1998, ApJ, 500, 75
- Lowenthal et al. (1997) Lowenthal, J. D. et al. 1997, ApJ, 481, 673
- Madau et al. (1996) Madau, P., Ferguson, H. C., Dickinson, M. E., Giavalisco, M., Steidel, C. C., & Fruchter, A., MNRAS283, pp. 1388–1404, 1996
- Mao, Mo, & White (1998) Mao, S., Mo, H. J., & White, S. D. M. 1998, MNRAS, 297, L71
- Mo, Mao, & White (1998) Mo, H. J., Mao, S., & White, S. D. M. 1998, MNRAS, 295, 319
- Mo, Mao, & White (1999) Mo, H. J., Mao, S.,& White, S. D. M. 1999, MNRAS, 304, 175
- Moorwood (1997) Moorwood, A. F. 1997, Proc. SPIE, 2871, 1146
- Moorwood et al. (2003) Moorwood, A., van Der Werf, P., Cuby, J.-G., Oliva, E. 2003, Proceedings of the Workshop on The Mass of Galaxies at Low and High Redshift, eds. R. Bender and A. Renzini, Springer-Verlag, p302.
- Steinmetz & Navarro (2002) Steinmetz, M. & Navarro, J. F. 2002, New Astronomy, 7, 155
- Papovich, Dickinson, & Ferguson (2001) Papovich, C., Dickinson, M., & Ferguson, H. C. 2001, ApJ, 559, 620
- Rudnick et al. (2001) Rudnick, G. et al. 2001, AJ, 122, 2205
- Rudnick et al. (2003a) Rudnick, G. et al. 2003a, in preparation
- Rudnick et al. (2003b) Rudnick, G. et al. 2003b, in preparation
- Schade et al. (1996) Schade, D., Lilly, S. J., Le Fevre, O., Hammer, F., & Crampton, D. 1996, ApJ, 464, 79
- Simard et al. (1999) Simard, L. et al. 1999, ApJ, 519, 563
- Steidel et al. (1996a) Steidel, C. C., Giavalisco, M., Dickinson, M., & Adelberger, K. L. 1996, AJ, 112, 352
- Steidel et al. (1996b) Steidel, C. C., Giavalisco, M., Pettini, M., Dickinson, M., & Adelberger, K. L. 1996, ApJ, 462, L17
- Trujillo et al. (2003) Trujillo et al. 2003, in preparation
- van Dokkum & Stanford (2001) van Dokkum, P. G. & Stanford, S. A. 2001, ApJ, 562, L35
- van Dokkum et al. (2003) van Dokkum, P. G. et al. 2003, ApJ, 587, L83
- Vanzella et al. (2002) Vanzella, E. et al. 2002, A&A, 396, 847
- Vogt et al. (1996) Vogt, N. P., Forbes, D. A., Phillips, A. C., Gronwall, C., Faber, S. M., Illingworth, G. D., & Koo, D. C. 1996, ApJ, 465, L15
- Vogt et al. (1997) Vogt, N. P. et al. 1997, ApJ, 479, L121
- Williams et al. (1996) Williams, R. E. et al. 1996, AJ, 112, 1335