A study of the two northern open clusters
NGC 1582 and NGC 1663
††thanks: Based on observations carried out at Mt Ekar, Asiago, Italy,
††thanks: Data is only available in electronic form at the CDS via
anonymous ftp to cdsarc.u-strasbg.fr (130.79.128.5) or
via http://cdsweb.u-strasbg.fr/cgi-bin/qcat?J/A+A//
We present CCD observations obtained in the field of the previously
unstudied northern open clusters NGC 1582 and NGC 1663. For the former, we also
provide high-resolution spectra of the brightest stars and complement our data
with Two-Micron All-Sky-Survey (2MASS) near-infrared photometry and with
astrometric data from the Tycho-2 catalog.
From the analysis of all these data, we argue that NGC 1582 is a very poor,
quite large and heavily contaminated open cluster. It turns out to have a
reddening , to be situated pc from the
Sun and to have an age of Myr.
On the other hand, we were not able to unambiguously clarify the nature of
NGC 1663. By assuming it is a real cluster and from the analysis of its
photometric diagrams, we found a color excess value ,
an intermediate age value ( Myr) and a distance of about pc.
The distribution of the stars in the region however suggests we are probably
facing an open cluster remnant. As an additional result, we obtained aperture
photometry of three previously unclassified galaxies placed in the field of
NGC 1663 and performed a preliminary morphological classification of them.
Key Words.:
Galaxy: open clusters and associations: individual: NGC 1582 and NGC 1663 – open clusters and associations: general1 Introduction
This study is part of a long term project aimed at providing accurate CCD
photometry for poorly known or unstudied northern open clusters (Carraro 2002a,
and references therein). Here we focus our attention on the open clusters
NGC 1582 and NGC 1663. Both objects have never been studied before, apart from
the identification and a preliminary estimate of their angular size. Their basic
data are summarized in Table 1.
By inspecting the finding charts of these two clusters (see Figs. 2 and 10), we notice mainly that:
-
•
NGC 1582 lies in a region where several bright stars are present, many of them with a Henry Draper (HD) classification. The cluster appears as a weak concentration of a small group of bright stars well mixed with the very rich Galactic disk field star population toward its direction. This renders it difficult to study objects like this, and this is -we guess- the main reason for which this object has been almost neglected up to now;
-
•
NGC 1663, which is located fairly high above the galactic plane, suffers from less contamination, and resembles the kind of objects recently suggested by Bica et al. (2001) to be Probable Open Cluster Remnants (POCRs).
In this study we would like to address the issue of the real nature of these two
objects and to provide the first estimate of their fundamental parameters,
namely distance, reddening, size and age. Therefore, we performed multicolor
photometry for both, and high-resolution spectroscopy for some stars in the NGC
1582 field. We also complement and cross-correlate our data with the 2MASS
catalog and with proper motions from the Tycho-2 catalog (Høg et al.
2000), whenever available.
The plan of this study is as follows: In Sect. 2 we briefly present the
observations and data reduction. In Sect. 3 and Sect. 4 we illustrate our
analysis and results for NGC 1582 and NGC 1663, respectively. Sect. 5 is
dedicated to a preliminary analysis of three previously unclassified galaxies in
the field of NGC 1663. Finally, in Sect. 6 we draw our conclusions.
| NGC 1582 | 04:32:15.4 | +43:50:43 | ||
| NGC 1663 | 04:49:24.3 | +13:08:27 |
2 Observations and data reduction
2.1 Photometry
CCD observations were carried out with the AFOSC camera at the 1.82 m Copernico telescope of Cima Ekar (Asiago, Italy), in the photometric night of November 8, 2002. AFOSC samples a field in a nitrogen-cooled thinned CCD.
| Field | Filter | Exposure time | Seeing | Airmass | ||
| [sec.] | [] | |||||
| NGC 1582 | U | 900x2 | 180 | 20 | 2.5 | 1.196 |
| B | 600 | 60 | 10 | 2.3 | 1.230 | |
| V | 300 | 30 | 5 | 2.4 | 1.255 | |
| I | 300 | 30 | 5 | 2.1 | 1.274 | |
| NGC 1663 | U | 900x2 | - | - | 2.5 | 1.348 |
| B | 600 | 60 | - | 2.4 | 1.215 | |
| V | 300 | 30 | 3 | 2.2 | 1.188 | |
| I | 300 | 30 | 3 | 2.0 | 1.190 | |
| PG 0231+051 | U | 800 | 2.5 | 1.348 | ||
| B | 300 | 2.4 | 1.324 | |||
| V | 60 | 2.2 | 1.316 | |||
| I | 90 | 2.2 | 1.315 | |||
| PG 2213-006 | U | 600 | 2.5 | 1.447 | ||
| B | 150 | 2.3 | 1.457 | |||
| V | 30 | 2.3 | 1.465 | |||
| I | 30 | 2.3 | 1.472 | |||
| Calibration | ||||||
| coefficients | ||||||
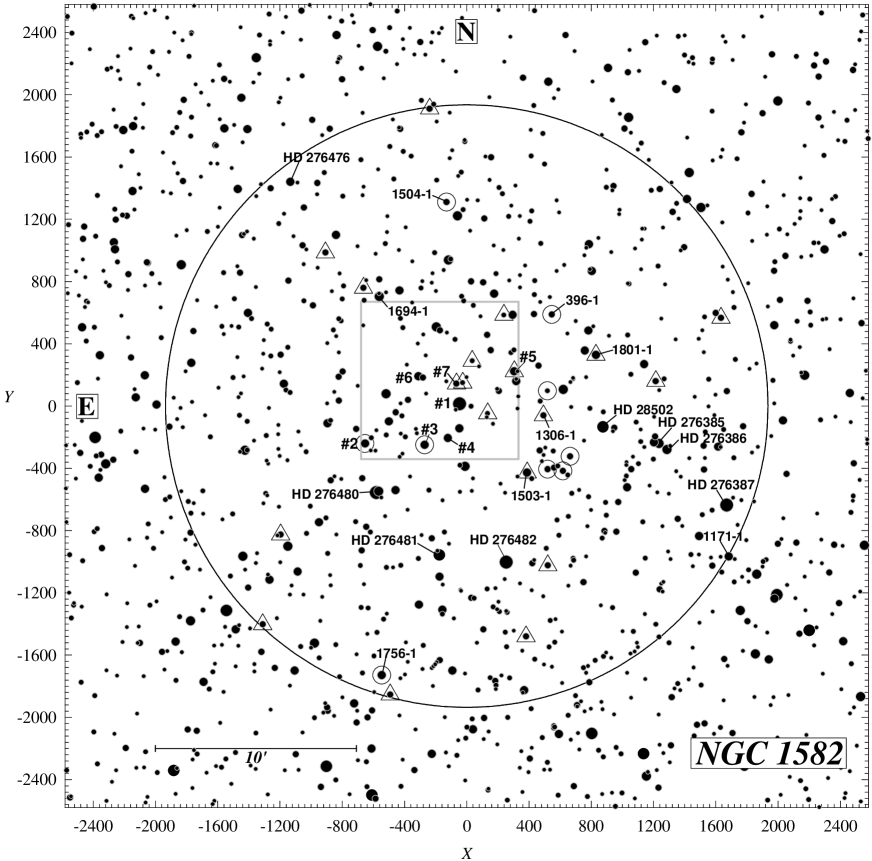
Details of the observations are listed in Table 2, where the observed fields are reported together with the exposure times, the typical seeing values and the air masses. Figs. 2 and 10 show the finding charts of the NGC 1582 and NGC 1663 regions respectively, indicating the covered areas and the object angular sizes. The data has been reduced with the IRAF†††IRAF is distributed by NOAO, which are operated by AURA under cooperative agreement with the NSF. packages CCDRED, DAOPHOT, and PHOTCAL using the point spread function (PSF) method (Stetson 1987). The calibration equations obtained by observing Landolt (1992) PG 0231+051 and PG 2213-006 fields during the night, are:
| (1) | |
| (2) | |
| (3) | |
| (4) | |
| (5) |
where are standard magnitudes, are the instrumental ones, is
the airmass and the used coefficients are presented at the bottom of Table 2.
As for magnitudes, when magnitude was available, we used
expression (3) to compute them, elsewhere expression (4) was used. The standard
stars in these fields provide a very good color coverage, essential to obtain
reliable transformations. For the extinction coefficients, we assumed the
typical values for the Asiago Observatory (, , and values
in Table 2,
Desidera et al. 2002†††http://www.pd.astro.it/Asiago/2000/2300/2310.html).
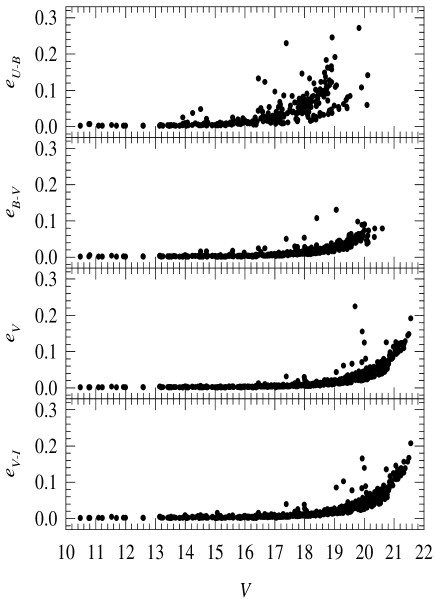
Photometric global errors have been estimated following Patat & Carraro (2001)
and their trends against magnitude are shown in Fig. 1.
2.2 Spectroscopy
High-resolution ()
spectra of 10 stars (see Table 3 and Fig. 5) in the field of NGC 1582 were obtained during
the nights of January 14-15 and February 14, 2003, using the REOSC Echelle
Spectrograph attached to the 1.82 m telescope of Asiago Astronomical
Observatory. This instrument works with a Thomson 10241024 CCD and the
allowed wavelength coverage is approximately Å. Details on this
instrument are given in Munari & Zwitter (1994) and on the Asiago
Obervatory Home page†††http://www.pd.astro.it/Asiago/2000/2300/2320.html.
The exposure times were 45 minutes for all the stars. In order to improve the
signal-to-noise ratio, two exposures were taken for each star reaching at the
end values up to 70. The data have been reduced with the IRAF package
ECHELLE using thorium lamp spectra for wavelength calibration purposes. By
comparing final known sky line positions along the spectra we derived an error
of about 0.01 Å.

Spectra were classified mainly on the basis of the intensity of the Fe, H and
He lines -depending on the spectral type- and by comparing them with
spectrophotometric standards. The results are shown in Fig. 5, where we plot the
Echelle spectra of the 10 measured stars degraded to a resolution of about
90 Å/mm. A few main lines are also shown. These spectra have been then
compared with stellar libraries from Montes et al. (1997, 1999) and Jaschek &
Jaschek (1987) to obtain estimates of spectral types and luminosity classes.
Individual radial velocity values were obtained with the RVIDLINES task using up
to 10 lines. Typical errors in the radial velocity amount to 3.0 km/s. The
resulting classification together with the radial velocity values are listed in
Table 3.
3 NGC 1582
NGC 1582 (= OCL 407 = C0428+43) is commonly considered an open cluster with a
diameter in the range of (Dias et al. 2002) to
(Lyngå 1987). Our CCD observations only cover the cluster central region
(see Fig. 2). Therefore, in order to better probe the cluster size and nature,
we complemented our data with near IR photometry from the 2MASS catalog.
3.1 Stellar counts
To derive the radial stellar surface density we adopted the cluster center
given by Dias et al. (2002, see Table 1), and we use: a) the
corresponding DSS-2‡‡‡Second generation Digitized Sky Survey,
http://www.eso.org/dss
red image of , and b) all the stars from
the 2MASS catalog inside a circle of radius 30′, centered on the
adopted cluster center. The computation is done by performing star counts inside
increasing concentric rings wide around the cluster center and then
dividing by their respective surfaces. The density profiles obtained in the two
cases are very similar. For the sake of illustration, only the one derived from
2MASS data is shown in Fig. 3. By inspecting this plot we notice that the
cluster appears as a weak over-density up to from the center,
where the stellar density reaches the field value. As anticipated, the
cluster turns out to be much larger than the area we covered with our CCD
observations and we adopt as the radius. This way, the obtained
diameter has a value close to the previous qualitative suggestion by
Lyngå (1987).
| # | 2MASS ID. | Memb. | |||||||||||||||
|---|---|---|---|---|---|---|---|---|---|---|---|---|---|---|---|---|---|
| Tycho-2 ID. | |||||||||||||||||
| HD/GSC ID. | |||||||||||||||||
| – | – | 1671.0 | 04:31:3.24 | 8. | 61T | 1. | 59T | 0. | 26 | – | – | 1.7 | 1.2 | K7 V | |||
| TYC 2892-803-1 | -636.3 | 43:45:55.0 | 1. | 40C | 0. | 19 | -6.1 | 1.2 | |||||||||
| HD 276387 | 1. | 94C | 0. | 33 | 41.4 | 1.0 | |||||||||||
| – | J0431376+434944 | 876.0 | 04:31:37.6 | 8. | 69T | 0. | 23T | 0. | 33 | 8. | 06 | 0. | 15 | 1.6 | 1.0 | B8 V p | |
| TYC 2892-510-1 | -134.4 | 43:49:44.6 | -0. | 06C | 0. | 24 | -2.5 | 1.1 | |||||||||
| HD 28502 | 0. | 30C | 0. | 56 | -21.0 | 3.0 | |||||||||||
| – | J0432225+434316 | -175.9 | 04:32:22.5 | 9. | 33T | 0. | 20T | 0. | 33 | 8. | 71 | -0. | 02 | 3.5 | 1.0 | B6 V | |
| TYC 2892-1450-1 | -957.8 | 43:43:16.7 | -0. | 18C | 0. | 25 | -4.3 | 1.0 | |||||||||
| HD 276481 | 0. | 32H | 0. | 46 | -16.0 | 3.0 | |||||||||||
| 1 | J0432173+435049 | -45.9 | 04:32:17.3 | 10. | 77 | 2. | 01 | – | 6. | 75 | 1. | 22 | – | M3-7 V | |||
| TYC 2892-1209-1 | 14.1 | 43:50:49.2 | 2. | 52 | – | – | |||||||||||
| GSC 02892-01209 | 2. | 47 | – | -26.4 | 1.6 | ||||||||||||
| 2 | J0432433+434847 | -654.1 | 04:32:43.3 | 10. | 80 | 0. | 33 | 0. | 35 | 10. | 02 | 0. | 17 | 0.6 | 1.4 | A0 V * | |
| TYC 2892-354-1 | -241.6 | 43:48:47.7 | 0. | 32 | 0. | 34 | -5.3 | 1.4 | |||||||||
| HD 276479 | 0. | 46 | 0. | 47 | 7.5 | 2.2 | |||||||||||
| – | 0432381+433716 | -545.4 | 04:32:38.1 | 10. | 81T | 0. | 22T | 0. | 34 | 10. | 23 | 0. | 06 | -2.7 | 1.4 | B7 V | |
| TYC 2892-1756-1 | -1729.7 | 43:37:16.0 | -0. | 12C | 0. | 25 | -3.0 | 1.3 | |||||||||
| GSC 02892-01756 | 0. | 30C | 0. | 42 | 4.9 | 1.0 | |||||||||||
| 3 | J0432269+434845 | -270.2 | 04:32:26.9 | 11. | 09 | 0. | 31 | 0. | 38 | 10. | 39 | 0. | 19 | 0.8 | 1.5 | B9 V p | |
| TYC 2892-1365-1 | -249.8 | 43:48:45.5 | 0. | 10 | 0. | 30 | -6.0 | 1.5 | |||||||||
| GSC 02892-01365 | 0. | 39 | 0. | 45 | 4.2 | 2.1 | |||||||||||
| 4 | J0432205+434906 | -121.1 | 04:32:20.5 | 11. | 22 | 0. | 29 | 0. | 40 | 10. | 59 | 0. | 11 | 2.7 | 1.5 | B8 V | |
| TYC 2892-1195-1 | -206.0 | 43:49:06.5 | 0. | 06 | 0. | 40 | 0.8 | 1.4 | |||||||||
| GSC 02892-01195 | 0. | 35 | 0. | 45 | -37.0 | 3.0 | |||||||||||
| – | 0431398+435319 | 830.6 | 04:31:39.8 | 11. | 35T | 0. | 37T | 0. | 47 | 10. | 76 | 0. | 21 | -3.0 | 1.6 | B8 V * | |
| TYC 2892-1801-1 | 328.0 | 43:53:19.4 | 0. | 05C | 0. | 35 | -0.1 | 1.6 | |||||||||
| GSC 02892-01801 | 0. | 49C | 0. | 59 | -25.0 | 10.0 | |||||||||||
| – | 0431025+434321 | 1684.0 | 04:31:02.5 | 11. | 43T | 0. | 37T | 0. | 32 | 10. | 89 | 0. | 13 | -2.2 | 1.8 | A2 V | |
| TYC 2892-1171-1 | -967.2 | 43:43:21.2 | 0. | 28C | 0. | 23 | -1.8 | 1.8 | |||||||||
| – | 0. | 45C | 0. | 39 | -21.0 | 5.0 | |||||||||||
| 5 | J0432023+435228 | 306.1 | 04:32:02.3 | 11. | 53 | 0. | 41 | 0. | 35 | 10. | 71 | 0. | 22 | -1.7 | 2.0 | – | |
| TYC 2892-225-1 | 223.0 | 43:52:28.1 | 0. | 36 | 0. | 26 | -15.2 | 1.9 | |||||||||
| – | 0. | 49 | – | – | |||||||||||||
| 6 | J0432288+435210 | -309.4 | 04:32:28.8 | 11. | 93 | 0. | 71 | – | 10. | 62 | 0. | 44 | – | – | |||
| – | 190.4 | 43:52:10.2 | 0. | 31 | – | – | |||||||||||
| – | 0. | 80 | – | – | |||||||||||||
| 7 | J0432183+435149 | -66.2 | 04:32:18.3 | 12. | 00 | 0. | 45 | 0. | 35 | 11. | 11 | 0. | 22 | -5.8 | 1.9 | – | |
| TYC 2892-1159-1 | 143.8 | 43:51:49.6 | 0. | 35 | 0. | 26 | 1.0 | 1.8 | |||||||||
| – | 0. | 51 | – | – | |||||||||||||
Notes:
-
•
Letters , and indicate data obtained from Tycho-2, Hipparcos catalog or computed according to the spectral classification (see text) respectively.
-
•
Proper motion and radial velocity values are expressed in mas/yr and km/s respectively.
-
•
Spectral classification () was obtained from Asiago observations. Asterisks indicate probable binary stars.
-
•
Membership (Memb.) is assigned as described in Sect. 3.4.

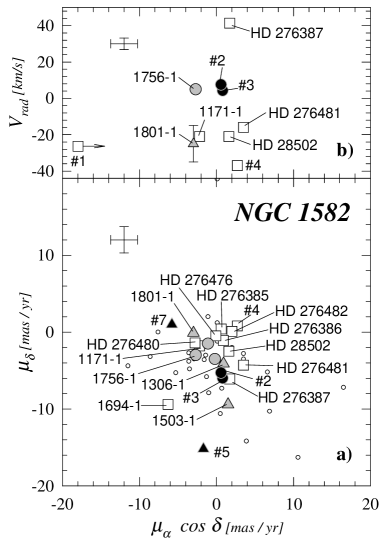
3.2 Proper motions and radial velocities
Important information on the kinematics of the brightest stars in and around
NGC 1582 field can be derived from the study of proper motions and radial
velocities. The former are available in the Tycho-2 catalog and in the HD
Extension Charts (Nesterov et al. 1995) whereas the latter were measured for 10
stars (see Sect. 2.2).
The Tycho-2 proper motions are based on the comparison between contemporary mean
positions derived from the recent Tycho observations on-board Hipparcos and
early-epoch positions observed many decades ago (see Høg et al. 2000 and
references therein). Due to the long time-baseline they have rather high
precision and therefore directly indicate the long-term mean tangential motions
of the stars. We have collected proper motion components for 53 stars in a field
around the center of NGC 1582. They are shown in the vector point
diagram in Fig. 4a. The points distribution is characterized by a global spread
mas/yr with a noticeable concentration, which seems to indicate a
possible physical relation among these stars.
Spectra obtained with the Echelle spectrograph allow us to get radial velocity,
as described in Sect. 2.2. The obtained values are shown in Fig. 4b, and
range from -40 to +40 km/s.
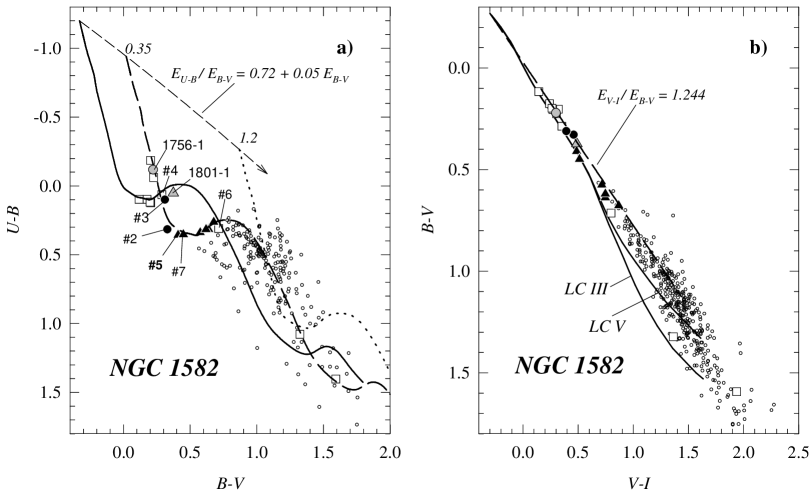
3.3 Photometric diagrams
The color-color diagrams (CCDs) and the color-magnitude diagrams (CMDs) are
shown in Figs. 6, 7 and 8. The first two figures include all the stars measured
in the direction of NGC 1582 and also several bright stars with available
spectral classification and Hipparcos (ESA 1997) or Tycho-2 magnitudes whithin
from the cluster center and not covered by our photometry. Tycho-2
magnitudes are converted to the Johnson system using the relations given by
Bessell (2000) and approximated and colors are obtained
according to the spectral types (when they are available) together with
Schmidt-Kaler (1982) and Cousins (1978a,b) calibrations. Fig. 8 presents the CMDs
from 2MASS catalog for stars placed inside the cluster radius (,
see Sect. 3.1) and for star placed in a ring around the cluster (, see Fig. 3) that is adopted as a comparison field. Radii are
selected in such a way that both diagrams in Fig. 8 cover equal sky areas.
If we inspect Fig. 6a and compare the star positions with Schmidt-Kaler’s (1982)
Zero Age Main Sequence (ZAMS), using different reddening values, there seem to
be two populations: one having a lower excess (dashed curve) mainly defined
by the brightest stars, and another one with a much larger reddening. We claim
that the former define the open cluster NGC 1582, whereas the latter population
is identified as the Galactic disk component, made of stars placed at different
distances and with a different amounts of absorption. To guide the eye we have
placed another ZAMS reddened by (dotted curve). A similar
conclusion can be deduced from Figs. 7 and 8, where we see that most of the
stars observed are just Galactic disk field stars and NGC 1582 looks like a
small group of stars brighter than above the mean stellar
background.
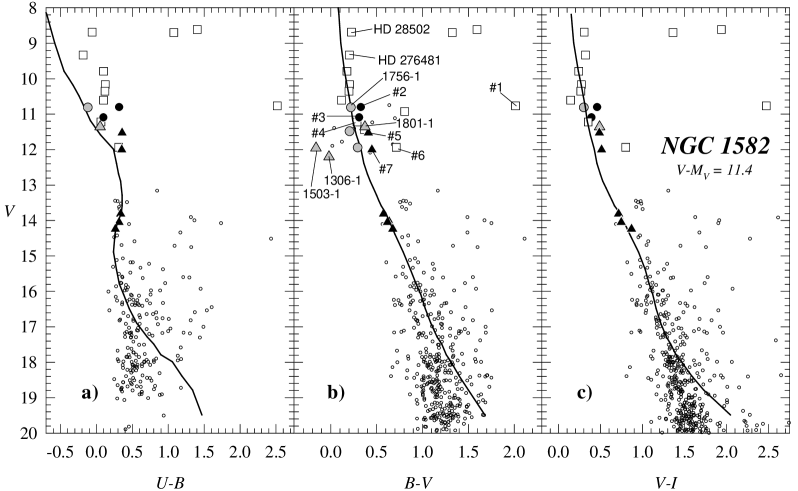
3.4 Members selection
We derive cluster membership by comparing the distribution of the stars in
the different photometric diagrams (e.g. Baume et al. 1999, Ortolani et al.
2002, Carraro 2002b). But we also take into account their location in the
finding chart (Fig. 2), in the vector point diagram and the measured radial
velocities (Fig. 4). At first, we use only Figs. 6 and 7 and we notice that
there are five bright blue stars (#2, 3, 4, 5 and 7) that fit pretty well the
empirical ZAMS shifted by (dashed line). These stars also are
well placed in the vector point diagram, although three of them, stars #4, 5
and 7, slightly depart from the central concentration in this diagram.
Additionally, star #4 has a radial velocity value very different from that of
stars #2 and 3. Therefore, stars #2 and 3 are adopted as cluster members
(), stars #5 and 7 as probable members (), and star #4 is considered to
not belong to the cluster ().
Using stars #2, 3, 5 and 7, we compute colour excess values for each of them
applying the relations and according to Vázquez & Feinstein (1991), this yields a
mean value , here adopted as the cluster color
excess. Beside, following the reddened ZAMS path onto CCDs and CMDs, we select
four additional stars and adopt them as probable cluster members ().
Star #2 is of spectral type A0 V, as derived from its spectrum and from its
position in the CCD. However by comparing its position in the CMDs with respect
to other members, we notice that it appears over-luminous by mag. This
can be explained by assuming it is a binary system. Of course, this is only
a suggestion, which can be confirmed for instance by looking for radial velocity
variations in other-epoch spectra.
Therefore we keep it on the adopted members list. On the other hand, star #6 is
well placed on the CCDs (see Fig 6) as a F-type star, but its position in the
CMDs (see Fig. 7) contradicts this hypothesis and it is therefore considered a
non-member ().
At this point, we are ready to use Fig. 8 as well. In this figure we superimpose
to the data an empirical Main Sequence (MS) obtained by the combination of the
Schmidt-Kaler (1982) and Koornneef (1983) calibrations shifted according to the
relation among colors obtained from the van de Hulst extinction curve #15
(Johnson 1968). By closely inspecting this figure, we notice that there are some
stars not covered by our survey, but within the cluster radius, which are
properly located both in the CMD (Fig. 8a) and in the proper motion diagram of
Fig. 4a (grey symbols in those figures), and one of them (TYC 2892-1756-1) also
has a radial velocity value compatible with those of adopted member stars #2
and 3 (see Fig. 4b). This group of stars has a counterpart in the corresponding
comparison field (Fig. 8b). We compute then the distributions for stars with
(see Table 4) in each diagram and we compare them by using a
test. We find that they are different with a probability higher than 95 %.
Therefore, although we are aware that we are dealing with small numbers of
stars and that a statistical analysis is therefore only indicative, the difference
between both distributions turns out to be noticeable and therefore we are
inclined to consider the group of stars mentioned above as cluster members (). An
exception are stars TYC 2892-1306-1, TYC 2892-1503-1 and TYC 2892-1801-1. The
first two have high errors in their measurements and are situated leftward
of the MS in Fig. 7b, and the third has a radial velocity value with a huge
error and is far from the adopted values for cluster members (see Fig. 4b and
Table 3). We cannot exclude that this might be due to a binary effect. Thus we
consider these three particular stars as only probable members (). On the
other hand, the photometric diagrams also reveal that some stars with available
spectral classification and Tycho-2 data do belong to the field stellar
population; they are therefore taken as non-members ().
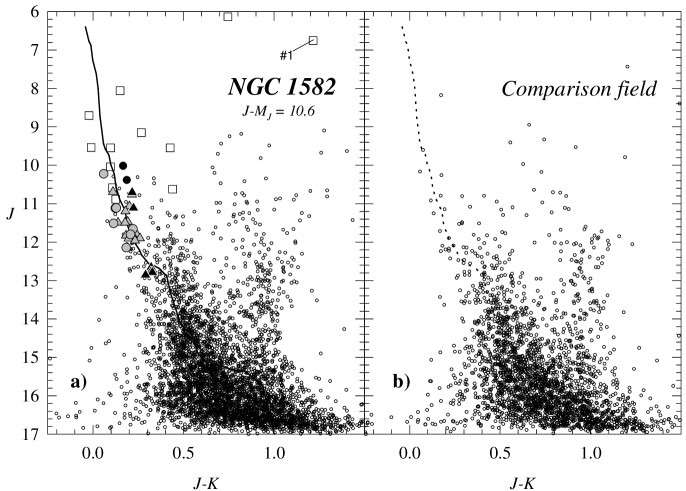
Star #1 (GSC 02892-01209) deserves special attention. It is the brightest
and one of the reddest stars in our sample. Unfortunately, we were not able to
find out either its distance or its proper motion components. This star might
in principle be a giant cluster member. However, from its spectrum we obtained a
radial velocity value that disagrees with the adopted one for adopted cluster
members (see Fig 4b). Also, it is classified as a M-type star and its
parameters (reddening and distance) differ from those of the cluster ones ruling
out the possibility that it is a member star.
In conclusion, after the above detailed analysis of the brightest stars in the
NGC 1582 region, we conclude that the brightest ones are merely field
stars, and we only consider the stars classified as and as the
main members of the open cluster NGC 1582. They are indicated in Fig. 2, and
demonstrate that we are dealing with a sparse, poor and severely
field-star-contaminated open cluster.
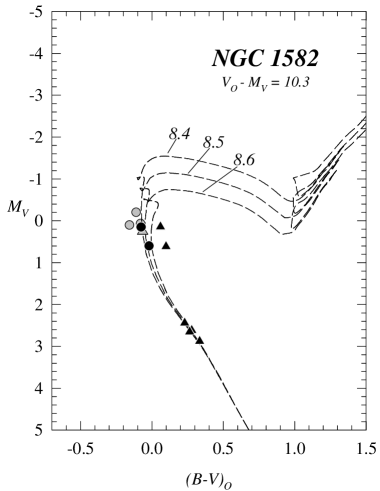
3.5 Hints for distance and age
In Fig. 9 we plot the reddening-corrected vs. diagram
for the cluster members and probable cluster members adopting a distance modulus
of (error from inspection). Last value fits very
nicely the empirical Schmidt-Kaler (1982) ZAMS. We also apply the
spectroscopic parallax method to three classified stars, obtaining
. These values are in quite good agreement and
imply that the few stars identified as NGC 1582 are located pc
away from the Sun in the outer edge of the Orion arm.
From the obtained spectral classification (see Table 3) and from the location
of adopted cluster members stars in Fig. 5a along the shifted ZAMS (dashed
curve), we infer that the spectral types range from B7 to F2. If the stars
having B7 spectral type are still on the main sequence, we derive an age of
about Myr for NGC 1582 (Girardi et al. 2000). A similar result is obtained
by the isochrone fitting method shown in Fig. 9.
| 8-9 | 9-10 | 10-11 | 11-12 | 12-13 | |
|---|---|---|---|---|---|
| 2 | 3 | 16 | 20 | 22 | |
| 1 | 1 | 4 | 7 | 6 |
4 NGC 1663
NGC 1663 (= OCL 461 = C0445+130) is located quite high above the galactic plane
for an open cluster (see Table 1) and does not emerge much from the general
Galactic field toward its direction. According to Lyngå (1987) it has a
diameter of and therefore our observations cover most of the
cluster region (see Fig. 10). Unfortunately, proper motions are available only
for four stars in the region around NGC 1663 (see Table 5),
so we must rely mostly on photometric data to derive cluster members and cluster
fundamental parameters.
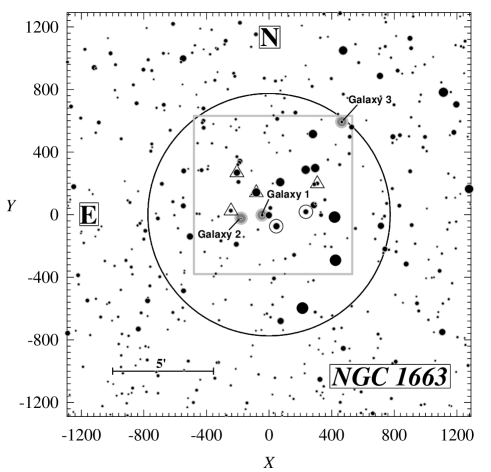
4.1 Stellar counts
NGC 1663 appears as a loose aggregate of a few relatively bright stars. As for
NGC 1582, we perform stellar counts in concentric rings around the cluster
center, but this time, since the cluster does not appear much extended, we only
use the DSS-2 red data. The stellar density profile is shown in Fig. 11. One
can readily see the lack of any clear trend, and therefore it is a difficult
task to define the cluster radius. Anyway, if we inspect the DSS-2 image, the
region where is located the over-density of stars is about radius
(see Fig. 10). In conclusion, it is hard to decide upon the real nature of this
cluster, although, broadly speaking, the over-density we found seems to suggest
that we are looking at an aggregate of the kind suggested by Bica et al. (2001),
namely a POCR. The lack of an unambiguous cluster center, and the loose
distribution of the brightest stars across the field support this suggestion.

| # | 2MASS ID. | Memb. | ||||||||||||
|---|---|---|---|---|---|---|---|---|---|---|---|---|---|---|
| Tycho-2 ID. | ||||||||||||||
| HD/GSC ID. | ||||||||||||||
| 1 | J0449107+130612 | 426.5 | 04:49:10.7 | 10. | 48 | 1. | 20 | 8. | 09 | 0. | 71 | 13.1 | 1.5 | |
| TYC 691-633-1 | -292.5 | 13:06:12.1 | 0. | 98 | -12.4 | 1.5 | ||||||||
| HD 287125 | 1. | 43 | 108.4 | 46.3 | ||||||||||
| – | J0448489+131432 | 1115.0 | 04:48:48.9 | 10. | 47T | 0. | 49T | 9. | 14 | 0. | 38 | 22.2 | 1.4 | – |
| TYC 695-519-1 | 780.6 | 13:14:32.2 | – | -36.8 | 1.4 | |||||||||
| – | – | – | ||||||||||||
| – | J0449174+130349 | 213.6 | 04:49:17.4 | 10. | 68T | 1. | 63T | 7. | 96 | 0. | 92 | 6.6 | 2.3 | – |
| TYC 691-133-1 | -597.8 | 13:03:49.6 | – | -2.5 | 2.3 | |||||||||
| – | – | – | ||||||||||||
| 2 | J0449109+130819 | 419.0 | 04:49:10.9 | 11. | 69 | 1. | 43 | 8. | 98 | 0. | 83 | 3.5 | 3.1 | |
| TYC 695-27-1 | -17.6 | 13:08:19.9 | 1. | 46 | -1.4 | 3.1 | ||||||||
| GSC 00695-00027 | 1. | 62 | – | |||||||||||
| 5 | J0449308+131030 | -205.2 | 04:49:30.8 | 13. | 13 | 1. | 07 | 11. | 06 | 0. | 65 | – | ||
| – | 266.9 | 13:10:30.7 | 0. | 53 | – | |||||||||
| – | 1. | 24 | – | |||||||||||
| 6 | J0449269+130932 | -81.3 | 04:49:26.9 | 13. | 19 | 1. | 21 | 10. | 88 | 0. | 69 | – | ||
| – | 140.3 | 13:09:32.1 | 0. | 85 | – | |||||||||
| – | 1. | 36 | – | |||||||||||
| 7 | J0449227+130752 | 47.4 | 04:49:22.7 | 13. | 25 | 0. | 66 | 11. | 79 | 0. | 39 | – | ||
| – | -74.5 | 13:07:52.2 | 0. | 12 | – | |||||||||
| – | 0. | 88 | – | |||||||||||
| 11 | J0449167+130835 | 235.7 | 04:49:16.7 | 13. | 91 | 0. | 70 | 12. | 44 | 0. | 40 | – | ||
| – | 17.1 | 13:08:35.4 | 0. | 17 | – | |||||||||
| – | 0. | 91 | – | |||||||||||
| 16 | J0449320+130837 | -242.9 | 04:49:32.0 | 14. | 73 | 0. | 94 | 13. | 01 | 0. | 46 | – | ||
| – | 24.1 | 13:08:37.6 | 0. | 50 | – | |||||||||
| – | 1. | 04 | – | |||||||||||
| 18 | J0449144+130959 | 308.6 | 04:49:14.4 | 14. | 91 | 0. | 91 | 13. | 07 | 0. | 52 | – | ||
| – | 197.7 | 13:09:59.5 | 0. | 35 | – | |||||||||
| – | 1. | 11 | – | |||||||||||
Notes:
- Letters indicate data obtained from Tycho-2 catalog.
- Proper motion and parallax values are expressed in mas/yr and mas respectively.
4.2 Photometric diagrams and member selection
| Name | |||||
|---|---|---|---|---|---|
| 2MASS ID | |||||
| Galaxy 1 | 04:49:25.7 | 16.45 | 1.50 | 14.52 | |
| J0449257+1308 | 13:08:25.0 | 1.08 | 13.76 | ||
| 1.75 | 13.49 | ||||
| Galaxy 2 | 04:49:29.9 | 17.38 | 0.98 | 16.33 | |
| J0449299+1308 | 13:08:15.4 | 0.92 | 15.85 | ||
| 1.56 | 14.57 | ||||
| Galaxy 3 | 04:49:09.5 | 16.67 | 1.55 | 14.82 | |
| J0449095+1313 | 13:13:03.0 | 1.09 | 13.99 | ||
| 1.81 | 13.54 |
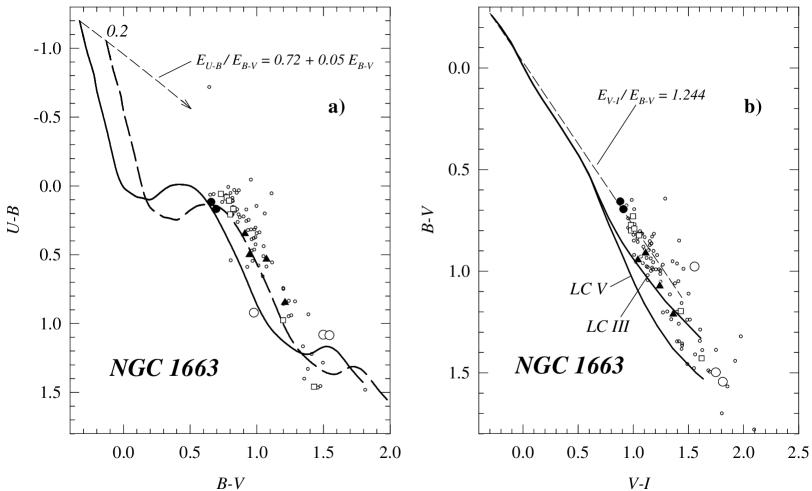
We follow the same method applied above for NGC 1582 to derive preliminary
individual reddening and membership of the cluster. Photometric diagrams are
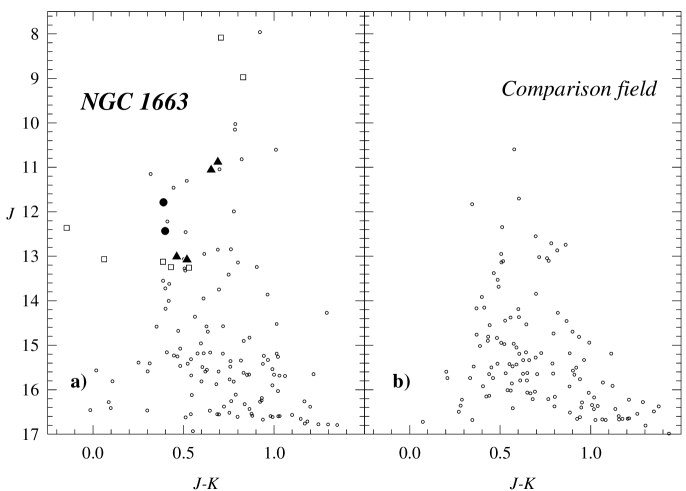
shown in Fig. 12, 13 and 14, where all the observed stars are presented in the
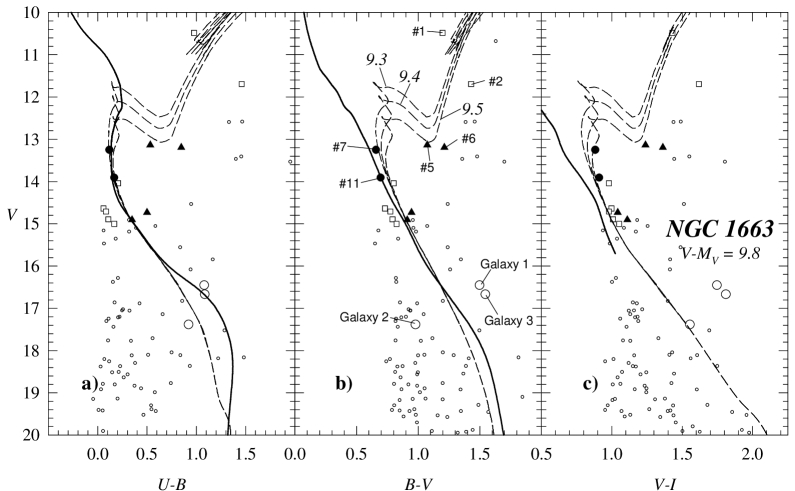
first two, whereas the last one is obtained from 2MASS data. Let us fix our
attention on Fig. 12a: here all the stars seem to crowd along an empirical ZAMS
shifted by . It is however clear that in this case a reddening
solution can not be found, since all the stars lie well beyond the location of
A5 spectral type stars (Ortolani et al. 2002). The low color excess and the
small dispersion in reddening are not unexpected, due to the position of the
cluster high above the Galactic plane and toward the anti-center direction. The
CMDs are not easy to interpret, since most of the stars are just Galactic disk
field stars, as is readily seen by inspecting both panels in Fig. 14. From this
figure it is evident that NGC 1663 emerges as an over-density of a dozen stars
brighter than above the mean stellar background.
In conclusion, only preliminary membership information can be derived from the
CMDs of Figs. 13 and 14. We therefore try to fit the distribution of the stars
with both the empirical Schmidt-Kaler (1982) ZAMS and with several isochrones
from Girardi et al. (2000) by conservatively assuming that the metal content is
solar. A possible relationship might exist between some MS stars and the
brightest star (star #1). This is the star HD 287125 with spectral
type G5 and it could be a giant cluster member, but its parallax value (see
Table 5) definitely rules out this possibility, and we are left with a nearby
foreground star. The shape of the upper part of the CMDs seems to suggest that
the turn-off point (TO) is located at about , , and that
the stars rightwards of the TO are sub-giant stars. On this basis we will
consider two stars as cluster members (), four more as probable
ones () and a few bright ones were identified as non-members ().
Fig. 13 shows the CMDs corresponding to the cluster area, and to a ring around
it adopted as a comparison field (see Fig. 11). As in Fig 9 for NGC 1582, radii
were selected in such a way that both diagrams in Fig. 14 represent equal sky
areas. By comparing both diagrams we can see a notable over-density of bright
stars in the cluster region, which would favor the idea that NGC 1663 is a
physical cluster.
4.3 Hints for NGC 1663 distance and age
As discussed in the previous section, Fig. 13 allows us to derive a rough
estimate of the distance and the age of NGC 1663. These diagrams yield a
cluster distance of about pc () and an age of
about Myr (). We also tried other combinations of
distance moduli and color excesses over the CMDs, in order to check whether the
reddest stars could be cluster members, but the obtained solutions did not
agree at all with the corresponding CCDs of Fig. 12.
In conclusion, if NGC 1663 really is a star cluster, we may be facing a
dissolving aggregate of the kind proposed by Bica et al. (2001).
5 Field galaxies
Since NGC 1663 is located well above the Galactic plane, it is not very
improbable that we should observe field galaxies toward its direction. In our
case three of them are clearly detectable and we notice that they were not
catalogued so far, except for entries in the 2MASS catalog as point sources.
Therefore, we compute their integrated photometric parameters by performing
aperture photometry. We use the PHOT task at increasing radius until the
resulting magnitudes converged. Our results are presented in the photometric
diagrams and in Table 6 together with an estimate of their angular sizes and a
preliminary morphological classification that - by the way - agrees quite well
with the observed colors.
6 Conclusions
We have presented the first CCD multicolor study in the regions of the two poorly known northern open clusters NGC 1582 and NGC 1663 for which no investigations had been carried out insofar. In the case of NGC 1582 we also obtained Echelle spectra of the brightest stars. In detail, we found that:
-
•
NGC 1582 is a very poor and spread-out cluster with a radius of 15′ and formed by a group of stars at a distance of about 1 kpc in the outer edge of the Orion arm. We estimate that its reddening is and that it has an age of about Myr. We also obtained radial velocities for 10 stars and detected two probable binary systems among its members.
-
•
NGC 1663 has a lower reddening of but, until more robust definition of its membership is available, the interpretation of the CMDs is quite difficult. We only derive a preliminary membership assignment and we suggest this object has an age of Myr and a distance value of about pc. The most probable interpretation of the data at our disposal is that NGC 1663 is an open cluster remnant.
Finally, we identify three previously unclassified field galaxies in the
direction of NGC 1663. We provide their integrated magnitudes and colors,
angular sizes and preliminary morphological types. Two of them are found to be
ellipticals and the third is either a flattened S0 or a spiral one.
This article is partially based on the Second Generation Digitized Sky Survey that was produced at the Space Telescope Science Institute under US government grant NAG W-2166. The images of these surveys are based on photographic data obtained using the Oschin Telescope on Palomar Mountain and the UK Schmidt Telescope. The plates were processed into the present compressed digital form with the permission of these institutions. This study has also made use of: a) the SIMBAD database, operated at CDS, Strasbourg, France, and b) the data from the Two Micron All Sky Survey, which is a joint project of the University of Massachusetts and the Infrared Processing and Analysis Center, funded by NASA and NSF
Acknowledgements.
The authors acknowledge the Asiago Observatory staff for the technical assistance. Fruitful discussion with Roberto Barbon, Ruggero Stagni, Corrado Boeche and Silvano Desidera are also warmly acknowledged. We thank the anonymous referee for the detailed report which helped to significantly improve the paper presentation. The work of GB is supported by Padova University through a postdoctoral grant.References
- (1) Baume G., Vázquez R.A. & Feinstein A. 1999, A&AS 137, 233
- (2) Bessel M.S. 2000, PASP 112, 961
- (3) Bica E., Santiago B.X., Dutra C.M., et al. 2001, A&A 366, 827
- (4) Carraro G. 2002a, A&A 387, 479
- (5) Carraro G. 2002b, MNRAS 331, 785
- (6) Cousins A.W.J. 1978a, MNSSA 37, 62
- (7) Cousins A.W.J. 1978b, MNSSA 37, 77
- (8) Desidera S., Fantinel D., & Giro E. 2002, AFOSC USER MANUAL
- (9) Dias W.S., Alessi B.S., Moitinho A., et al 2002, A&A 389, 871
- (10) ESA 1997, The Hipparcos and Tycho Catalogs, ESA SP-1200
- (11) Girardi L., Bressan A., Bertelli G., & Chiosi, C. 2000, A&AS 141, 371
- (12) Johnson H.L. 1968, In Nebulae and Interstellar matter. Middlehursst B.M & Aller L. (eds.). Univ. of Chicago Press, p. 167
- (13) Høg E., Fabricius C., Makarov V.V. et al. 2000, A&A 357, 367
- (14) Jaschek C., Jaschek M., 1987, The classification of stars, Cambridge University Press
- (15) Koornneef J. 1983, A&A 128, 84
- (16) Landolt A.U. 1992, AJ 104, 340
- (17) Lyngå G. 1987, Catalog of Open Star Cluster Data, Strasbourg, CDS
- (18) Montes D., Martin E.L., Fernandez-Figueroa M.J., et al. 1997, A&AS 123, 473
- (19) Montes D., Ramsey L.W., & Welty A.D., 1999, ApJS 123, 283
- (20) Munari U. & Zwitter T., 1994, Padova and Asiago Obs. Tech. Rep. 4
- (21) Nesterov V.V, Kuzmin A.V, Ashimbaeva N.T. Volchkov A.A. Roeser S & Bastian U. 1995, A&AS 110, 367
- (22) Ortolani S., Carraro G., Covino S., et al. 2002, A&A 391, 179
- (23) Patat F., Carraro G. 2001, MNRAS 325, 1591
- (24) Schmidt-Kaler Th. 1982, Landolt-Börnstein, Numerical data and Functional Relationships in Science and Technology, New Series, Group VI, Vol. 2(b), K. Schaifers and H.H. Voigt Eds., Springer Verlag, Berlin, p.14
- (25) Stetson P.B. 1987, PASP 99, 191
- (26) Vázquez R.A. & Feinstein A. 1991, A&AS 90, 317