The relationship between the optical H filaments and the X-ray emission in the core of the Perseus cluster
Abstract
NGC 1275 in the centre of the Perseus cluster of galaxies, Abell 426, is surrounded by a spectacular filamentary H nebula. Deep Chandra X-ray imaging has revealed that the brighter outer filaments are also detected in soft X-rays. This can be due to conduction and mixing of the cold gas in the filaments with the hot, dense intracluster medium. We show the correspondence of the filaments in both wavebands and draw attention to the relationship of two prominent curved NW filaments to an outer, buoyant radio bubble seen as a hole in the X-ray image. There is a strong resemblance in the shape of the hole and the disposition of the filaments to the behaviour of a large air bubble rising in water. If this is a correct analogy, then the flow is laminar and the intracluster gas around this radio source is not turbulent. We obtain a limit on the viscosity of this gas.
1 Introduction
The giant galaxy NGC 1275 at the centre of the Perseus cluster has long been known to be surrounded by a large H nebulosity (Minkowski 1957; Lynds 1970). The blobs and filaments of the nebulosity are embedded in dense hot intracluster medium and have low ionization. Neither the origin of the filaments or the source of ionization is clear, despite many studies (Kent & Sargent 1979; Cowie et al 1983; Johnstone et al 1988; Heckman et al 1989; McNamara, O’Connell & Sarazin 1996; Sabra et al 2002). They may have formed by cooling of the intracluster medium (Fabian 1994).
Recent deep H obtained with the WIYN telescope 111The WIYN Observatory is a joint facility of the University of Wisconsin-Madison, Indiana University, Yale University, and the National Optical Astronomy Observatory. (Conselice et al 2001) and X-ray images (Fabian et al 2000; 2003) on arcsec resolution have now been carried out. Here we compare features in both wavebands to see what is common to both and whether it helps understand the origin of the nebulosity. Some corresponding features around the radio source have been seen in A2597 (Koekemoer et al 1999), A2052 (Blanton et al 2003) and as an 80 kpc long trail in A1795 (Fabian et al 2000).
Large H and Ly nebulosities (the NGC 1275 nebulosity is also seen in Ly; Fabian et al 1984) are often found around powerful radio sources over a wide range of redshifts (McCarthy 1993; Reuland et al 2003) and are often considered to be the aftermath of merger events, although the evidence is not conclusive. Fabian et al (1985) noted that they are seen in many central galaxies in cooling flow clusters and do not there correlate in luminosity with present radio luminosity (see e.g. Crawford et al 1995). NGC 1275 has both a moderately powerful radio source (Pedlar et al 1990) and a strong cooling flow.
The redshift of NGC 1275 is 0.0183, which means that 1 kpc corresponds to about 2.7 arcsec (using ).
2 The H and X-ray images
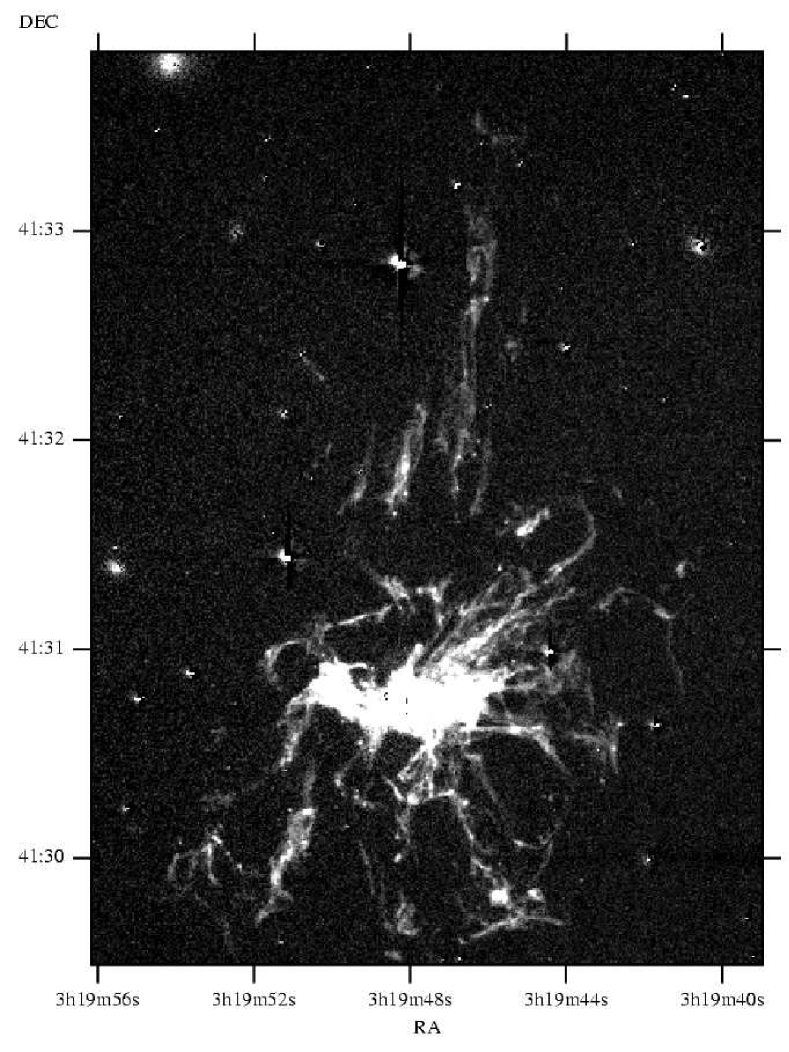
The H image is shown in Fig. 1 (Conselice et al 2001). The total extent is about 4 arcmin or 80 kpc. There is no significant filamentary emission beyond that shown in the rest of that image or in one taken to the south.
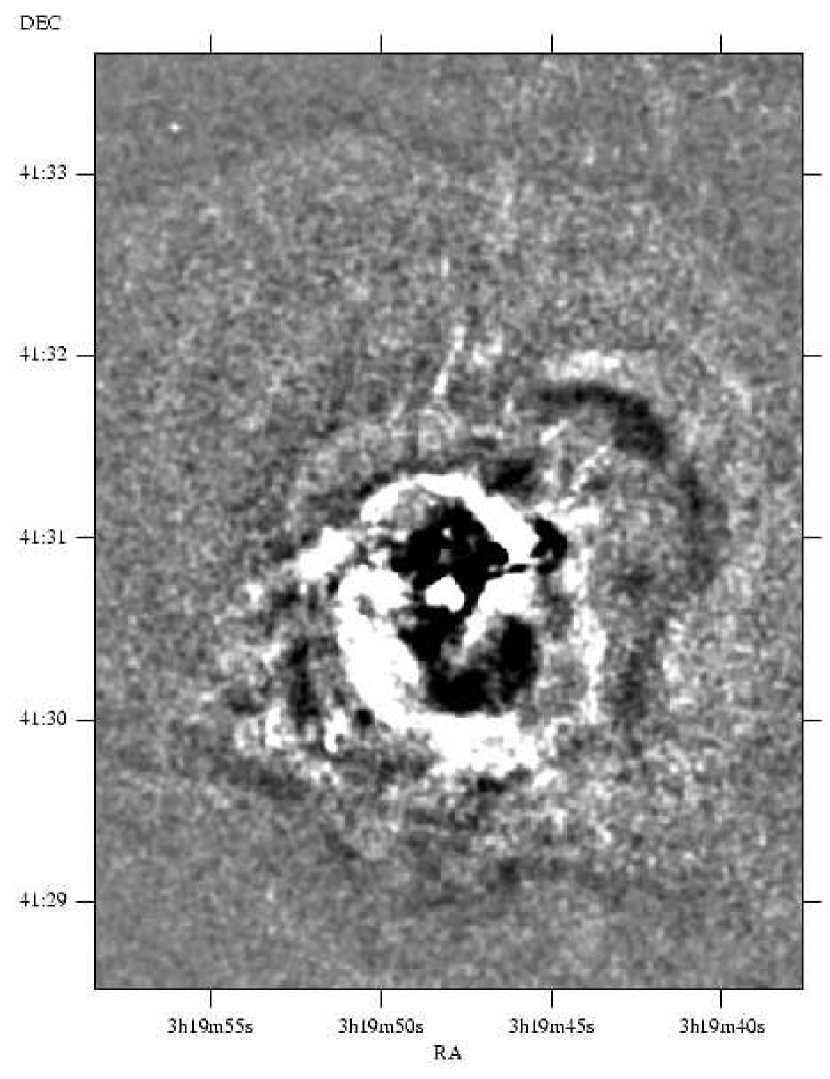
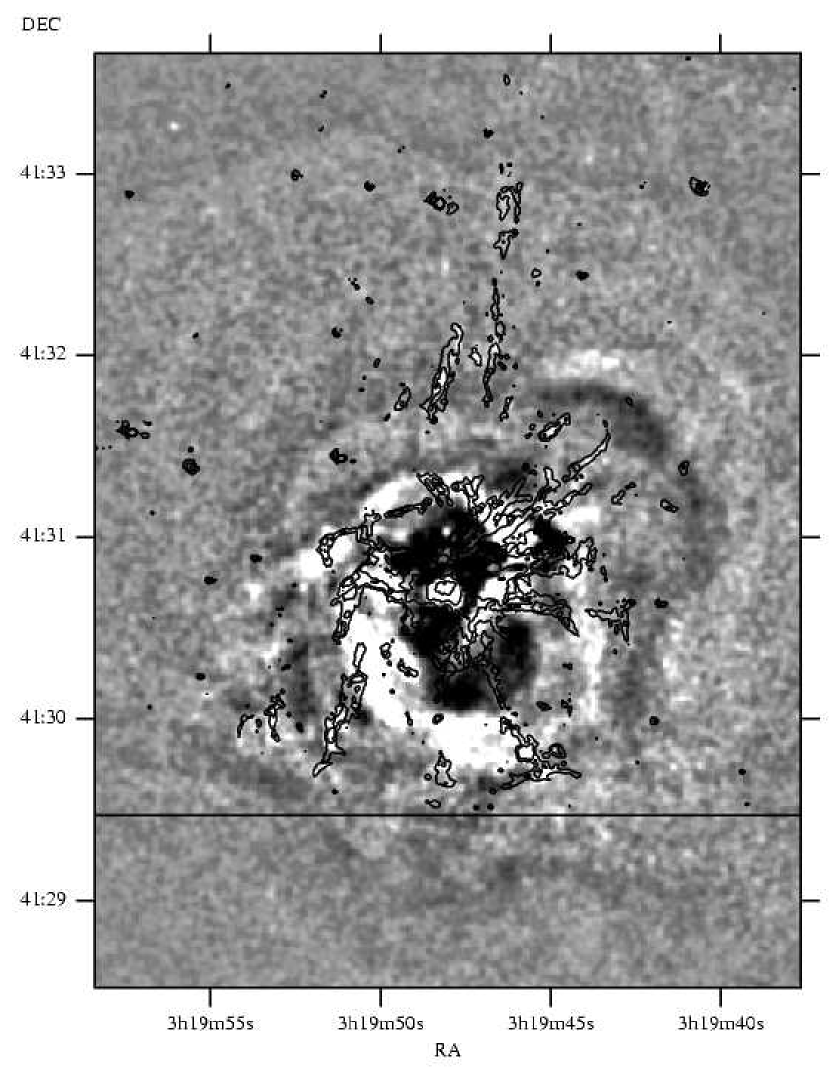
Filamentary structures are clearly seen in the soft X-ray image (Fabian et al 2003) but are difficult to present simply due to the large dynamic range of the underlying X-ray emission. We have therefore used an unsharp-mask technique to bring them out (Fig. 2a). The image is accompanied by one on which contours of the H nebulosity have been overlaid (Fig. 2b). This enables filamentary features to be compared by inspection. The main X-ray structures in Fig. 2 (left) are the bright rims around the inner radio source, which appear as the N and S radio holes (dark) coinciding with the radio lobes (Fabian et al 2000, 2003).
Obvious correspondence between H and soft X-ray features is seen to the north, where 3 major strands of H emission are seen beginning about 1 arcmin to the N (RA 3 19 48.5, Dec 41 31 45) of the nucleus. A 0.5 arcmin N-S stretch of the middle strand is most obvious. A very faint structure is tentatively seen extending further to the N in the X-ray image, bending to the W then S at the top.
At p.a. 140 deg and also beyond about 1 arcmin from the nucleus, other H filaments (3 19 51.4, 41 29 56) overlap patches of bright soft X-ray emission. This is the ‘blue loop’ of Sandage (1972) where young stars may be forming away from the body of the galaxy (Conselice et al 2001). At about 200 deg a radial filament extends from over 0.5–1.2 arcmin with some X-ray emission seen across the southern radio hole and also at its outer, tangentially-oriented, end (3 19 45.4, 41, 29 45).
At p.a. 300 deg lies an H filament which bends back on itself (3 19 43.7, 41 31 27; called the ‘horseshoe’ by Conselice et al 2001). This feature is seen well in the soft X-ray image. Its projected location lies just inside the outer, buoyant radio bubble and is discussed further in the next section.
A careful inspection of the images reveals that most of the brighter H filaments, with intensity greater than about arcsec-2 (Table 1 in Conselice et al 2001), at radii of 30 arcsec or more, show very similar structures in soft X-rays (e.g. the horseshoe, Fig. 2. It is therefore possible that all the outer H filaments will have a soft X-ray counterpart in even deeper X-ray images. The X-ray surface brightness of the detected filaments is at the limit of sensitivity for fine structures in the deep Chandra image. It is also in agreement with that expected if a few 100 pc of gas along the line of sight is replaced by gas at gas at the same pressure. (We have fitted a thermal plasma model to the X-ray spectrum of the northern filament and obtain a gas temperature of about .)
At smaller radii the X-ray emission is strongly affected by the ‘holes’ coinciding with the radio lobes. A fine straight optical filament about 30 arcsec S of the nucleus is seen in X-rays but little else corresponds well. Note that the gas associated with the high-velocity system in the foreground of the Per A nucleus (redshifted by ; see discussion by Conselice et al 2001) causes soft X-ray absorption in the region extending to about 20 arcsec to the NE of the nucleus (Fabian et al 2000).
Projection effects mean that we cannot be precise about the physical arrangement of the filaments. It is possible that most avoid the radio lobes themselves, and the outer filaments appear to avoid the broad, probably weakly-shocked, thick X-ray rim to the lobes. This thick rim, with outer radius 1 arcmin, extends beyond the thinner, bright, soft X-ray rim. This is different from the behaviour of the filaments in A2597 (Koekemoer et al 1999) and A2052 (Blanton et al 2003) where the filaments appear to surround the radio lobes more closely.
To assess the intensity of the soft X-ray emission from the filaments we have examined the prominent filaments about one arcmin N of the nucleus. The X-ray surface brightness there is on average about ct arcsec which for a plasma at corresponds to an intensity of arcsec This is region 18 in Conselice et al (2001), where they find an H intensity of arcsec-2. Since recombination implies that the Ly intensity is about 20 times larger still (see e.g. Donahue & Voit 1991), the filaments predominantly radiate in the UV/optical, with the X-ray emission being an energetically minor component.
3 The horseshoe
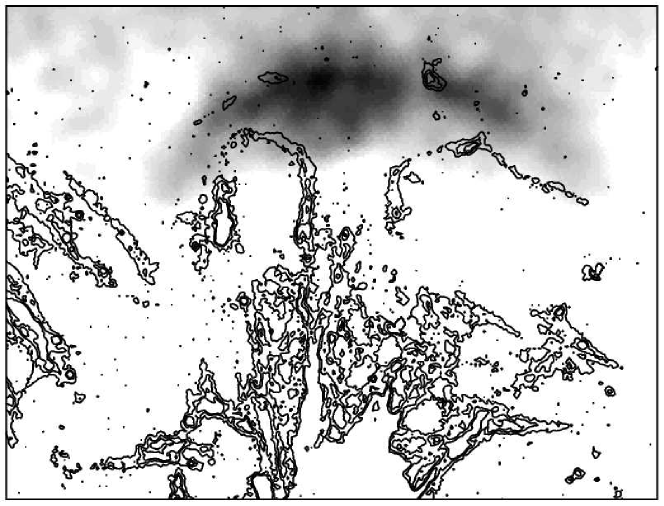
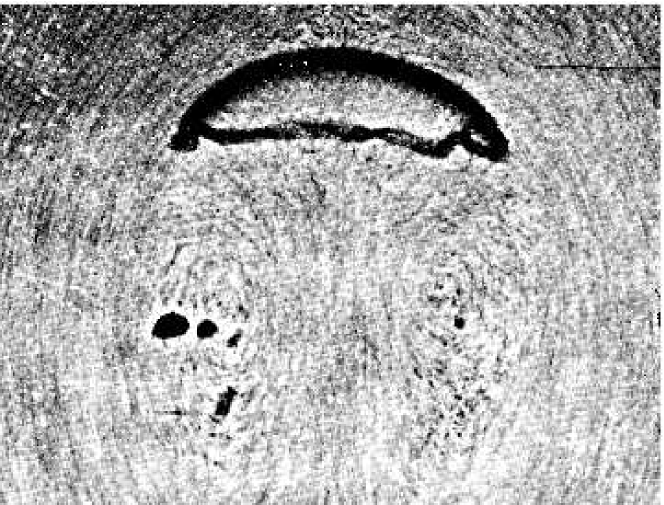
We now consider the horseshoe-shaped filament at p.a. 300 deg. The interesting aspect here is that it turns back just before the outer buoyant bubble (Fig. 3a). The situation strongly resembles that seen when a large air bubble rises in water (Fig. 3b; Bachelor 1967). The bubble becomes a spherical cap trailing a toroidal flow pattern. The Perseus bubble is cap-shaped and the H filaments could be revealing the flow pattern. In particular the filaments bend in opposite directions either side of the centre of the bubble, as expected. They represent natural streamlines tracing the flow in the gas. If the filaments are not in the plane of the Sky then doppler shifts could provide spectroscopic confirmation of the flow pattern.
From the intensity of the H emission, we estimate that the emission region, if at and in pressure equilibrium with the hot gas, is less than 0.1 pc thick. This means that the volume filling fraction is very small; if part of a filament is represented by a cube of side one arcsec, or 300 pc, then the filling fraction is less than . Consequently, and despite the large density contrast, the filaments will be blown about by the hot gas and serve as good tracers of its flow on kpc scales or more.
This interpretation means that the rising bubble is drawing up H gas behind it. The projected temperature structure of the hot intracluster gas is fairly smooth in the region so providing no further information. The dragging up of colder, inner gas has previously been discussed within the context of the inner hot intracluster gas around the radio source in the Virgo cluster around M87 (Böhringer et al 1995; Churazov et al 2001). In the Perseus cluster we appear to have a dramatic demonstration of the flow pattern.
The flow appears to be laminar, indicating that the effective Reynolds number, , where and are the velocity, cap radius and viscosity respectively, is less than about 1000. (See Van Dyke 1982 for a photograph of a turbulent wake, from Wegener & Parlange 1973 where spherical-cap bubbles are reviewed.) This yields a lower limit on the viscosity of the intracluster medium of or assuming for (Fabian et al 2002) and 20 kpc for . The ion viscosity from the formula of Spitzer (1962) and Braginskii (1958) .
The inclusion of magnetic fields makes the viscosity anisotropic. If the net effect is to reduce it then the above argument means that the factor cannot be more than ten. Faraday rotation measure maps of cluster cores indicate magnetic field coherence lengths of 5–10 kpc (Carilli & Taylor 2002). Faraday rotation is so strong in the Perseus core that the radio source is completely depolarized (Pedlar et al 1990). If this is due to strong, and dynamically dominant, magnetic fields in the innermost intracluster medium, then these will surely influence the effective viscosity and the flow.
Numerical simulations of the intracluster medium will need to ensure that the gas has an effective viscosity at this level (the simulations of e.g. Reynolds et al 2002 show turbulence) and to confirm that the flow is indeed laminar. Viscosity can have an important effect in dissipating the sound energy produced by the formation of the bubbles (Fabian et al 2003; see references therein for a discussion of the heating of the intracluster medium by a central active nucleus).
4 Discussion
The brighter H filaments are detected in soft X-rays. The X-ray emission could be due to thermal conduction making the intracluster gas adjacent to the filaments cooler, i.e. to conductive condensation onto the filament, or to conductive evaporation of the filament. This problem has been studied by Böhringer & Fabian (1989) for the case of a spherical cloud embedded in a medium similar to that of the Perseus cluster (see also Sparks, Macchetto & Golombek 1989).
The results there (Table 2; Böhringer & Fabian 1989) indicate that the temperature drops around a cloud out to , where is a factor, assumed constant, by which conduction is suppressed below the Spitzer (1957) value. Since they are observed to be only 1–2 arcsec across, and . An isolated H-emitting cloud can only be 10 pc or less in radius. This would however be undetectable and a filament is presumably a low filling-factor chain of small clouds. We assume that the magnetic-field structure of the clouds is responsible for the required suppression of conduction and helps give a cloud its coherence.
The timescale for attaining a complete equilibrium conductive boundary layer is measured in Gyr (Böhringer & Fabian 1989), which is much longer than the likely age of the observed filaments (a few from the flow time). The observed clouds will therefore be in the early evaporative phase, slowly losing gas to the surrounding intracluster medium. The mismatch in timescales is so large that we do not expect that the precise geometry of the clouds will affect this conclusion. If there is a large relative velocity between the filaments and the surrounding gas then forced mixing may be taking place. The immediate surroundings of a filament is X-ray bright because the gas is cooled (and thus denser) there by conduction or mixing with the cold gas.
Being only a minor component energetically, the soft X-rays cannot be the source of ionization of the filaments. (The short cooling time of the H emitting gas means that they must be continuously ionized.) A conductive interface does not help either (Böhringer & Fabian 1989). The formation of massive stars within filaments (such as are seen in the region of the blue loop) would potentially provide sources of photoionization, and is a possibility which can be observationally tested.
The northern H filaments stop at the weak shock front discovered in the deep Chandra image (Fabian et al 2003). Also the H emission seems weaker in Fig. 1 around the inner bubble rims (e.g. to the SE). This could be the result of strong heating or disruption in the shocked gas. It further supports the weak shock interpretation of Fabian et al (2003) for the outer front seen in the X-ray image.
The long, outer H filaments to the N could result from being drawn out by an older outer bubble, which is no longer detectable as a hole in X-rays. This explains why it is so radial. Its age, from the flow time, would be at least . If correct, it would increase the viscosity limit in Section 3 by a factor of a few. It would also remove any concern that the flow has not yet reached equilibrium (the outer bubble is about one eddy length from the centre). The straightness of this and other filaments further testifies against the hot medium being turbulent. The level of turbulent, or other, motions in the hot gas will be measured by the bolometer on ASTRO-E2, when it is launched. No obvious filaments go to the south, where there is another, less well-defined, outer bubble (Fabian et al 2001, 2003). The process presumably depends on the quantity of cold gas available for being drawn out.
A strong possibility emerges therefore that all the filaments are due to buoyant radio bubbles drawing out cold gas from a central reservoir. The outflow of the radio source is responsible (Conselice et al 2001). The filaments cover such a large range of cooling time within the hot gas (to more than 1 Gyr) that it is unlikely that they originate in situ by cooling from that gas. Where the cold gas reservoir comes from is uncertain. It may accumulate from residual cooling of the intracluster medium at the centre or from mergers. A detailed spectroscopic comparison of abundances in the filaments and intracluster gas (as suggested by Conselice et al 2001) could be decisive.
The action of radio bubbles drawing out cold dusty filaments to large radii along the radio axis could contribute to the alignment effect seen in distant radio galaxies (McCarthy 1993).
Acknowledgements
We thank the referee, Sebastian Heinz, for helpful comments. ACF and CSC thank the Royal Society for support. CJC acknowledges support from an NSF Astronomy and Astrophysics Fellowship. JSG, and RFGW thank the US National Science Foundation for partial support of this work through grants AST98-03018, and AST98-04706.
References
- [1] Batchelor G.K., An introduction to fluid dynamics, CUP, 1967
- [2] Blanton E.L., Sarazin C.L., McNamara B.R., Wise M.W., 2001, ApJ, 558, L15
- [3] Begelman M.C., 2002, in Gas & Galaxy Evolution, ASP Conference Series Vol. 240, J.E. Hibbard, M.P. Rupen and J.H. van Gorkom, eds. (San Francisco: Astron. Soc. Pacific, 2001), 363
- [4] Böhringer H., Fabian A.C., 1989, MNRAS, 237, 1147
- [5] Böhringer H., Nulsen P.E.J., Braun R., Fabian A.C., 1995, MNRAS, 274, L67
- [6] Braginskii S.L., 1958, Sov. Phys., JETP, 6, 358
- [7] Carilli C.L., Taylor G.B., 2002, ARAA, 40, 319
- [8] Churazov E., Forman W., Jones C., Böhringer H., 2000, A&A, 356, 788
- [9] Churazov E., Brüggen M., Kaiser C.R., Böhringer H., Forman W., 2001, ApJ, 554, 261
- [10] Conselice C.J., Gallagher J.S., Wyse R.F.G., 2001, AJ, 122, 2281
- [11] Cowie L.L., Hu E.M., Jenkins E.B., York D.G., 1983, ApJ, 272, 29
- [12] Crawford C.S., et al 1995, MNRAS, 274, 75
- [13] Fabian A.C., NUlsen P.E.J., Arnaud K.A., 1984, MNRAS, 208, 179
- [14] Fabian A.C., 1994, ARA&A, 32, 277
- [15] Fabian A.C. et al., 2000, MNRAS, 318, L65
- [16] Fabian A.C., et al 2003, MNRAS, submitted
- [17] Fabian A.C., Celotti A., Blundell K.M., Kassim N.E., Perley R.A., 2002b, MNRAS, 331, 369
- [18] Heckman T.M., Baum S.A., Van Bregeul W.J.M., McCarthy P., 1989, ApJ, 338, 48
- [19] Johnstone R.M., Fabian A.C., 1988, MNRAS, 233, 581
- [20] Kent S.M., Sargent W.L.W., 1979, 230, 667
- [21] Koekemoer A., et al, 1999, ApJ, 525, 621
- [22] Lamb H., 1897, Hydrodynamics, Camb. Univ. Press
- [23] Landau L.D., Lifshitz E.M., 1959, Fluid Dynamics, Pergamon Press
- [24] Lynds R., 1970, ApJ, 159, L151
- [25] McCarthy P., 1993, ARAA, 31, 639
- [26] McNamara B., O’Connell R.W., Sarazin C.L., 1996, AJ, 112, 91
- [27] Minkowski R., 1957, IAU Sympn 4, p107
- [28] Pedlar A., Ghataure H.S., Davies R.D., Harrison B.A., Perley R., Crane P C., Unger S.W., 1990, MNRAS, 246, 477
- [29] Reynolds C.S., Heinz S., Begelman M.C., 2002, MNRAS, 332, 271
- [30] Reuland M., 2003, astro-ph/0303637
- [31] Sabra B., Shields J.C., Filippenko A.V., 2000, ApJ, 545, 157
- [32] Sandage A., 1972, Pont. Acad. Scient. Scipta Varia (Nuclei of Galaxies) 35, 307
- [33] Schmidt R.W., Fabian A.C., Sanders J.S., 2002, MNRAS, 337, 71
- [34] Sparks W.B., Macchetto F., Golombek D., 1989, ApJ, 345, 153
- [35] Spitzer L., 1962, The Physics of Fully Ionized Gases, Interscience Publishers
- [36] Van Dyke M., 1982, An album of fluid motion, Parabolic Press, Stanford, CA, USA
- [37] Wegener P.P, Parlange J-Y, 1973, Ann. Rev. Fluid Mech. , 5, 79