Results of the ESO-SEST Key Programme on CO in the Magellanic Clouds
We present =1–0 and =2–1 maps of several star-forming regions in both the Large and the Small Magellanic Cloud, and briefly discuss their structure. Many of the detected molecular clouds are relatively isolated and quite small with dimensions of typically 20 pc. Some larger complexes have been detected, but in all cases the extent of the molecular clouds sampled by CO emission is significantly less than the extent of the ionized gas of the star-formation region. Very little diffuse extended CO emission was seen; diffuse CO in between or surrounding the detected discrete clouds is either very weak or absent. The majority of all LMC lines of sight detected in has an isotopic emission ratio of about 10, i.e. twice higher than found in Galactic star-forming complexes. At the lowest intensities, the spread of isotopic emission ratios rapidly increases, low ratios representing relatively dense and cold molecular gas and high ratios marking CO photo-dissociation at cloud edges.
Key Words.:
Galaxies: individual: LMC, SMC – Magellanic Clouds – galaxies: ISM – galaxies: irregular – galaxies: Local Group – ISM: molecules – ISM star formation regions1 Introduction


In 1988, a joint ESO-Swedish Key Programme was established on the SEST to investigate the molecular gas in the Magellanic Clouds. The purpose of the Programme was twofold. First, it was intended to establish the relation between CO emission and the much more abundant molecular hydrogen gas it traces. Second, it intended to map CO emission from individual molecular complexes and study its relation to star formation. Finally, the Programme intended publish a homogeneous set of molecular line data useful for further studies of the Magellanic Clouds. It was noted that the Magellanic Clouds allow investigation ofmolecular gas and cloud complexes under conditions of low metallicity and high radiation densities as compared to those found in the Solar Neighbourhood, and in fact different in the Large and the Small Magellanic Cloud.
The rationale of the programme was described in more detail by Israel et al. (1993; Paper I), who also presented the first results from the Programme in the form of an extensive survey of CO emission from (mostly far-infrared) sources in both the Large and the Small Magellanic Cloud. This was followed by studies of the major star-forming regions in the LMC (30 Doradus and N 159/N 160: Johansson et al. 1998; N 11: Israel et al. 2003), by studies of less active extended cloud complexes in the LMC (Kutner et al. 1997; Garay et al. 2002), and by studies of relatively small molecular cloud complexes in the SMC (Rubio et al. 1993a, 1993b, 1996; Lequeux et al. 1994). With ESO’s discontinuation of the Key Programme concept, the observational programme was concluded in 1995, although the processing of data obtained has continued, as have observations of Magellanic Cloud objects independently of the Key Programme consortium (SMC-N 66: Rubio et al. 2000; LMC-N 159/N 160; SMC-N 83/N 84: Bolatto et al. 2000; 2003). A study of star formation in LMC objects, based on a part of the Key Programme observations, was published by Caldwell Kutner (1996). They found that, compared to the Milky way, LMC molecular clouds are less luminous in both the CO line and in the far-infrared continuum and that they are subject to significant massive star formation, irrespective of cloud (virial) mass. In this paper, we present the remaining part of the Key Programme observations, dealing with several molecular clouds associated with HII regions in both the Large and the Small Magellanic Cloud.
2 Observations
| Namea | DEMb | LI-LMCc | SMC-Jd | NGC | Map Centerf | Map Size (′) | Reference | |
| LI-SMC | LMC-Be | (1950.0) | (1950.0) | |||||
| SMC | ||||||||
| N12A | 23 | 36 | 004633-730604 | — | 00:44:54.0 | -73:22:29 | TP, 7 | |
| N13A,B | 16 | 29 | 004523-732250 | — | 00:44:01.3 | -73:39:10 | 8 | |
| N15 | 28 | — | — | — | 8 | |||
| N16 | 21 | 35 | 004619-732324 | 248 | 8 | |||
| N22 | 37 | 45 | 004834-731509 | — | 00:46:15.9 | -73:29:50 | 8 | |
| N25/N26 | 38 | 45 | 004834-731509 | — | 8 | |||
| N27 | 40 | 49 | 004823-730557 | — | 00:46:28.7 | -73:21:32 | TP, 7 | |
| N66A-D | 103 | 131,135,137 | 0059**-7210** | 346 | 00:59:20.0 | -72:10:0 | 7, 9 | |
| N83A-C | 147-148 | 199 | 011416-731549 | 456 | 01:12:43.4 | -73:32:03 | TP, 10 | |
| N84C | 149 | 200 | 011416-731549 | 456 | TP, 10 | |||
| N84B,D | 152 | 202 | — | 456 | 01:13:23.0 | -73:36:33 | TP, 10 | |
| N88 | 161 | 215 | 012408-730905 | — | 01:22:54.1 | -73:24:15 | TP, 7 | |
| LMC | ||||||||
| N4A,B | 8 | 102 | 0452-6700 | 1714 | 04:52:02.9 | -67:00:05 | 1 | |
| N83A-D | 22 | 148,173,193 | 0454-6916 | 1737 | 04:54:12 .1 | -69:15:00 | TP | |
| N11A-J | 34 | 190,192,195 | — | 1760 | 04:56:57.3 | -66:27:00 | 2 | |
| 205,214,217 | 0456-6629/6636 | 1763 | ||||||
| 226,229,243 | 0457-6632 | 1769 | ||||||
| 41 | 248,251, | 0458-6626 | 1773 | |||||
| 266,268,271 | 0458-6616 | — | ||||||
| N55A | 228 | 1268,1273 | 0532-6629 | — | 05:32:31.6 | -66:28:00 | TP | |
| N57A/E | 229,231 | 1261,1274 | 0532-6743 | 2014 | 05:32:30.0 | -67:43:05 | TP | |
| N59A-C | 241 | 1367,1392 | 0535-6736 | 2032/5 | 05:36:00.0 | -67:36:05 | TP | |
| N157A,B | 263 | 1469 | 0538-6911 | 2060 | 05:38:09.5 | -69:07:00 | 3 | |
| N159A-L | 271-272 | 1501,1518 | 0540-6946 | 2079 | 05:40:18.2 | -69:42:30 | 3, 4 | |
| N160A-F | 283-284 | 1503,1549 | 0540-6940 | 2080 | 3, 4 | |||
| N158C,D | 269 | 1490 | 0539-6931 | 2074 | 3, | |||
| N214A-C,E | 274,278,293 | 1505,1521,1577 | 0540-7111 | 2103 | 05:40:35.8 | -71:11:00 | 5 | |
| N171A,B | 267 | 1486 | — | — | 05:40:41.8 | -70:22:00 | 5 | |
| N176 | 280 | 1541 | — | — | 5 | |||
| N167 | 307 | 1633 | — | — | 05:45:24.5 | -69:26:00 | 6 | |
| N72 | 304 | 1602 | 0543-6918 | — | 6 | |||
| N169A-C | 312-314 | 1696 | 0546-6934 | — | 05:46:11.6 | -69:38:00 | 6 | |
Notes:
a Optical designation by Henize (1956);
b Optical designation by Davies et al. (1976);
c IRAS designation by Schwering Israel (1990).
d ATCA radio continuum designation by Filipovic et al. (2002).
e Parkes radio continuum designation by Filipovic et al. (1996).
f Actual center of map, not to be confused with (0,0) map reference.
References: TP: This Paper
1.: Heydari-Malayeri Lecavelier des Etangs (1994);
2.: Israel et al. (2003);
3.: Johansson et al. (1998);
4.: Bolatto et al. (2000);
5.: Kutner et al. (1997);
6 : Garay et al. (2002);
7.: Rubio et al. (1996);
8.: Rubio et al. (1993);
9.: Rubio et al. (2000);
10.: Bolatto et al. (2003);
| Name | Peak CO Parameters | Cloud CO Parameters | |||||||
| Tmb | V | Radiusa | |||||||
| (K) | () | () | (pc) | (pc2) | 10 | ( cm | |||
| SMC | |||||||||
| N12 | 2.0 | 3.4 | 126.0 | 8.2 | 11d | 7 | 3970 | 1.7 | 2.0 |
| N27 | 1.7 | 6.6 | 113.2 | 11.8 | 16d | 10 | 8610 | 9.2 | 5.3 |
| N83A-Cb | 1.1 | 3.1 | 161.7 | 5.4 | 10e | 14 | 4015 | 2.8 | 3.5 |
| N84C | 1.0 | 4.3 | 160.7 | 3.3 | — | 5 | 1230 | 1.9 | 7.5 |
| N84B,D | 0.8 | 2.6 | 168.1 | 2.2 | — | 5 | 880 | 0.6 | 3.5 |
| N88 | 0.7 | 2.9 | 147.7 | 2.5 | 13e | 5 | 530 | 0.8 | 7.1 |
| LMC | |||||||||
| N55 | 3.5 | 4.8 | 289.0 | 16.7 | 12c | 9 | 6235 | 4.4 | 3.3 |
| N57A1 | 1.2 | 3.2 | 287.8 | 4.3 | 13c | 4 | 715 | 0.9 | 5.7 |
| N57A2 | 2.9 | 4.1 | 285.7 | 12.6 | — | 13 | 3760 | 4.6 | 5.8 |
| N57A3 | 3.1 | 2.8 | 284.5 | 9.1 | — | 15 | 3225 | 2.5 | 3.8 |
| N57A4 | 1.0 | 5.1 | 284.9 | 5.3 | — | 6 | 1690 | 3.3 | 9.7 |
| N57A5 | 1.3 | 3.0 | 286.3 | 5.1 | — | 8 | 1290 | 1.5 | 5.6 |
| N59A1 | 1.4 | 6.0 | 285.2 | 9.1 | 12c | 7 | 5570 | 5.3 | 4.5 |
| N59A2 | 1.8 | 2.9 | 279.9 | 5.3 | 7 | 3260 | 1.2 | 1.8 | |
| N59A3 | 2.2 | 3.7 | 282.4 | 8.1 | — | 6 | 3035 | 1.7 | 2.7 |
| N59A4 | 0.9 | 5.0 | 282.6 | 6.6 | — | 16 | 15970 | 8.1 | 2.4 |
| N83A | 2.9 | 6.7 | 245.2 | 19.4 | 9e | 6 | 5370 | 5.7 | 5.3 |
| N83B | 2.2 | 4.1 | 243.5 | 9.7 | 11e | 4 | 2510 | 1.2 | 2.5 |
| N83Cb | 2.2 | 5.3 | 246.3 | 12.8 | 14e | 12 | 10920 | 7.1 | 3.1 |
| N83D | 1.3 | 3.1 | 243.7 | 6.1 | 16e | 2 | 530 | 0.4 | 3.6 |
Notes: a Corrected for finite beamwidth. b Complex Source. c Israel et al. (1993) d Rubio et al. (1996) e This Paper


In Table 1, we present a list of all Henize (1956) star formation regions mapped in the Key Programme. This is a subset of the HII region sample surveyed in the beginning of the project (Israel et al. 1993). Table 1 also includes regions for which the results have already been published; it serves as an overall guide to Magellanic cloud areas mapped in the SEST Key Programme.
The observations were made between December 1988 and January 1995 using the SEST 15 m located on La Silla (Chile)111The Swedish-ESO Submillimetre Telescope (SEST) is operated jointly by the European Southern Observatory (ESO) and the Swedish Science Research Council (NFR).. Observations in the =1–0 transition (110 – 115 GHz) were made with a Schottky receiver, yielding typical overall system temperatures = 600 – 750 K. Observations in the =2–1 (220 – 230 GHz) were made with an SIS mixer, yielding typical overall system temperatures = 450 – 750 K depending on weather conditions. On average, we obtained 1 noise figures in a 1 km s-1 band of 0.04, 0.10, 0.08 and 0.12 K at 110, 115, 220 and 230 GHz respectively.
In both frequency ranges, we used the high resolution acousto-optical spectrometers with a channel separation of 43 kHz. The =1–0 observations were made in frequency-switching mode, initially (1988) with a throw of 25 MHz, but subsequently with a throw of 15 MHz. The =2–1 measurements were made in double beam-switching mode, with a throw of 12′ to positions verified from the =1–0 map to be free of emission. Antenna pointing was checked frequently on the SiO maser star R Dor, about 20∘ from the LMC; r.m.s. pointing was about . Mapping observations usually started in the =1–0 transition on a grid of (single-beam) spacing, although in exceptional cases where large areas were to be surveyed (e.g. Doradus region and N 11 in the LMC), double-beam spacings of were employed. Where emission was detected, we usually refined the grids to a half-beam sampling of . Some of the clouds thus mapped in =1–0 were observed in =1–0 on the same grid, and with grid-spacing in the =2–1 transitions.
Because the original observations of LMC cloud N 57 were undersampled on a grid of 1′ spacing, we reobserved in February 2003 that part of the map which showed emission from this object. The =1–0 and =2–1 transitions of 12CO were observed simultaneously. The observations were likewise made in frequency-switched mode, with a throw of 10 MHz, using an autocorrelator for backend. The resulting new =1–0 observations were combined with the older ones in a single map.
Unfortunately, frequency-switched spectra suffer from significant baseline curvature. In this paper, we have corrected baselines by fitting polynomials to them, excluding the range of velocities covered by emission and the ranges influenced by negative reference features. For each source, the emission velocity range was determined by summing all observations, which has the advantage that, in principle, it does not select against weak extended emission, at least over the same velocity range as occupied by the brighter emission.
The FWHM beams of the SEST are and respectively at frequencies of 115 GHz and 230 GHz. Nominal main-beam efficiencies at these frequencies were 0.72 and 0.57 respectively. For a somewhat more detailed discussion of the various efficiencies involved, we refer to Johansson et al. (1998; Paper VII).
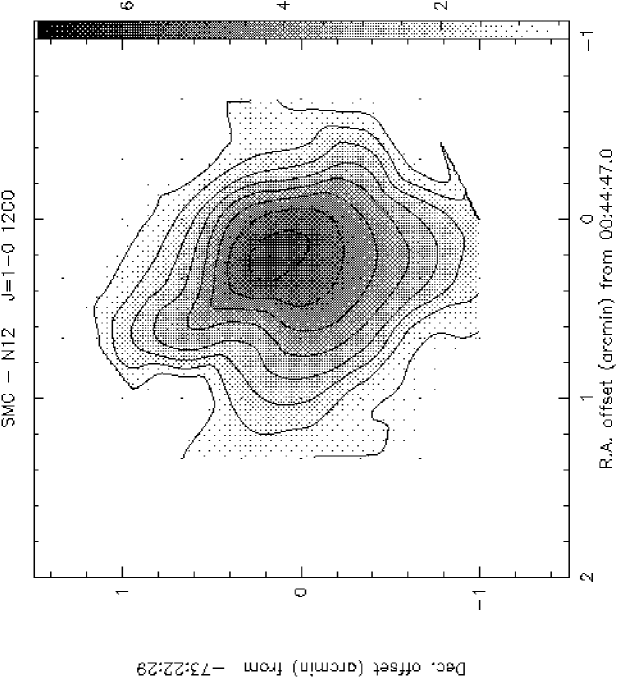
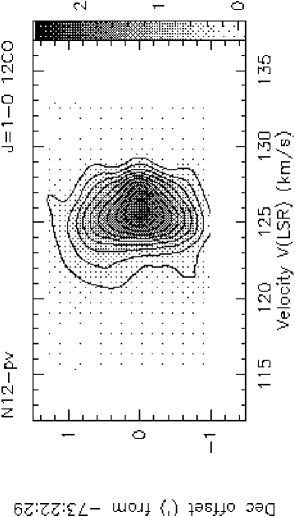
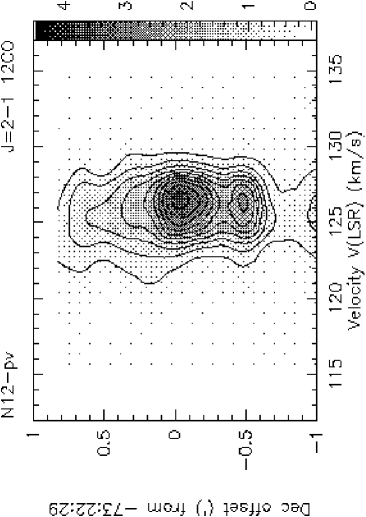
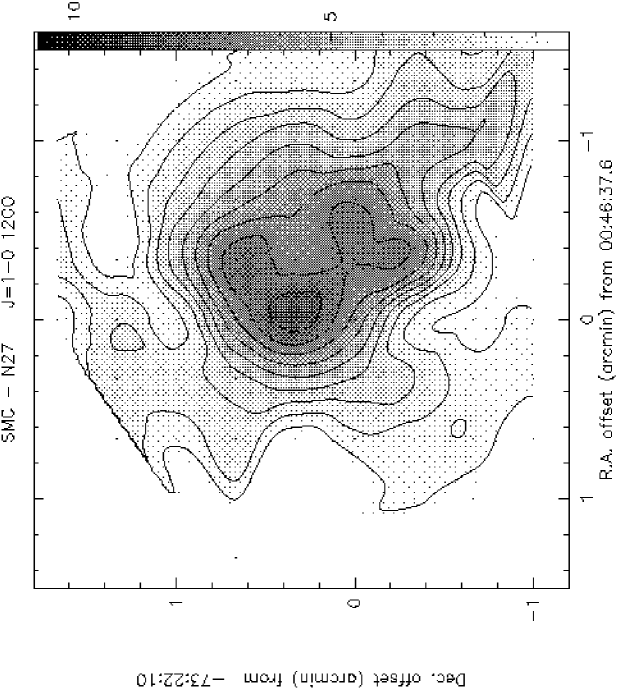
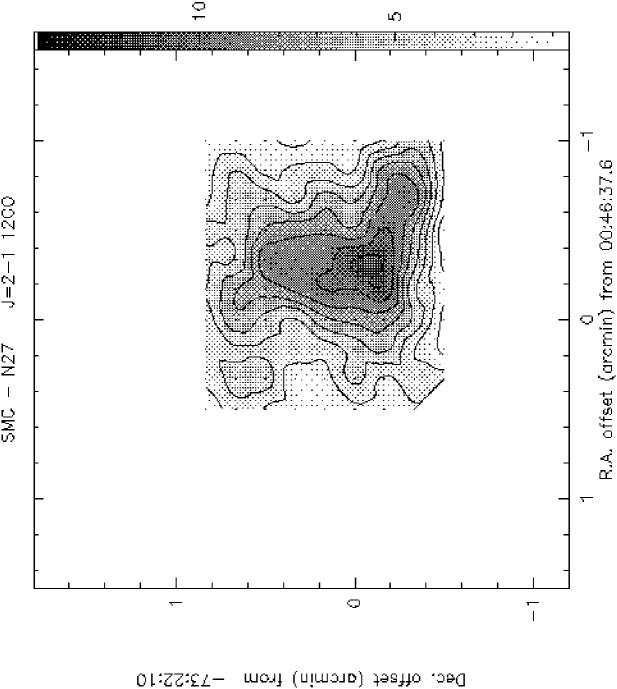
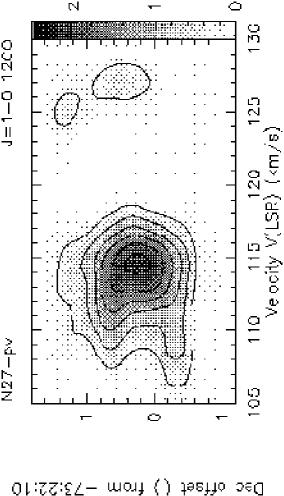
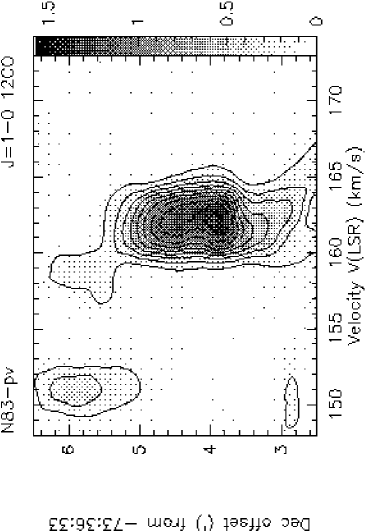
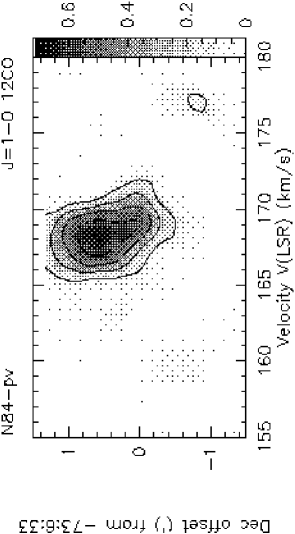
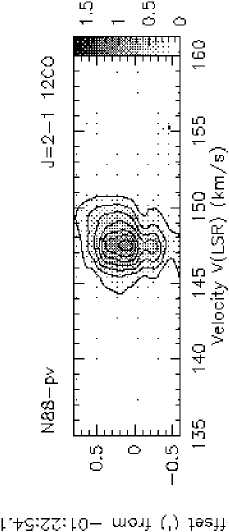
Resulting CO images and position-velocity maps are shown in Figs. 2, 3, 4 and 5; representative and profiles are shown in Fig. 1. Objects shown include clouds associated with the SMC HII regions N 12, N 27 and N 88. Profile maps of these clouds, but not images and position-velocity maps, were earlier presented by Rubio et al. (1996).
3 Results and analysis
3.1 Individual cloud properties
Although all but one of the clouds listed in Table 2 are resolved,
virtually all of them have dimensions no more than a few times the size
of the =1–0 observing beam (11.2 pc in the LMC and 13.1 pc
in the SMC). The maps thus do not provide much information on the
actual structure of individual clouds. We determined cloud CO
luminosities by integrating over the relevant map area. We verified
that the results were not significantly affected by the precise size
and velocity limits of the maps. Characteristic cloud dimensions were
determined by counting the number of map pixels with significant
emission, and taking where is the linear
grid spacing. The results were then corrected for finite beamwidth
to yield corrected radii . In Table 2 we list these CO cloud radii
and luminosities, in addition to the parameters describing the CO
emission peak. Although it is by no means certain that the clouds
identified by us are indeed virialized, we have used the data given
in Table 2 to calculate virial masses following:
where k = 210 for homogeneous spherical clouds and k = 190 for clouds with density distributions (MacLaren et al. 1988). In our calculations, we have assumed the former case, although the actual uncertainties are in any case much larger than the difference between the two values of k. The results are also included in the Table. As in previous papers, we have searched for correlations between source radius , velocity width , source luminosity and virial mass . Although the present sample is relatively small and inhomogeneous, we find that and appear to be unrelated. There is a marginally significant correlation log 2 log that appears to be significantly steeper than the linear correlation found for the N 11 clouds in Paper IX. However, the more significant correlation between and is within the margin of error identical to the almost linear correlation found in N 11.
Comparison of the virial masses, corrected for a helium contribution
of 30 by mass, with the observed CO luminosity yields, for each
cloud, a mean CO-to- conversion factor , following:
which is included in the last column of Table 2.
We find for the discrete CO clouds a range of values between and , with effectively identical means = and = , i.e. 2.5 times the ‘standard’ conversion factor in the Solar Neighbourhood. Johansson et al. (1998), Garay et al. (2002) and Israel et al. (2003) obtained very similar results for clouds in various LMC complexes (30 Doradus, Complex 37 and N 11 respectively).


3.2 CO Clouds in the SMC
As the physical characteristics of the molecular clouds associated with the Bar HII regions N 12 through N 66 have been discussed in previous (Key Programme) papers (see references in Table 1), we refer to those papers for further detail. This also applies to the CO observations of the cloud associated with the Wing HII region N 88, although we note that the previously quoted very high central isotopic ratio of about 25 was in error and should be replaced by half that value as listed in Table 2, rendering N 88 more similar to N 12 and N 27. For the molecular clouds associated with the SMC Wing HII region complex N 83/N 84 we refer to a forthcoming paper by Bolatto et al. (2003). Here, we will briefly comment on the overall characteristics of the CO cloud population of the SMC. In Paper I, we concluded that the peak CO emission from clouds in the SMC is weak with respect to that from clouds in the LMC. This is borne out by the mapping results in Table 2. In fact, the brightest CO cloud in the SMC is less conspicuous than the brightest subclouds in each of the LMC sources. Yet this object, N 27 also known as LIRS 49, is significantly brighter than all other sources found in the SMC, including objects not listed here, such as N 66 (Rubio et al. 2000) and the various other clouds mapped in the southwestern Bar of the SMC (Rubio et al. 1993a; hereafter Paper II).
Secondly, it should be noted that the CO clouds have rather small dimensions. This is not only shown by the velocity-integrated intensity maps, but it is also quite obvious from the various position-velocity maps that invariably show very limited extents for bright emission regions. Bright regions extending over more than an arcminute (18 pc) always show substructure suggesting that the observed source is a grouping of smaller individual clouds (see also Figs. 1 through 4 in Paper II). The small CO clouds associated with the Orion-sized HII regions N 12 and N 27 in the southwest main Bar of the SMC and N 88 in the SMC Wing, are comparatively simple and not part of a larger complex. This is in contrast to the clouds associated with N 66 (main Bar) and N 83/N 84 (Wing). These occur in complexes up to 4 arcmin (70 pc) in size as do the clouds in the southwest Bar (SMC-B1 and SMC-B2 in Paper II). With the exception of the N 27 cloud, all CO (sub)clouds mapped in the SMC, including the N 66 complex, are significantly smaller in size than the associated HII regions or HII region complexes. This situation is unlike that found in the Milky Way, where CO cloud complexes are frequently much larger than the associated HII regions. Moreover, as Figs. 1 and 3 in Paper II show, the HII regions, although larger than the nearest CO clouds, are usually centered at the edge of these clouds (N 15, N 16, DEM 34 and DEM 35; N 25), or occur at a hole in the CO distribution (N 13, N 22). This is true also for the HII regions whose CO maps are presented here, N 12, N 27 and N 88, which are centered at the western, eastern and southwestern edges of their respective CO clouds. Of particular interest in this respect are N 27 and N 83 where the CO emission appears to occur predominantly in a ridge adjacent to the HII region.
Although the extended emission from N 88 is centered at about in the map shown in Fig. 3, the dust-rich, high-excitation compact component N 88A (see Heydari-Malayeri et al. 1999) occurs close to the map center, where the CO emission exhibits an extension to the northwest. Shocked molecular hydrogen was detected in this nebula, which appears to be partially embedded in the molecular cloud (Israel Koornneef 1991).
Both the limited size of the clouds and their weak CO emission causes the resulting CO luminosities to be rather modest. Most of the clouds identified in the SMC Bar region have luminosities pc2 (Paper II); the N 88 cloud in the Wing has a very low pc2. Cloud complexes such as N 66 (Rubio et al. 2000) in the Bar and N 83/N 84 in the Wing typically have equally modest luminosities pc2. Relatively small HII regions in the Bar have the brightest CO clouds: N 12 and N 22 (= SMC-B2 no.3, Paper II) both have pc2, and N 27 has pc2. The identified clouds represent a significant fraction of the CO present in the SMC, as is clear from a comparison with the 2.6 (50 pc) resolution maps published by Mizuno et al. (2001). At this lower resolution, their survey covers a larger surface area in otherwise the same parts of the SMC that we have mapped. Nothwithstanding a much more extensive coverage, their Fig. 1 clearly shows that there is little CO emission in the southwest Bar in addition to the sources SMC-B1, SMC-B2, LIRS 36 (N 12) and LIRS 49 (N 27) mapped by us. Likewise, in the northern Bar there is not much emission apart from that associated with N 66 and N 76. From their more complete map of the N 83/N 84 region in the Wing, they obtain pc2, i.e. only twice the value we find in a few discrete clouds. Similarly, the total CO luminosity detected in their survey is also about twice the sum of the luminosities of the individual sources detected by us (Paper II, This Paper).
3.3 CO clouds in the LMC
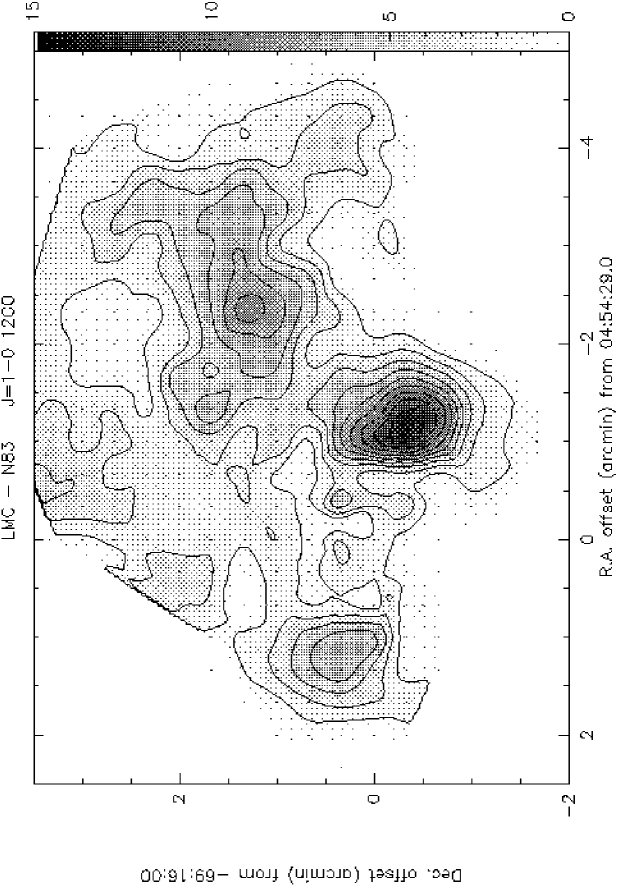
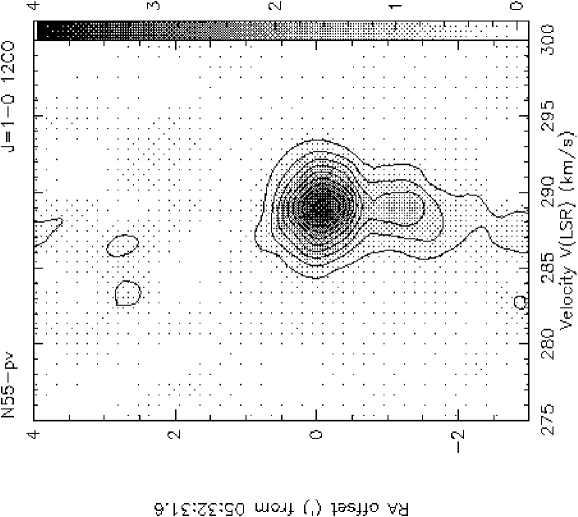
Again, most of the Key Programme sources observed in the LMC and listed in Table 1 have already been discussed in some detail in the references given in that Table. The exceptions are the sources associated with the HII region complex N 83 in the center-west of the LMC, and the HII regions N 55, N 57 and N 59, all associated with supergiant shell SGS-4 (Meaburn 1980) in the northeast of the LMC. Located between SGS-4 and SGS-5 are the CO cloud counterparts of HII regions N 48 and N 49. These have also been mapped with the SEST by Yamaguchi et al. (2001b), but not as part of the Key Programme.
3.3.1 N 55, N 57 and N 59
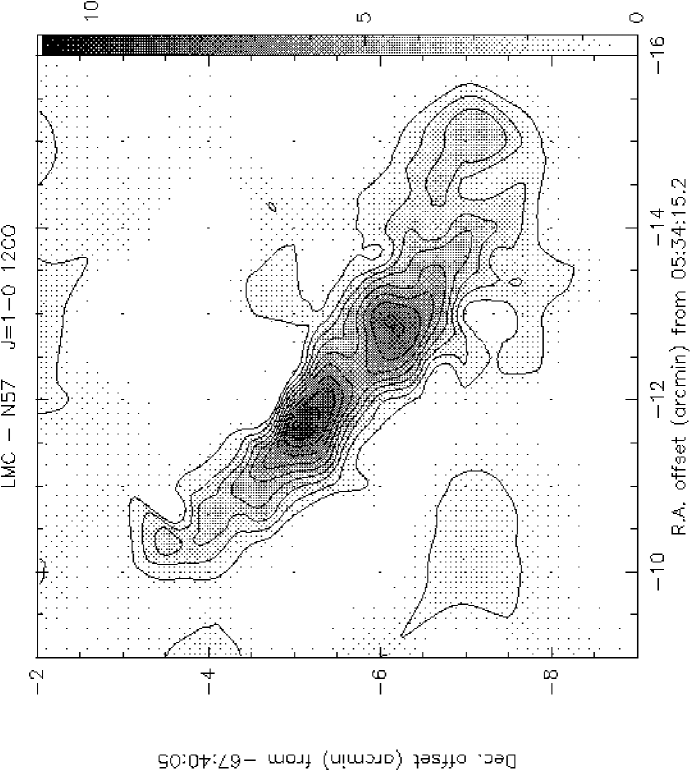
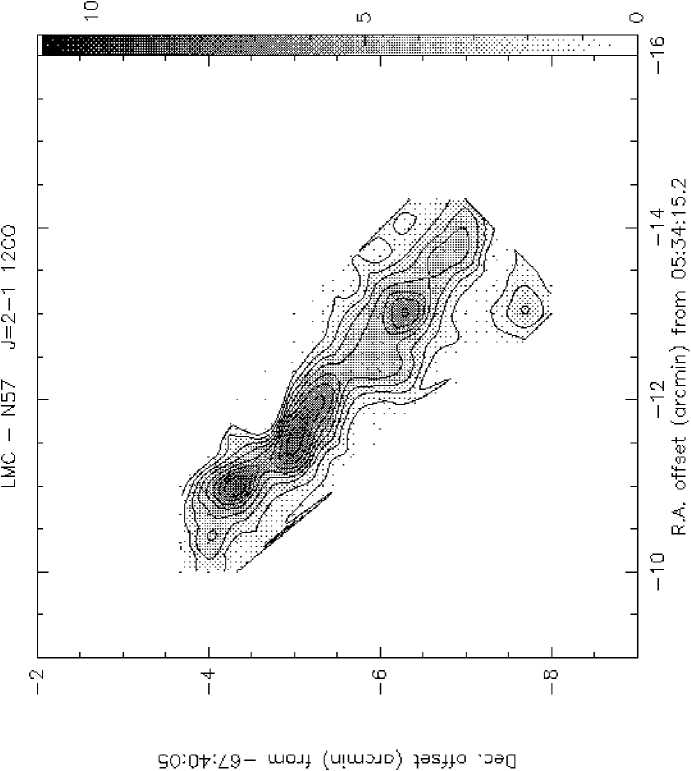
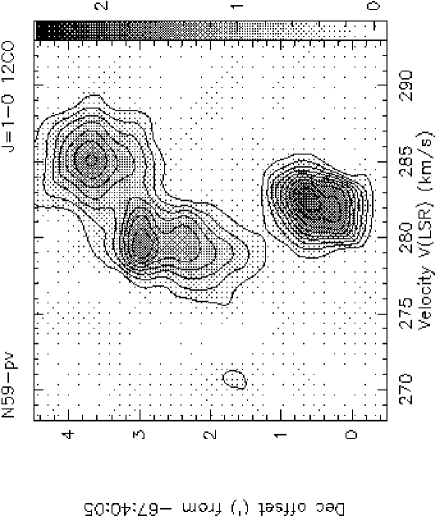
N 55, N 57 and N 59 are all large (respectively 6′, 10′ and 8′) HII region complexes associated with supergiant shell SGS 4 (Meaburn 1980; see optical image by Braun et al. 1997 or CO map by Yamaguchi et al. 2001b). The shell and the dominant stellar population associated with it are 10–30 million years old (see references reviewed by Olsen et al. 2001). The HII region complex N 57 is excited by the OB association LH 76 (Lucke Hodge 1970). N 57 and N 59 are at the southeastern edge of SGS 4, in a region of the LMC also known as Shapley Constellation III (McKibben Nail Shapley 1953). In contrast, N 55 is seen projected inside the shell. A direct physical association of N 57 and N 59 with the supershell is suggested not only by the fact that they occur at the shell edge, but also by the fact that the CO clouds (Fig. 4) form elongated structures almost exactly along this edge. This configuration is particularly striking for N 57. The elongated CO complex contains over half a dozen virtually unresolved (i.e. radii of only a few parsec) compact components, which are particularly well-distinguished in the position-velocity maps shownnin Fig.4. The map containing N 59 likewise shows at least four distinct CO clouds, the northernmost of which is close to the center of the much larger () HII region N 59A. It is remarkable that both in the case of N 57 and of N 59, the CO emission apears to be ‘sandwiched’ between the shell and the brightest HII regions. With the present observations, it is difficult to retrieve detailed information on the physical condition of the clouds.
N 55 is a fairly isolated HII region complex inside the shell. It is excited by OB association LH 72. The stellar population, and the neutral hydrogen surrounding the object were the subject of a detailed study by Olsen et al. (2001). The extent of the ionized gas once again greatly exceeds that of the CO shown in Fig. 5. Comparison with Figs. 14 and 15 by Olsen et al. (2001) suggests that the CO is found at velocities devoid of HI emission and predominantly between the ionized region and the southernmost peak in the extended HI distribution. The appearance of the HI, CO and H distributions lends support to the surmise by Yamaguchi et al. (2001b) that the N 55 complex has been shaped by the passage of the SGS 4 shell.
Comparison with the CO cloud luminosities resulting from the beam survey by Mizuno et al. (2001) show that essentially all CO for at least N 55 and N 57 has been detected by us. N 59 does not occur in their catalog, although it is clearly visible in the more sensitive CO map by Yamaguchi et al. (2001b).
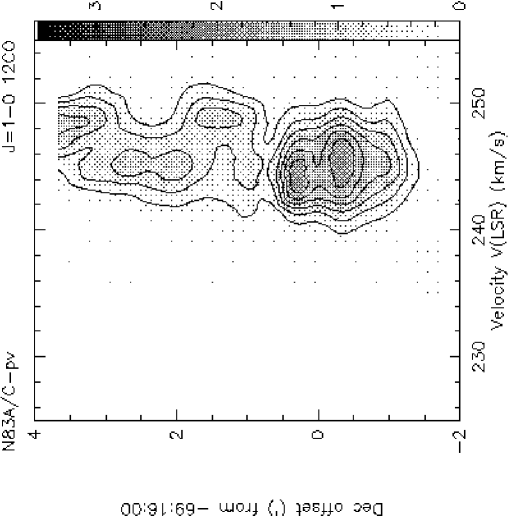
3.3.2 N 83
N 83 is a large HII region complex of diameter (9580 pc) extending beyond the boundaries of the map in Fig. 5. It is located at the edge of Meaburn’s (1980) supergiant shell SGS 6 (see Fig. 1 by Yamaguchi et al. 2001a). N 83 contains a number of individual bright HII regions. N 83A is associated with the bright CO cloud in the lower center of the map; the CO cloud is smaller than the 1.5′ (23 pc) diameter of the very bright HII region. The likewise very bright N 83B is centered at the western edge of the easternmost CO cloud in Fig. 5; with a diameter of 0.6′ (9 pc) it is somewhat smaller than its associated CO cloud. N 83C and N 83D are relatively compact HII regions (sizes of 0.3′ – 0.4′) located at minima in the CO map inbetween the brighter regions. Although we have mapped clear cloud edges in the south and west, we cannot exclude the possibility that CO emission extends to the northeast. However, the CO luminosity detected in our map, pc2, is about 90 of the cloud luminosity determined by Mizuno et al. (2001) from their large-beam () CO survey of the LMC, suggesting that we have not missed much.
3.4 Isotopic ratios


In addition to the =1-0 isotopic ratios corresponding to the peak emission of the sources listed in Table 2, we have collected similar ratios for all pointings where velocity-integrated emission was measured with uncertainties less than 20. In Fig. 6 we display the results for molecular clouds in the relatively quiescent area south of 30 Doradus and N 159 (Kutner et al. 1997, Paper VI), the molecular cloud associated with the northern ionization front of 30 Doradus itself (Johansson et al. 1998; Paper VII), the brightest clouds associated with N 167, to the east of 30 Doradus (Garay et al. 2002; Paper VIII) and molecular clouds Nos. 8, 10 and 15 forming part of the ring in the N 11 complex (Israel et al. 2003; Paper IX).
A comparison of the fields in Fig 6 illustrates interesting differences. For instance, only a limited range of CO intensities occurs in N 11 (as pointed out in Paper IX) but the range of isotopic ratios in this object is large. In contrast, very high isotopic ratios are absent in the 30 Doradus cloud. In Fig 7 we show all available pointings in the SMC and the LMC. With a few exceptions, the SMC measurements are characterized by relatively low intensities . Isotopic ratios range from about 5 to 25. The LMC results show a richer pattern. This diagram contains a number of pointings on molecular clouds in intensely star-forming complexes such as N 159, N 44 and N 214, characterized by CO intensities . These all have very similar isotopic ratios , which is about a factor of two higher than the isotopic ratios of Galactic molecular cloud centers. Throughout the Magellanic Clouds, transitional ratios are found to be close to unity (Papers V, VII, VIII, IX; Rubio et al. 2000). This all but rules out very low intrinsic optical depths. The observed emission must at least be saturated. This implies either (i) lower CO abundances, or (ii) a lesser filling of the beam by than by , or (iii) an intrinsically lower abundance ratio. However, the last possibility (iii) does not seem to applicable according to estimates by Johansson et al. (1994).
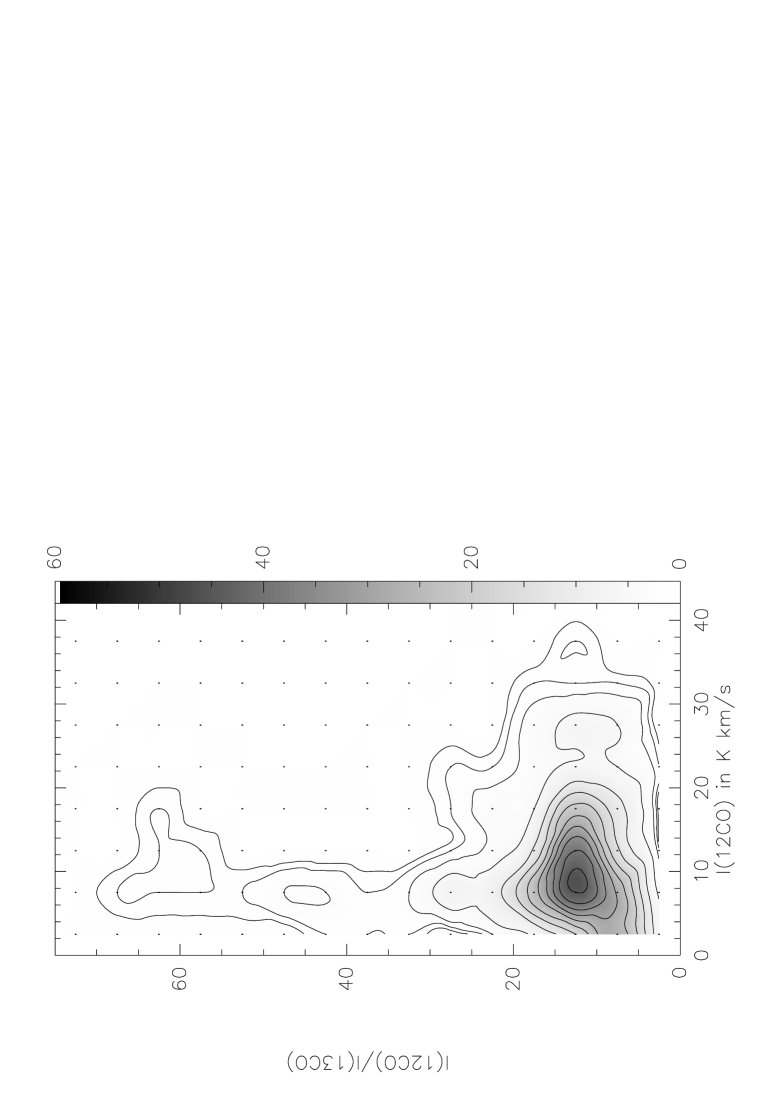
For pointings in less bright directions, with , the range of isotopic ratios rapidly increases from low values of 4 to high values of 70. As we only included measurements with reasonable to good signal-to-noise ratios, this is an intrinsic increase in range, not caused by higher noise levels. In order to better study the behaviour of ratios and intensities in the most densely populated part of Fig 7, we have produced a plot with iso-density contours of that part, shown in Fig 8. A full analysis of the CO line emission in terms of source structure unfortunately requires more transitions than we have observed. However, from Fig 8 it is obvious that the great majority of registered pointings show an isotopic ratio between 10 and 15 that appears to drop slowly as intensities decrease. This behaviour can be understood as due to relatively cold molecular gas having lower brightness temperatures as well as higher and optical depths. At intensities we find, in addition, a relatively small but significant number of pointings that combine low CO intensities with high isotopic ratios. Almost all of these are in the direction of the molecular cloud edges; the LMC and SMC molecular clouds mapped in are smaller than the extent. The high isotopical ratios are caused either by low optical depths in both and or by filling less of the observed surface area than .
In Fig 9 we show transition ratios as a function of the isotopic ratio . We have as much as possible convolved =2–1 observations to the twice larger =1–0 beam. This was not always fully possible. As a consequence, about half of the transition ratios in Fig 9 are upper limits although we believe that they are usually quite close to the actual value. The average =2–1/=1–0 transition ratio is about 1.2.
Assuming a abundance ratio of about 50 (Johansson et al. 1994) and CO rotation temperatures less than 30 K, Fig 9 does not distinguish between very high (as in the Galaxy) and moderately high () optical depths in the line. However, Fig. 10 shows that the outer envelope of the distribution shown in Fig. 8 is well fitted by a line of constant ( K) defined by varying optical depth. This applies particularly to the region below an isotopic ratio of about 40, under the assumption of LTE conditions, an intrinsic isotopic abundance ratio of 50, and full beam-filling. For beam-filling factors less than unity, the best-fit increases. For a factor of 0.5, for instance, we find K. The extension towards even higher isotopic ratios, discernible in Fig 8, suggests a difference in the and beam-filling. This would be the natural consequence of vigorous CO photodissociation expected to occur in the UV-rich and metal-poor environment of star formation regions in the Magellanic Clouds. Both and would be affected by the lack of shielding against erosion by energetic photons, producing weaker emission in a given beam. However, the lower abundance isotope would have much less self-shielding by its significantly lower column-density and therefore would suffer much more dissociation. Consequently, one expects isotopic ratios to increase with decreasing intensities. The lack of high ratios at the very lowest CO intensities in Figs 7 and 8 is a selection effect: the very low intensities implied by those ratios have been excluded by our requirement of an acceptable signal-to-noise ratio.
In summary, our data indicate that two of the three explanations suggested are actually at work: (i) lower CO abundances in the Magellanic Clouds with respect to Galactic clouds and (ii) different filling factors for and , at least in low-density regions. The first point naturally explains the higher / intensity ratios observed in the Magellanic Clouds, even though the intrinsic isotopic ratio seems similar to that in the Galaxy.
4 Conclusions
-
1.
We present high-resolution (40′′ corresponding to about 11 pc) maps of molecular cloud CO emission associated with 5 star-forming regions in the SMC (N 12, N 27, N 83, N 84 and N 88) and 4 in the LMC (N 83, N 55, N 57 and N 59), in addition to the 7 respectively 8 already published in previous papers in this series (see Table 1).
-
2.
Most of the clouds detected are resolved, but not much larger than the observing beam. Almost all the CO clouds mapped are often much smaller than the extent of the associated ionized gas (HII region).
-
3.
If we assume these clouds to be virialized, the resulting masses define a poor but significant linear correlation with J=1-0 luminosity. Molecular cloud masses thus derived lie typically between 1000 and 5000 , although much lower and much higher masses both occur.
-
4.
Under the assumption of virialization, the small discrete clouds mapped have CO-to conversion factors that are only 2–3 times the conversion factor in the Solar Neighbourhood. The widespread lack of diffuse CO emission, among others, suggests that most clouds are part of photon-dominated regions (PDR’s) so that total molecular masses, incompletely traced by CO, may be higher.
-
5.
We have also collected all detections of the transition in the Key Programme, including those from sources published in previous papers. Isotopic ratios of the majority of these detections cluster around a value of 10. We believe this to reflect substantially lower CO abundances in the Magellanic Clouds, commensurate with the low-metallicity strong-radiation ambient environment.
-
6.
At low intensities we also find isotopic ratios both lower and higher than the above value of 10. We attribute the former to relatively cool and dense molecular gas, and the latter to cloud edges particularly strongly affected by CO photo-destruction.
Acknowledgements.
It is a pleasure to thank the operating personnel of the SEST for their support, and Alberto Bolatto for valuable assistance in the reduction stage. M.R. wishes to acknowledge support from FONDECYT through grants No 1990881 and No 7990042.References
- (1) Bolatto A.D., Jackson J.M., Israel F.P., Zhang X. Kim S., 2000 ApJ 545, 234
- (2) Bolatto A.D., Leroy A., Israel F.P., Jackson J.M., 2003 ApJ submitted
- (3) Braun J.M., Bomans D.J., Will J.-M. de Boer K.S., 1997 A&A 328, 167
- (4) Caldwell D.A. Kutner M.L. 1996 ApJ 472, 611
- (5) Davies R.D., Elliott H.K. Meaburn J., 1976 MNRAS 81, 89
- (6) Filipovic M.D., White G.L., Haynes R.F., et al., 1996 A&AS 120, 77
- (7) Filipovic M.D., Bohlsen, T., Reid, W. et al., 2002 MNRAS 335, 1085
- (8) Garay G., Johansson L.E.B., Nyman L.-, et al. 2002 A&A 289, 977 (Paper VIII)
- (9) Henize H., 1956 ApJS 2, 315
- (10) Heydari-Malayeri M. Lecavelier des Etangs A., 1994 A&A 291, 960
- (11) Heydari-Malayeri M., Charmandaris V., Deharveng L., Rosa M.R. Zinnecker H., 1999 A&A 347, 841
- (12) Israel F.P., Johansson L.E.B., Lequeux J., et al. 1993 A&A 276, 25 (Paper I)
- (13) Israel F.P., de Graauw Th., Johansson L.E.B., et al. 2003 A&A 401, 991 (Paper IX)
- (14) Johansson L. E. B., Olofsson H., Hjalmarson A., Gredel, R. Black, J. H., A&A 291, 89
- (15) Johansson L.E.B., Greve A., Booth R.S., et al. 1998 A&A 331, 857 (Paper VII)
- (16) Kutner M.L., Rubio M., Booth R.S., et al. 1997 A&AS 122, 255 (Paper VI)
- (17) Lequeux J., Le Bourlot J.L., Pineau des Forêts G., et al. 1994 A&A 292, 371
- (18) Lucke P.B. Hodge, P.W., 1970 AJ 75, 171
- (19) McKibben Nail V. Shapley H., 1953 Proc. Nat. Acad. Sci. 39, 358
- (20) McLaren I., Richardson K.M. Wolfendale A.W., 1988 ApJ 333, 82
- (21) Meaburn J., 1980 MNRAS 192, 365
- (22) Meaburn J., Laspias V., Solomos N. Goudis C., 1989 A&A 225, 497
- (23) Mizuno N., Yamaguchi R., Mizuno A., et al. 2001 PASJ 53, 971
- (24) Olsen K.A.G., Kim S. Buss J.F., 2001, AJ 121, 3075
- (25) Rubio M., Lequeux J., Boulanger F., et al. 1993a, A&A 271, 1
- (26) Rubio M., Lequeux J., Boulanger F., et al. 1996, A&AS 118, 263
- (27) Rubio M., Contursi A., Lequeux J. , et al. 2000 A&A 359, 1139
- (28) Schwering P.B.W. Israel F.P., 1990, Atlas and Catalogue of Infrared Sources in the Magellanic Clouds, Kluwer, Dordrecht
- (29) Yamaguchi R., Mizuno N., Onishi T., Mizuno A. Fukui Y., 2001a PASJ 53, 959
- (30) Yamaguchi R., Mizuno N., Onishi T., Mizuno A. Fukui Y., 2001b ApJL 552, L185