The CAPMAP Instrument and its First Season
Abstract
I describe here the new CAPMAP (Cosmic Anisotropy Polarization MAPer) instrument, which performed its first season of observing between February and April 2003 from the Crawford Hill 7-meter antenna in NJ. CAPMAP is based on the design for the PIQUE instrument, but has better sensitivity and superior angular resolution.
1 INTRODUCTION
The status of measurements of CMB polarization has evolved rapidly. Only a year separates the publication of tight upper limits Hedman et al. (2001, 2002); O’dell et al. (2002) and the detection of polarization Kovac et al. (2002). In the summer of 2001, we started designing the CAPMAP instrument. CAPMAP is a 16-element array comprised of twelve 90 GHz and four 40 GHz correlation receivers (four 90 GHz elements have been deployed for initial observations since February 2003). A new feed system has been designed to couple CAPMAP to the 7-meter Crawford Hill antenna to produce a 4′ beam. The goal is to concentrate sensitivity on a diameter cap around the North celestial pole (NCP). As indicated in Figure 7, CAPMAP will probe higher angular scales than those probed by MAP and DASI, and will be sensitive to the predicted peak in polarization. I will discuss in more details specifics of the telescope, the optics, and the receivers.
2 OPTICS
2.1 Telescope
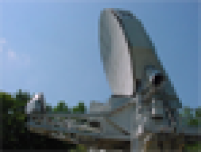
In order to achieve high angular resolution, CAPMAP uses the Lucent Technologies 7-meter offset Cassegrain antenna located in Holmdel, NJ at the Crawford Hill Observatory. Built in 1977, it was originally designed to test polarization multiplexing of signals to geosynchronous satellites at K band and for radio astronomy up to 300 GHz. As a result, it demonstrates many of the requirements necessary for CMB measurements:
-
•
low sidelobe level.
-
•
low cross polarization level.
-
•
good pointing accuracy and tracking capabilities on an alt-az mount.
-
•
large f/D ratio, large useable focal plane.
-
•
temperature-controlled Cassegrain focus room.
A detailed description of the antenna can be found in the Bell Labs Technical Journal Chu et al. (1978). Prior to the summer of 2001, when we started using the antenna, it had primarly been used during the last eight years to train winter-over operators for the south pole AST/RO telescope. We invested large amounts of work in the following two years to repair and upgrade the various mechanical, electrical, and software systems.
2.2 Feed system
If the full aperture were used, the 7-meter antenna would produce a beam in the sky. This resolution is smaller than needed to probe the scales where the polarization peaks, at 10′ or 1000. Thus, the feed system is designed to produce a FWHM beam size of 4′ and to minimize pickup of stray radiation from the ground. This is achieved by aggressively under-illuminating both mirrors. The secondary and primary edge illuminations are respectively -56dB and -30dB. The small () beam pattern required to produce such low edge tapers is the main price that must be paid for the advantage of the large effective focal ratio of . A standard small-angle corrugated horn had to be rejected as a feed because its size would make it prohibitive to cryogenically cool and because its sidelobe pattern could not be controlled to the desired level.
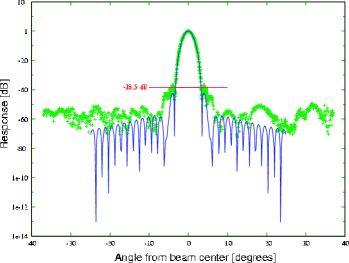
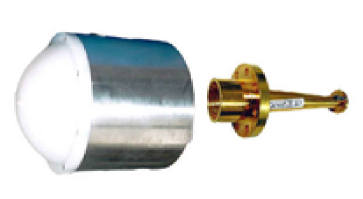
The solution for the feed optics is a 3 cm aperture corrugated feedhorn followed by a 12 cm diameter HDPE meniscus lens shown in Figure 2. The lens is held in front of the horn with a metal shroud. The shroud is coated with a thick microwave absorbing honeycomb to prevent stray radiation from illuminating the horn. This feed system produces the necessary beam size ( FWHM at 90 GHz) to achieve the designed secondary illumination and was optimized to keep its sidelobes below -40 dB (see Figure 3).
We note that because this antenna in not surrounded by ground screens, the extreme under-illumination and the obsessive control of sidelobes are necessary design features to keep the spillover below levels that would interfere with the observation of CMB polarization.
2.3 Array configuration
Because of its slow optics, the Crawford Hill telescope is well suited for an array of receivers at its focus. To determine the size of distortions for receivers displaced from the focal point, we performed extensive studies using both measurements from receivers at different positions in the focal plane and physical optics simulations Grasp8 Student Edition . Figure 4 (left) shows a simulated beam contour plot for a receiver located 39 cm above the focal point and pointed towards the center of the secondary. Distortions remain small even this far from the focal point.
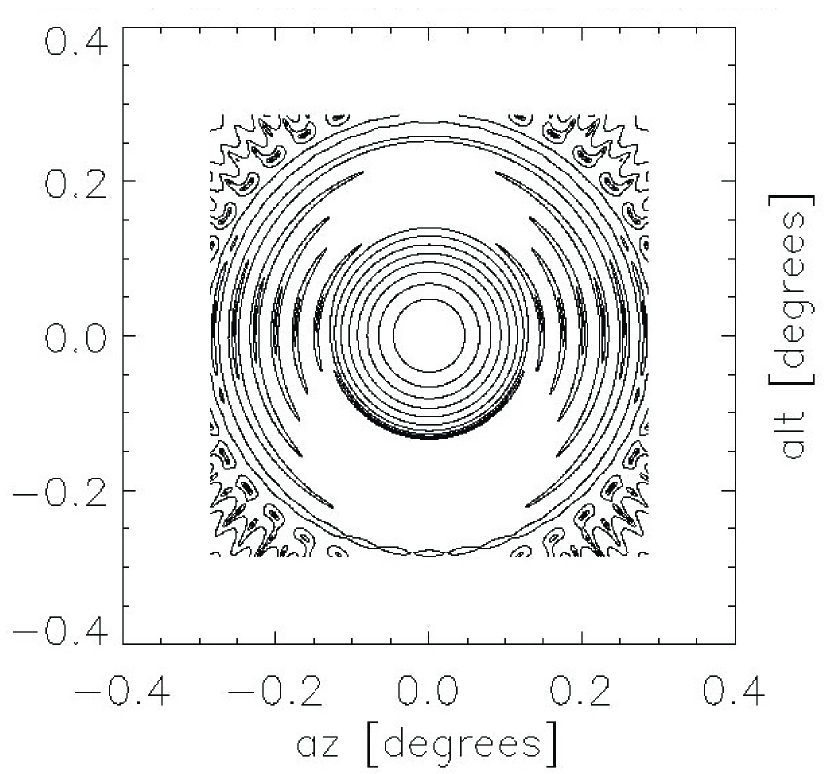
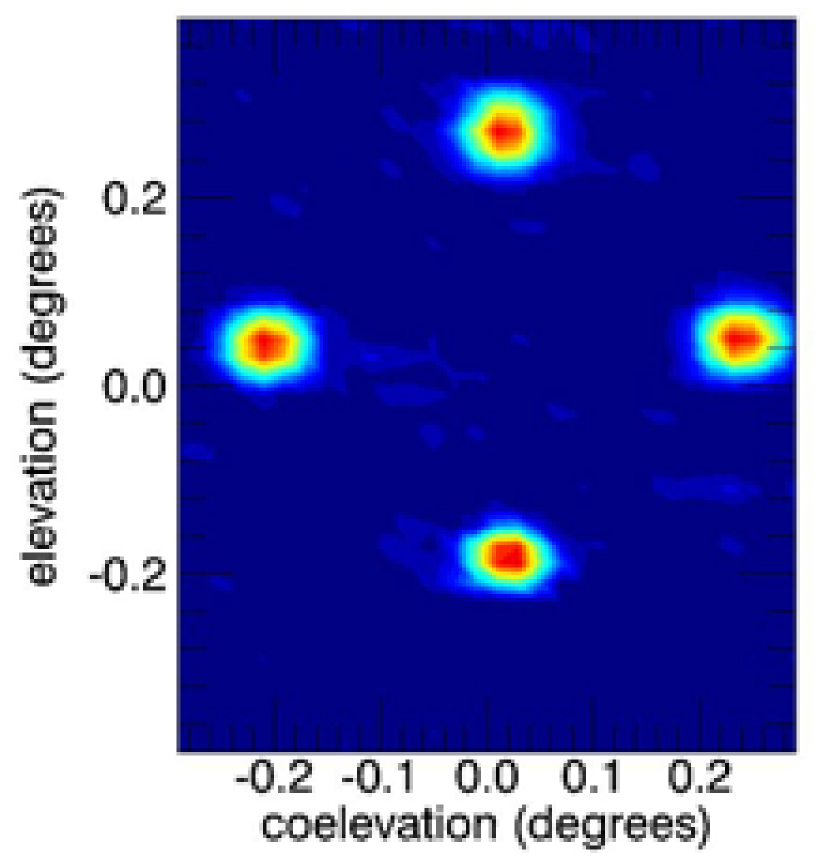
The plate scale for the focal plane is such that a 15 cm shift in the focal plane corresponds to a shift of the beam in the sky. For the initial deployment of four radiometers, we arranged the receivers in a 15 cm radius diamond pattern, obtaining the composite beam map in Figure 4 (right). This configuration allows us to observe a diameter cap around the NCP by scanning the telescope back and forth in azimuth. This scan strategy naturally provide many systematic checks.
3 RECEIVERS
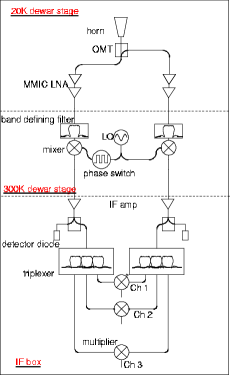
The receivers are heterodyne correlation polarimeters. With approximately 100K system noise and 14 GHz bandwidth, the receiver sensitivity is 1 mK. The signal is amplified by two back-to-back MMIC LNAs222Monolithic microwave integrated circuit low noise amplifiers(see section 3.1). After being down-converted to IF (2-18 GHz), filtered, and further amplified, the signal is detected with a correlation multiplier. The signal is phase-switched in the LO at 4 kHz to avoid the noise of the LNA, which have a knee before phase switching of 1 kHz. The IF is divided into three sub-bands to allow frequency discrimination. A single LO signal is generated and then distributed to each receiver after amplification in the MMIC power amplifiers.
3.1 MMIC LNAs
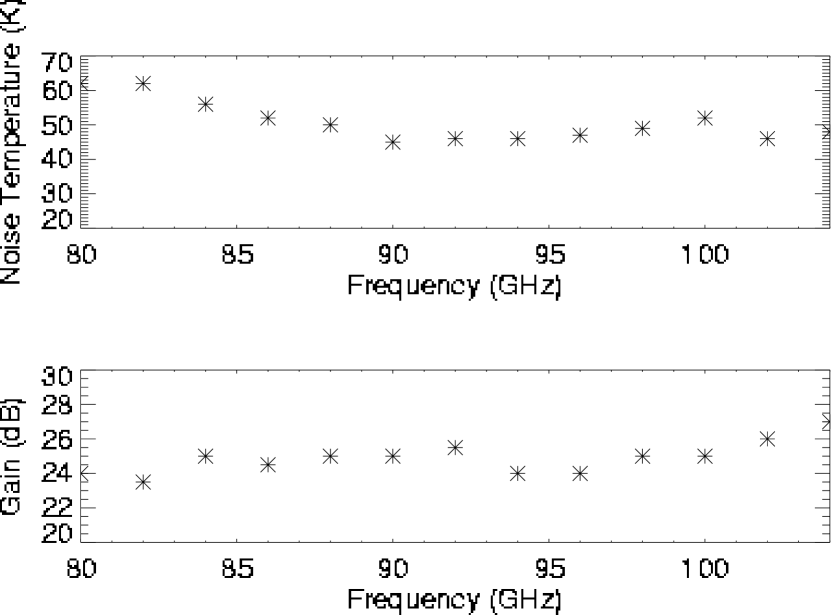
We take advantage of recent microwave technology developments by using a new generation of HEMT amplifier. We use MMIC LNAs and power amplifers developed, integrated, and tested at JPL (by Todd Gaier). We cascade two MMIC LNAs together to obtain the necessary gain. Figure 6 (right) shows the noise temperature and gain versus frequency for a typical MMIC cooled to 20K. Figure 3.1 (left) shows the distribution of noise and gains for the devices we have acquired so far. Note that 20dB of gain and less than 55K noise temperature are not uncommon.

3.2 Data Acquisition
The CAPMAP support electronics and data acquisition modules are all housed in the focal point cabin one meter away from the dewar. The vertex cab, support electronics, data acquisition module, and both dewar stages are temperature controlled. All such critical environmental and cryogenic temperatures are monitored and recorded at 1 Hz. All radiometer channels are synchronously sampled at 96 kHz using an ICS-610333http://www.ics-ltd.com/ data acquisition board. These data are then averaged down to 4 kHz, demodulated in software, and recorded at 100 Hz. For this season, the azimuth scan rate was one beam per 0.3 seconds.
4 CONCLUSION
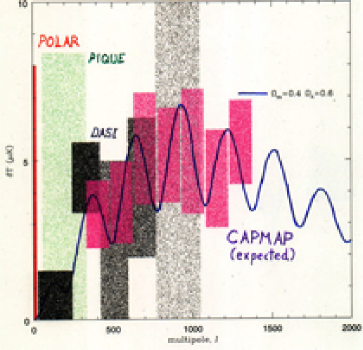
CAPMAP complements MAXIPOL, B2K, CBI, DASI, and MAP in frequency coverage, experimental technique and angular resolution. An example of the sensitivity of CAPMAP to CMB polarization anisotropy is given in Figure 7. For this season, four receivers were deployed and observed during fair weather between January 16 and April 30, 2003 with sensitivities near the predicted ones based on 100 K system noise and 14 GHz bandwidth. As indicated in Figure 3, the beams are symmetric with acceptable sidelobes. Results from this first campaign will be detailed in a forthcoming publication. We expect to deploy the full 16 element array in early November 2003.
4.1 Acknowledgements
CAPMAP is a collaborative effort involving researchers at various institutions: Jeff McMahon, Phil Farese, Suzanne Staggs, and myself at Princeton University; Keith Vanderlinde, Colin Bischoff, Matthew Hedman, Dorothea Samtleben, and Bruce Winstein at University of Chicago; Eugenia Stefanescu and Josh Gundersen at University of Miami; and Todd Gaier at JPL.
This work was supported by the NSF grants #PHY-0099493 , #PHY-9984440, #PHY-0114422.
References
- Chu et al. (1978) Chu, T. S., Wilson, R. W., England, R. W., Gray, D. A., Legg, W. E, The Bell Labs Technical Journal, Vol. 57, No. 5, May-June 1978
- Masi et al. (2002) Masi, S. et al. 2002, AIP Conf. Proc. 609: Astrophysical Polarized Backgrounds, 122
- Richards et al. (2002) Richards, P. L. et al. 2002, AIP Conf. Proc. 616: Experimental Cosmology at Millimetre Wavelengths, 12
- Hedman et al. (2001) Hedman, M. M., Barkats, D., Gundersen, J. O., Staggs, S. T., & Winstein, B., 2001, ApJ, 548, L111-L114
- Hedman et al. (2002) Hedman, M. M., Barkats, D., Gundersen, J. O.,McMahon,J. J., Staggs, S. T., & Winstein, B., 2002 ApJ, 573, L73-L76
- Staggs et al. (2002) Staggs, S. T., Barkats, D., Gundersen, J. O., Hedman, M. M., Herzog, C. P., McMahon, J. J., & Winstein, B. 2002, in AIP Conf. Proc. 609: Astrophysical Polarized Backgrounds, 183
- O’dell et al. (2002) Christopher W. O’Dell, Brian G. Keating, Angelica de Oliveira-Costa, Max Tegmark, Peter T. Timbie, 2002, astro-ph/0212425
- Kovac et al. (2002) Kovac, J. M., Leitch, E. M., Pryke, C., Carlstrom, J. E., Halverson, N. W., & Holzapfel, W. L. 2002, Nature, 420,
- (9) GRASP8 Code: http://www.ticra.com