Chapter 1 TeV Observations of the Galactic Center
Abstract
We present the results of 16 hours of ongoing observations of the galactic center region (including Sagittarius A*) with the Whipple High Energy Gamma-Ray Telescope. We apply a data analysis method optimized for large zenith angle observations on an independent Crab Nebula data set. We discuss possible systematic problems associated with observations of extended sources in the galactic plane.
1. Introduction
The Galactic Center is a complicated region containing sources which show emission in radio through x-ray wavelengths. The region also contains one of the brightest EGRET unidentified sources (2EG J1746-2852), which may to be slightly offset from Sgr A* [3]. Recent X-ray observations (with Chandra) indicate flaring activity, motivating the possibility that the black hole at the position of Sgr A* powers a nearby low-luminosity AGN-like source. Multi-wavelength observations of the galactic center at TeV energies might provide data allowing us to test models for off-axis emission from low-luminosity, low accretion rate sources without the effects of intergalactic IR absorption. The galactic center is also the most likely place to look for gamma rays from neutralino dark-matter annihilation if the galactic halo has a cusp that extends down to scales of parsecs from the center [1].
We have continued observations of the galactic-center region around Sgr A* with the Whipple 10 m gamma-ray telescope resulting in an additional on-source exposure of 16 hours over the 2000 to 2003 observing seasons [5]. In independent observations from 1995 to 1997 using a lower resolution camera, the source was not detected, although a excess was observed near the approximate position of Sgr A* after 4.5 hours of observation [2]. Though no signal was seen in our 2001 results, we have since re-analyzed all of the data taken with the high resolution camera.
2. Method
Whipple gamma ray data are traditionally taken as a series of 28 minute exposures, each of which is followed by an off-source run which is offset 30 minutes in right ascension for background subtraction. In the case of Sgr A*, data was taken off-source before the on-source observations due to a bright star field in the region past the galactic center’s position. Both on and off source data are analyzed in the same manner, and Gaussian padding is used to bring the background noise up to the same level in both runs to take care of brightness differences. For each event in the data, the Čerenkov light image of an air shower is characterized by a standard set of parameters originally defined by A. M. Hillas [4]. Cuts on these parameters allow the rejection of background (e.g. cosmic-ray induced showers).
Since Sgr A* transits at a zenith angle of about at the latitude of the Whipple Observatory, an analysis technique which scales with zenith angle and the logarithm of the shower size (Zcuts) was used to correct for the geometry at low elevation. This technique was outlined previously in the ICRC 2001 proceedings [5]. Cuts were optimized on a large database containing hours of Crab Nebula observations.
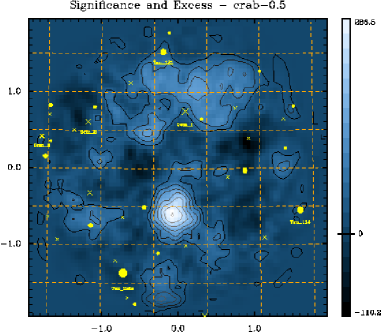
To produce a 2-D image, we reconstruct the two possible points of origin based on the elongation of the elliptical shower image and select the correct one based on the shower asymmetry. Analysis providing a two-dimensional map of the gamma ray emission was required in this case due to the uncertainty in the exact position of the source and pointing error when the telescope is at low elevation. To test our point-of-origin reconstruction technique, we analyzed data taken from the Crab Nebula during which the telescope was offset by in declination. A plot of data (not from the optimization set) showing the Crab Nebula offset in the field of view is shown in Figure LABEL:008843-2:fig:crab
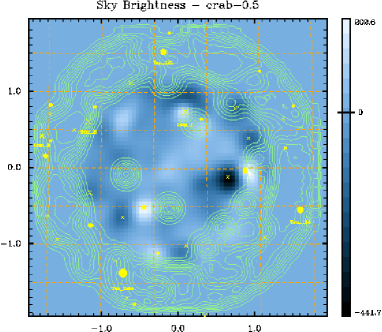
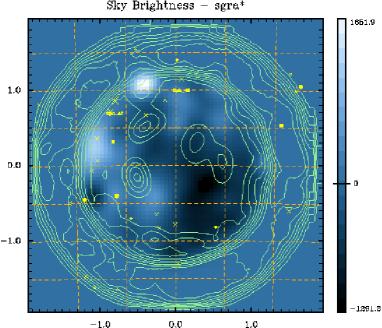
To accurately determine the telescope’s pointing and to characterize any systematic effects from bright stars, we generate a 2-D brightness map of the sky using the pedestal variances of each photo-tube in the camera. This in effect produces a low-resolution optical image of area of the sky which we then compare to a database of known star positions. For further characterization of systematic error, we also generate a cumulative 2-D plot which shows areas of the field of view which are affected by photo-tubes which have been turned off (due to a bright star in the field or malfunction). An example of these maps is shown in Figure LABEL:008843-2:fig:crab
3. Results
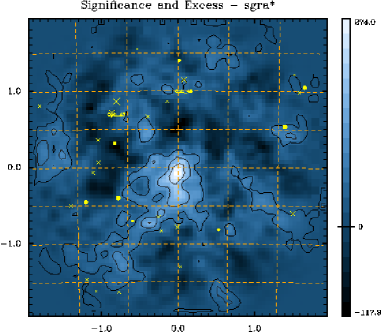
We have analyzed 16 hours of data taken with the telescope pointed at Sgr A*. We see an excess of an excess of at the center of the field of view (see Figure LABEL:008843-2:fig:sgra). The approximate energy threshold for these observations is [6]. We considered three positions in the field of view as potentially interesting: the position of Sgr A* (), the EGRET source () [3], and the excess seen in previous observations [2]. The excess does not take into account the trials factor associated with these three possibilities. Significant systematic errors might be present due to the large zenith-angle of the observations. Pointing checks show that there is a error in the camera’s position at low elevation. To check the significance of the excess, we are in the process of analyzing the data using other 2-D analysis programs. Corrections for pointing errors and a detailed spectral analysis of the data is currently under way and will be presented at the conference.
4. Discussion
More data of the Galactic Center are currently being taken and further analysis is under way. If there is a gamma ray source, Southern hemisphere telescopes with their reduced energy thresholds should be able to readily detect it, but the LZA observations presented here provide a larger effective area at high energies. These observations provide constraints on models for the X-ray flaring, as well as better constraints on annihilation of high energy neutralinos at the Galactic Center.
Bibliography
- [1] Bergström, L., P. Ullio, and J. H. Buckley, 1998, Astropart Phys, 9, 137-162.
- [2] Buckley, J.H. et al. 1997, Proceedings of 25th ICRC (Durban), 3, 237.
- [3] Hooper, D. and B. Dingus, 2002, astro-ph/0212509.
- [4] Hillas, A. M., 1985. Proceedings of 19th ICRC (La Jolla), vol 3.
- [5] Kosack, K. et al. 2001, Proceedings of 27th ICRC (Hamburg),7,2989.
- [6] Petry, D., 2001. Proceedings of 27th ICRC (Hamburg), 7, 2848.