A Hard Medium Survey with ASCA. IV.: the Radio-Loud Type 2 QSO AX J0843+2942
We discuss the X-ray, optical and radio properties of AX J0843+2942, a high luminosity Type 2 AGN found in the ASCA Hard Serendipitous Survey. The X-ray spectrum is best described by an absorbed power-law model with photon index of = and intrinsic absorbing column density of = cm-2. The intrinsic luminosity in the 0.5 – 10 keV energy band is ergs s, well within the range of quasar luminosities. AX J0843+2942, positionally coincident with the core of a triple and strong ( Jy; erg s-1 Hz-1) radio source, is spectroscopically identified with a Narrow Line object (intrinsic FWHM of all the permitted emission lines km s-1) at z=0.398, having line features and ratios typical of Seyfert-2 like objects. The high X-ray luminosity, coupled with the high intrinsic absorption, the optical spectral properties and the radio power, allow us to propose AX J0843+2942 as a Radio-Loud “Type 2 QSO”. A discussion of the SED of this object is presented here together with a comparison with the SED of Ultra Luminous Infrared Galaxies, other “Type 2 QSO” candidates from the literature, and “normal” Radio-Quiet and Radio-Loud QSOs.
Key Words.:
Galaxies:active – quasars:individual:AX J0843+2942 – X-rays:galaxies – X-rays:individual:AX J0843+29421 Introduction
It is now largely accepted that X-ray obscured AGN play a significant (and perhaps major) role in the production of the Cosmic X-ray Background (CXB) above 2 keV (Comastri et al., 1995; Gilli et al., 2001). These objects should be the site where a large fraction of the energy density of the universe is generated (e.g. Fabian and Iwasawa, 1999). In particular, the CXB synthesis models predict a large density of high luminosity (L ergs s) X-ray obscured ( cm-2) AGN which, according to the Unified Model of AGN, should be characterized only by highly ionized narrow emission lines in the optical domain (the so called Type 2 QSO). Although doubts are often cast on the existence of “Type 2 QSO” (see e.g. Halpern, Turner & George, 1999; Akiyama et al., 2000), it is clear that hard X–ray surveys, which are less affected by the photoelectric absorption, should provide a fundamental tool to detect and to study this elusive class of sources. In spite of these considerations, the number of high luminosity, X-ray obscured AGN in spectroscopically complete hard ( keV) X-ray selected samples is still very low. For instance there are no type 2 QSO amongst the 34 sources of the ASCA Large Sky Survey, which is a spectroscopically identified and complete sample in the 2-10 keV energy range (Akiyama et al., 2000). A few type 2 QSO “candidates” have been found using ASCA (Ohta et al., 1996; Akiyama, Ueda and Ohta, 2002) and ROSAT data (Almaini et al., 1995; Barcons et al., 1998; Georgantopoulos et al., 1999). Some of them have been recently discovered in Chandra and XMM medium-deep surveys (Dawson et al., 2001; Crawford et al., 2002, Stern et al., 2002; Norman et al., 2002; Mainieri et al., 2002). Although these results seem to challenge the CXB synthesis model predictions, further X–ray spectroscopic investigations are needed.
According to the Unification Scheme of AGNs, a still unsettled fraction of the radiation emitted by the central engine is absorbed by the circumnuclear medium and re-emitted in the NIR/submillimeter bands. As a consequence, X-ray obscured AGN could also produce a significant fraction of the infrared background (Franceschini et al., 2002). In this respect it is worth noting that Type 2 QSO candidates have been also selected in the infrared domain amongst the ultra- and hyper-luminous infrared galaxies (e.g. IRAS 09104+4109, Franceschini et al., 2000; Iwasawa, Fabian and Ettori, 2001). A detailed investigation of their Spectral Energy Distribution (SED) is thus mandatory to tackle many questions of the modern physical cosmology.
In this paper we discuss a Type 2 QSO, found in the ASCA Hard Serendipitous Survey (HSS, Cagnoni, Della Ceca and Maccacaro, 1998; Della Ceca et al., 1999; Della Ceca et al., 2000a,b), for which we have enough statistics to perform a broad band (1 - 10 keV) X-ray spectral analysis. The object discussed here is also a strong radio source and it could have been classified as a Narrow Line Radio Galaxy, a class of “potentially” obscured AGN (see Fabian, Crawford & Iwasawa, 2002; Derry et al., 2003 for X-ray observations of powerful radio galaxies) well known from radio surveys and which has been studied up to (van Breugel et al., 1999; see also McCarthy 1993 for a review). AX J0843+2942 is thus representative of the radio-loud tail of the type 2 quasar population.
The paper is organized as follows. In Section 2 we present the X-ray data and their analysis. In Section 3 we report the optical identification, as well as the X-ray, optical and radio properties of AX J0843+2942. Section 4 presents a discussion of the SED of AX J0843+2942 as well as the comparison with the SED of Ultra Luminous Infrared Galaxies, other “Type 2 QSOs”, and “normal” Radio-Quiet (RQ) and Radio-Loud (RL) QSOs from the literature. Finally, summary and conclusions are given in Section 5. We use km s-1 Mpc-1 and throughout.
2 X-ray Data and Analysis
AX J0843+2942 was discovered during the optical identification process of the X-ray sources in the ASCA (2-10 keV energy range) HSS. The survey uses the data from the GIS2 instrument onboard ASCA (Tanaka, Inoue and Holt, 1994). The source attracted our attention because of its position in the hardness ratio diagram (cf. Della Ceca et al., 1999) indicative of a hard X-ray source. The data preparation for the X-ray spectral analysis was performed as in Della Ceca et al. (2000a) and is summarized below.
To maximize statistics and signal-to-noise ratio, total counts (source + background) were extracted from a circular region of 2′ radius around the source centroid in the GIS2 and GIS3 images. Background counts were taken from two circular, source-free regions of 4′.75 radius close to the source. GIS2 and GIS3 data, along with the relative background files and calibrations, were combined following the recipe given in the ASCA Data Reduction Guide 111 see http://heasarc.gsfc.nasa.gov/docs/asca/abc/abc.html. The combined GIS spectrum was rebinned in order to have a signal-to-noise ratio greater than 3 in each energy channel; the energy interval with useful data is from 0.9 to 10 keV. Unfortunately, there are no ASCA SIS data associated to AX J0843+2942 since the source falls outside the SIS field of view. Spectral analysis has been performed using XSPEC 11.01. All the models discussed below have been filtered by the Galactic absorption column density along the line of sight ( cm-2; Hartmann & Burton, 1997). Unless explicitly quoted, all the errors on the fitted spectral parameters represent the 68% confidence level for 1 interesting parameter (). Basic information for AX J0843+2942 is given in Table 1.
| ASCA Seq. | RA; DEC (J2000) X | Exp.(s) | HR1 | Cts/s |
| RA; DEC (J2000) Opt. | S/N | HR2 | Optical ID | |
| (1) | (2) | (3) | (4) | (5) |
| 82011000 | 08 43 13; 29 42 46 | 76585 | ||
| 08 43 10; 29 44 05 | 10.2 | Type 2 QSOs at z=0.398 |
NOTE – Columns are as follows: (1) ASCA Sequence number; (2) Source position as obtained from the centroid of the X-ray emission using the original astrometry from the ASCA GIS2 image and, second line, the position of the optical counterpart of the X-ray source from the POSS II image; (3) Exposure time (GIS2 + GIS3) of the observation and, second line, source Signal-to-Noise ratio in the 2-10 keV energy range from the ASCA HSS catalog; (4) Hardness Ratio HR1 and, second line, HR2 obtained using the measured counts in the , and keV energy range (see Della Ceca et al., 1999); (5) Net source count rate in the keV energy band and, second line, identification of the optical counterpart. The source count rate represents about 66% of the total counts in the source extraction region.
3 AX J0843+2942: a type 2 quasar candidate
3.1 X-ray Spectrum
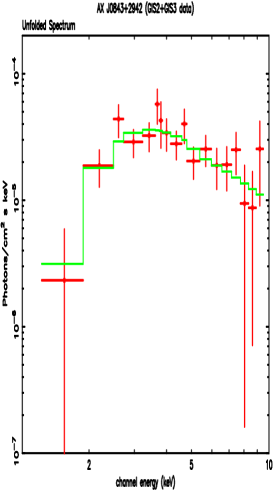
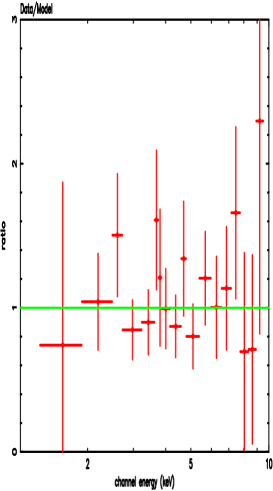
A single absorbed power-law model at the redshift of the optical counterpart (z=0.398; see Section 3.3) provides a good description of the ASCA spectrum of AX J0843+2942. The unfolded X-ray spectrum and the ratio between the data and the best fit model are shown in Figure 1. No emission lines or absorption edges of statistical significance are found superimposed on the power law continuum. The 90% upper limit on the Fe Kα line equivalent width at 6.4 keV (rest frame) is eV; this upper limit is consistent with the Fe Kα line equivalent width expected to be produced by trasmission in the same medium which absorbes the continuum (cfr. Lehly & Creighton, 1993). Best fit spectral parameters, along with the observed fluxes and intrinsic luminosities in the (0.5 – 2) keV and (2 – 10) keV energy range, are reported in Table 2.
| Flux | Lx | /dof | ||
| cm-2 | erg cm-2 s-1 | erg s-1 | ||
| (1) | (2) | (3) | (4) | (5) |
| 0.09; 14.2 | 10.7; 18.9 | 0.59/15 |
NOTE – Allowed ranges are at 68% confidence level for one interesting parameter (). Columns are as follows: (1) Power-law photon index; (2) Intrinsic absorbing column density; (3) Observed flux (de-absorbed from the Galactic value) in the 0.5-2 and 2-10 keV energy band; (4) Intrinsic luminosity (i.e. the luminosity emitted from the nucleus) in the 0.5-2 and 2-10 keV energy band; (5) Reduced and degrees of freedom.
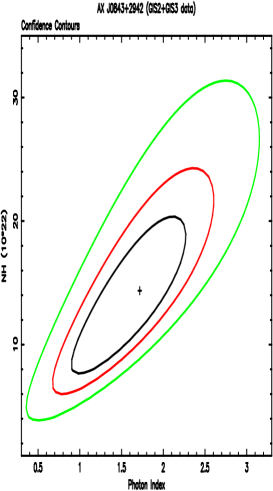
In Figure 2 we show the confidence contours for the photon index () and the rest frame absorbing column density (). While is not well constrained (the 90% confidence range is between 0.7 and 2.6), the best fit is cm-2, with a 90% confidence range between cm-2 and cm-2, and a 99% confidence level lower limit of cm-2. AX J0843+2942 is clearly an absorbed object; about 99.99% and 50% of the intrinsic rest-frame luminosity in the 0.5-2.0 keV and 2-10 keV energy band is absorbed. The intrinsic rest-frame luminosity ( ergs sat z=0.398, see Section 3.3) is well within the “High-Luminosity - QSO” regime. The combination of high luminosity, high intrinsic absorption and optical spectral properties (see Section 3.3) allow us to classify AX J0843+2942 as an X-ray obscured “Type 2 QSO”.
3.2 Source Identification
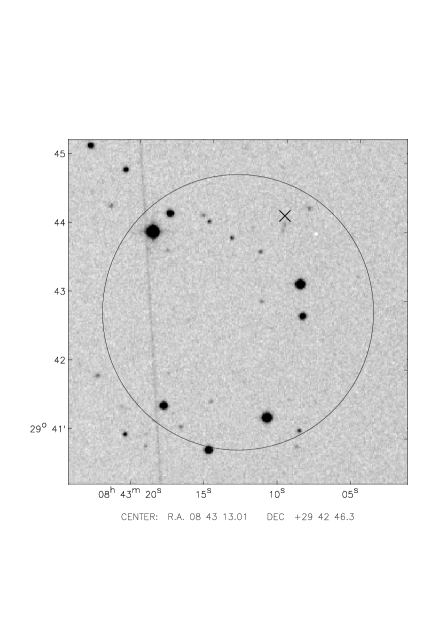
Figure 3 shows the Palomar Observatory Sky Survey II (POSS II) image centered on the nominal X-ray position of AX J0843+2942 and its 90% error circle of 2′ radius. The cross marks the corrected X-ray position of AX J0843+2942, obtained by applying to the source the same offset measured for the target of the ASCA observation. 222The target of this observation was MS0839.8+2938, an X-ray selected cluster of galaxies at z=0.194. We have determined the sky position of the bulk of its X-ray emission using the ROSAT HRI observation rh800159. Unfortunately AX J0843+2942 is on the border of this ROSAT HRI observation (at about 16 arcmin offaxis) and is not detected.
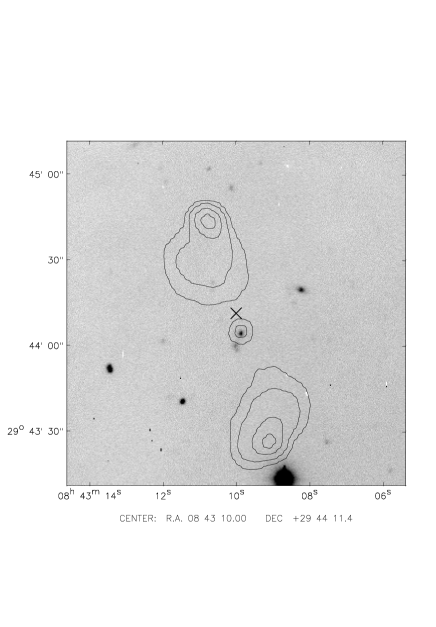
In Figure 4 we show the optical image centered at the corrected ASCA position (cross) with overlaid radio contours from the FIRST survey 333http://sundog.stsci.edu/ (Becker et al., 1995; White et al., 1997). The brightest optical object close to the X-ray position is positionally coincident with the core of a triple radio source having a total flux density (1.4 GHz) of Jy; the properties of this radio source are discussed in Section 3.4. The probability to have a radio source with a flux Jy inside a circle of 2′ radius is (Condon et al., 1998), which implies 0.03 spurious coincidences among the 188 ASCA HSS sources. Therefore we conclude that the X-ray and the radio emission are very likely to be related and are both due to the same object, i.e. the object positionally coincident with the core of the radio source (see Figure 4). Optical, near infrared and far infrared photometry of this object are reported in Table 3.
| Band | Frequency | Observed Flux Density | Ref | |||
|---|---|---|---|---|---|---|
| Hz | erg cm-2 s-1 | erg s-1 | ||||
| Radio | 178 MHz | Jy | (1) | |||
| Radio (NVSS) | 1.4 GHz | mJy | (2) | |||
| Radio | 4.85 GHz | mJy | (3) | |||
| Far-Infrared (IRAS) | 100m | Jy | (4) | |||
| Far-Infrared (IRAS) | 60m | Jy | (4) | |||
| Far-Infrared (IRAS) | 25m | Jy | (4) | |||
| Far-Infrared (IRAS) | 12m | Jy | (4) | |||
| Infrared (2MASS) | K | mag | (5) | |||
| Infrared (2MASS) | H | mag | (5) | |||
| Infrared (2MASS) | J | mag | (5) | |||
| Optical | E | mag | (6) | |||
| Optical | 0 | 21 mag | (6) | |||
| X-ray (ASCA) | 1.6 keV | keV cm-2 s-1 keV-1 | (7) | |||
| X-ray (ASCA) | 5.1 keV | keV cm-2 s-1 keV-1 | (7) | |||
| X-ray (ASCA) | 9.2 keV | keV cm-2 s-1 keV-1 | (7) |
Note: The quoted luminosities have been K-corrected assuming the observed spectral indices in the radio (), IR-optical () and X-ray () domain. References: (1) Pillington & Scott., 1965; (2) total flux density from the NVSS survey (Condon et al., 1998); (3) Gregory & Condon, 1991; (4) the upper limits derive from the IRAS Faint Source Catalog v2.0. The detection at 25m is at S/N=3 and derives from the ADDSCAN processing of IRAS data; (5) from the 2MASS survey (see http://www.ipac.caltech.edu/2mass/); (6) from the APM catalogue and corrected for blending; (7) this work.
3.3 Optical Spectroscopy
The optical object coincident with the core of the radio source was observed spectroscopically at the 88” telescope of the University of Hawaii on February 12th, 2000. Two 20-minute exposures were taken using the Wide Field Grism Spectrograph (WFGS) equipped with the “blue” grism (400 grooves/mm) which gives a dispersion of 4.1 Å/pixel.
The spectrum has been wavelength and flux calibrated using a Hg-Cd-Zn reference spectrum and the photometric standard SAO98781, respectively. No attempts have been made in order to have an absolute calibration of the final spectra. For the data reduction we have used the IRAF longslit package. The resulting spectrum, which is the sum of the two exposures, is presented in Figure 5, while in Table 4 we report optical line properties.
The widths (FWHM) of the permitted lines are all below 1200 km s-1, suggesting a spectroscopic classification of the object as a Narrow Emission Line object. The dominance of the [OIII]5007 when compared to the H ([OIII]5007/H=10) excludes the classification as starburst or HII-region galaxy. The high [OIII]/H ratio and the lack of evident Fe II lines exclude also the classification of AX J0843+2942 as Narrow Line Seyfert 1 (NLS1) whose optical spectrum are characterized by relatively weak forbidden lines ([OIII]5007/H 3) and strong Fe II multiplets (Osterbrock & Pogge 1985). The analysis of the H profile does not reveal any strong evidence of a broad wing underlying the narrow component, although a better resolution spectrum is necessary to exclude completely the presence of a broad H component.
In conclusion, AX J0843+2942 is optically classified as Seyfert 2-like object or, more appropriately, as an X-ray obscured type 2 QSO given its high X-ray luminosity and intrinsic absorption.
| Line | Position | z | EW | FWHM |
|---|---|---|---|---|
| (observed) | (rest) | |||
| Å | Å | km s-1 | ||
| (1) | (2) | (3) | (4) | (5) |
| NeV | 4792 | 0.3987 | 80 | 1400 |
| OII | 5211 | 0.3982 | 85 | 1050 |
| NeIII | 5408 | 0.3978 | 90 | 1300 |
| H | 5549 | 0.3977 | 30 | 1200 |
| H | 5729 | 0.397: | 14 | |
| H+OIII | 6070/6102 | 0.399: | 85 | |
| HeII | 6548 | 0.397: | 11 | 1200 |
| H | 6798 | 0.3985 | 30 | 850 |
| OIII | 6934 | 0.3983 | 90 | 750 |
| OIII | 7001 | 0.3982 | 300 | 750 |

3.4 Radio Properties
The radio counterpart of AX J0843+2942 is a triple radio source having the typical Fanaroff-Riley type II morphology, i.e. sharp edged lobes and bright hot spots (see Figure 4) . The absolute optical magnitude () and the total radio power ( ergs sHz-1, see below) are consistent with the FRII classification according to the dividing line in the plane between FRI and FRII radio galaxies (Ghisellini and Celotti, 2001 and references therein).
The total 1.4 GHz radio flux from the FIRST survey is mJy corresponding to a radio power of erg s-1 Hz-1 at the redshift of the source; the core flux density (power) is mJy ( erg s-1 Hz-1). The source is also detected in the lower spatial resolution NVSS survey 444http://info.cv.nrao.edu/jcondon/nvss.html (Condon et al., 1998) as a double radio source. The total NVSS flux density (radio power) is mJy ( erg s-1 Hz-1). The radio flux density from the NVSS is a more reliable measure of the total flux since the VLA-B configuration used for the FIRST survey could miss some of the diffuse extended emission. This radio source has been also detected at 178 MHz (4C +29.31, Pilkington & Scott, 1965) and at 4.85 GHz (Gregory & Condon, 1991). Assuming a power-law model the radio spectral index between 178 MHz and 4.85 GHz is , consistent with the typical radio spectral index of lobe-dominated AGN. Total radio flux densities and powers are reported in Table 3. The projected separation of the two bright hot spots is arcsec on sky, corresponding to a physical projected size of 0.57 Mpc at the redshift of the source; the ratio between the core flux and the total flux is about 0.021. Given the discussed radio properties, the object is clearly a radio-loud and lobe-dominated AGN. In this respect we note that the measured size is comparable with the size of the known giant radio galaxies studied by Lara et al. (2001) and Schoenmakers et al. (2001).
4 Discussion
It is interesting to compare the SED of AX J0843+2942 with the SED of other classes of AGNs to see if there are similarities and/or differences. In particular we are interested in the comparison with the classes of AGNs where absorption effects can strongly modify their appearance and classification depending on the observational wavelength. Photometric data used to construct the SED of AX J0843+2942 have been summarized in Table 3.
Particular care must be taken on how to normalize the observed SEDs since many of the objects discussed below are either affected by heavy absorption (which modifies the intrinsic SEDs) or contaminated (and even dominated) by the possible starburst contribution, particularly in the infrared domain. Indeed there is now strong evidence that the processes of star-formation and AGN emission mostly happen in a high-density medium ( cm-2), characterized by high dust extinction of the UV-optical flux and strong photoelectric absorption of the soft X-rays (see e.g. Levenson et al., 2001; Iwasawa 1999 and reference therein).
The first comparison (Figure 6) is with three well known local AGN: the ultraluminous infrared galaxy (ULIRG hereafter) NGC 6240 ( ergs sat z=0.0245), the nearby far-infrared galaxy NGC 4945 ( ergs sat z=0.00187) and the powerful radio-galaxy Cygnus A ( ergs sat z=0.0562).
![[Uncaptioned image]](/html/astro-ph/0305505/assets/x7.png) |
![[Uncaptioned image]](/html/astro-ph/0305505/assets/x8.png) |
![[Uncaptioned image]](/html/astro-ph/0305505/assets/x9.png) |
|
NGC 6240 555 A recent Chandra observation of NGC 6240 has revealed the presence of two active galactic nuclei of comparable luminosity in the core of this object (Komossa et al., 2003). In the following discussion we will consider the integrated emission from the two nuclei. and NGC 4945 have been classified as LINER and/or starburst galaxies on the basis of optical (Veilleux et al. 1995) and mid-/far-IR (Genzel et al. 1998) spectroscopy. For both objects, however, the BeppoSAX PDS observations at keV have clearly revealed the presence of a deeply buried AGN ( few cm-2) with a QSO-like intrinsic luminosity in the case of NGC 6240 (ergs s; Vignati et al. 1999) and a Seyfert-like luminosity in the case of NGC 4945 (ergs s; Guainazzi et al. 2000). Cygnus A is a nearby and powerful radio galaxy having a compact nucleus which is well described, in the X-ray domain, by an absorbed ( cm-2) power law spectrum. Its unabsorbed luminosity ( erg s-1) is in the QSOs range (Young et al., 2002).
The comparison of these three objects with AX J0843+2942 is shown in Figure 6a (NGC 6240), in Figure 6b (NGC 4945) and in Figure 6c (Cygnus A). The SED of NGC 6240, NGC 4945 and Cygnus A have been tied to that of AX J0843+2942 under the hypothesis that the nuclear and intrinsic AGN emission emerges above keV 666It is worth noting that when a column density exceeds cm-2, even the high-energy continuum (i.e., above the absorption cut-off) will be suppressed significantly by Compton down-scattering (see Matt et al. 1999). This is a geometry-dependent effect; the suppression is larger as the covering fraction of the absorber is smaller. Therefore the intrinsic power-law continuum could be somewhat higher (e.g., 20-50 per cent for cm-2) in Compton-Thick objects, NGC6240, NGC4945, and IRAS 09104+4109 (see Figure 7a for this latter object). .
 |
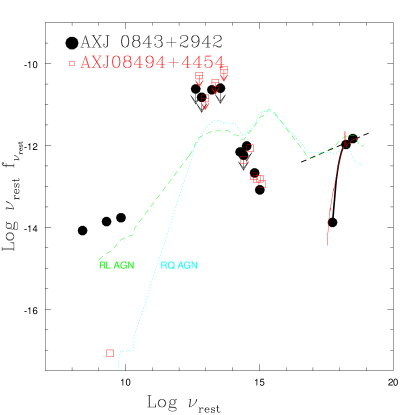 |
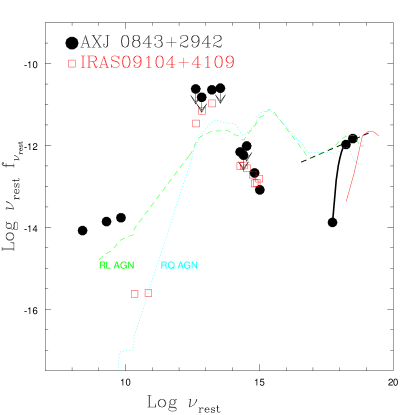
The second comparison (shown in Figure 7a, and 7b) is with the SED of distant type 1 and type 2 AGN. The SED of “normal” type 1 RL and RQ QSOs (labeled in Figure 7a,b) are taken from Elvis et al., 1994. As for the distant type 2 QSOs we have used two objects for which enough photometric data are available to investigate their broad band properties over a large energy range ( 10 decades in frequency) and a firm measure of the intrinsic AGN spectra above 20 keV is also available. The two objects are IRAS09104+4109 and AX J08494+4454.
IRAS09104+4109, the most luminous object in the Universe, is an ULIRG ( ergs s) at z=0.442. BeppoSAX observations (Franceschini et al., 2000; see also Iwasawa, Fabian and Ettori, 2001 for the Chandra observation) have allowed the investigation of this source up to keV, and have clearly revealed the presence of a deeply buried AGN. The absorbing column density towards the nucleus is cm-2 and the unabsorbed (2-10) keV X-ray luminosity is erg s-1, which is within the range of quasar luminosities.
AX J08494+4454 is a type 2 QSOs candidate at found in the course of the optical identification of ASCA deep surveys in the Lynx field (Ohta et al., 1996). The 0.5 - 10 keV Chandra spectrum is hard and is well described by a power law continuum absorbed by an hydrogen column density of cm-2; the unabsorbed luminosity in the 2-10 keV energy range is ergs s(Akiyama, Ueda and Ohta, 2002). Recent deep Subaru/IRCS J-band spectroscopic observations seem to suggest the presence of a broad component at the bottom of the narrow emission line, implying that AX J08494+4454 could be a luminous cousin of Seyfert 1.9 objects (Akiyama, Ueda and Ohta, 2002).
The SED of Type 1 RL and RQ QSOs have been normalized to the intrinsic “unabsorbed” flux of AX J0843+2942 at keV. The SED of IRAS09104+4109 and AX J08494+4454 have been tied to that of AX J0843+2942 under the hypothesis that their emission above keV represents the intrinsic AGN emission.
As expected, both the local and the distant absorbed AGN in figure 6 and in figure 7 lack the optical-UV bump which characterizes the “normal” Type 1 QSOs. However they show a very similar behavior in the optical-infrared regime despite their different X-ray absorbing column density towards the nucleus (ranging from to cm-2). The only object which deviates significantly is NGC 6240 in the optical and near-IR bands; for this object the optical near-IR photometric points were taken from NED and are usually measured with large apertures (K. Iwasawa, private communication). Two additional objects (CDF-S 202: a type 2 QSO at z=3.7 from Norman et al., 2002; and CXO52: a type 2 QSO at z=3.288 from Stern et al., 2002) show a similar behaviour although it is difficult to evaluate the real “intrinsic” spectrum given the poor X-ray statistics.
We tried to reproduce the near-infrared and optical colors of AX J0843+2942 assuming a “typical” QSO spectra template (continuum plus emission lines, adapted from Elvis et al., 1994 and Francis et al., 1991) and the extinction curve from Cardelli et al. (1989). A good description of the infrared-optical colors of AX J0843+2942 is obtained assuming . Provided that the X-ray and optical/NIR emission come from the same region (which may not be necessarily true), the implied is mag cm2, a factor about 40 less than the Galactic standard value of mag cm2 (Bohlin et al., 1978). This is a well know problem since the Einstein era (Maccacaro et al., 1982) and has been recently discussed by Maiolino et al. (2001) in the context of different dust properties in the circumnuclear region of AGNs.
Finally under the simple assumptions used by Norman et al. (2002; e.g. the black hole is generating X-rays with an efficiency of relative to the Eddington luminosity) we estimate a black hole mass of M⊙. This mass is similar to that measured in other steep spectrum radio quasars having a similar total radio power of AX J0843+2942 (Lacy et al., 2001). By estimating the nuclear radiative output (Lion) using the well established relation between the luminosity in narrow emission lines (believed to result from the photoinization by the nuclear accreting radiation) and the radio power, we obtain (cfr. Ghisellini & Celotti, 2001) ergs s. This value implies and an accretion rate relative to the Eddington accretion rate of 1.3 (assuming an efficiency of 0.1). These values are consistent with the statement of Ghisellini & Celotti (2001) that, for the same black hole mass, the FRII radio-galaxies have a higher accretion rate if compared with FRI type objects.
5 Summary and Conclusion
We have presented the X-ray, optical and radio properties of AX J0843+2942, a high luminosity Radio-Loud Type 2 AGN found in the ASCA Hard Serendipitous Survey. This source, positionally coincident with the core of a triple and strong ( Jy; erg s-1 Hz-1) radio source, is spectroscopically identified with a Narrow Line object (intrinsic FWHM of all the observed emission lines Km s-1) at z=0.398, with line features and ratios typical of Seyfert-2 like objects.
The X-ray spectrum is best described by an absorbed power-law model with photon index of = and intrinsic absorbing column density of = cm-2 (99% confidence level lower limit of cm-2). The intrinsic luminosity in the 0.5 – 10 keV energy band is ergs s, well within the range of quasar luminosities.
The high X-ray luminosity, coupled with the high intrinsic absorption, optical spectral properties and radio power allow us to classify AX J0843+2942 as an X-ray obscured Radio-Loud “Type 2 QSO”.
We find strong similarities in the SED of AX J0843+2942 and the SED of local absorbed AGNs and distant Type 2 QSO in the optical near-infrared regime, despite the very different X-ray absorbing column densities towards the nucleus.
The near-infrared and optical colors of AX J0843+2942 can be reproduced assuming a “typical” QSO spectrum template, , implying an that is a factor 40 less than the Galactic standard value.
The estimated black hole mass ( M⊙) is consistent with a relatively high accretion rate to power the bolometric luminosity of the QSO, in agreement with the dividing line between FRI and FRII type objects proposed by Ghisellini & Celotti (2001).
Acknowledgements.
We thank K. Iwasawa, M. Akiyama and A. Franceschini for providing the data, shown in figure 6 and 7, in a tabular form. This work received partial financial support from the Italian Ministry for University and Research (MURST) and from ASI (I/R/037/01). K.Iwasawa is also thanked for useful comments in the referee report. This research has made use of the NASA/IPAC extragalactic database (NED), which is operated by the Jet Propulsion Laboratory, Caltech, under contract with the National Aeronautics and Space Administration. We thank all the members of the ASCA team who operates the satellite and maintains the software data analysis and the archive.References
- (1) Almaini, O., Boyle, B. J., Griffiths, R. E., Shanks, T., Stewart, G. C., & Georgantopoulos, I. 1995, MNRAS, 277, L31
- (2) Akiyama, M., Ohta, K., Yamada, T., et al. 2000, ApJ, 532, 700.
- (3) Akiyama, M., Ueda, Y., & Ohta, K. 2002, ApJ, 567, 42
- (4) Barcons, X., Carballo, R., Ceballos, M. T., Warwick, R. S., & Gonzalez-Serrano, J. I. 1998, MNRAS, 301, L25.
- (5) Becker R. H., White R. L., Helfand D. J., 1995, ApJ 450, 559
- (6) Bohlin, R. C., Savage, B. D., & Drake, J. F. 1978, ApJ, 224, 132
- (7) Cagnoni I., Della Ceca R., & Maccacaro T., 1998, ApJ 493, 54
- (8) Cardelli, J. A., Clayton, G. C., & Mathis, J. S. 1989, ApJ, 345, 245
- (9) Condon J.J., Cotton W.D., Greisen E.W., et al., 1998, AJ 115, 1693
- (10) Comastri A., Setti G., Zamorani G. & Hasinger G., 1995, A&A 296, 1
- (11) Crawford, C. S., Gandhi, P., Fabian, A. C., Wilman, R. J., Johnstone, R. M., Barger, A. J., & Cowie, L. L. 2002, MNRAS, 333, 809
- (12) Dawson, S., Stern, D., Bunker, A. J., Spinrad, H., & Dey, A. 2001, AJ, 122, 598
- (13) Della Ceca R., Castelli G., Braito V., et al., 1999, ApJ 524, 674
- (14) Della Ceca, R., Maccacaro, T., Rosati, P., & Braito, V. 2000a, A&A, 355, 121
- (15) Della Ceca, R., Braito, V., Cagnoni, I., and Maccacaro, T. 2000b, Mem. SAIT., in press, astro-ph/0007430
- (16) De4rry, P.M., O’Brien, P.T., Revees, J.N., Ward, M.J., Imanishi, M., & Ueno, S. 2003, MNRAS, in press, astro-ph/0304550
- (17) Elvis, M., Wilkes, B.J., McDowell, J.C., et al. 1994, ApJ Supp. Ser., 95, 1
- (18) Fabian A.C., & Iwasawa K., 1999, MNRAS 303, L34
- (19) Fabian, A. C., Crawford, C. S., & Iwasawa, K. 2002, MNRAS, 331, L57
- (20) Franceschini, A., Bassani, L., Cappi, M., Granato, G. L., Malaguti, G., Palazzi, E., & Persic, M. 2000, A&A, 353, 910
- (21) Franceschini, A., Braito, V., & Fadda, D. 2002, MNRAS, 335, L51
- (22) Francis, P. J., Hewett, P. C., Foltz, C. B., Chaffee, F. H., Weymann, R. J., & Morris, S. L. 1991, ApJ, 373, 465
- (23) Genzel, R. et al. 1998, ApJ, 498, 579
- (24) Georgantopoulos, I., Almaini, O., Shanks, T., Stewart, G. C., Griffiths, R. E., Boyle, B. J., & Gunn, K. F. 1999, MNRAS, 305, 125
- (25) Gilli, R., Salvati, M., & Hasinger, G. 2001, A&A, 366, 407
- (26) Ghisellini, G. & Celotti, A. 2001, A&A, 379, L1
- (27) Gregory P. C., Condon J. J., 1991, ApJS 75, 1011
- (28) Guainazzi, M., Matt, G., Brandt, W. N., Antonelli, L. A., Barr, P., & Bassani, L. 2000, A&A, 356, 463
- (29) Halpern J.P., Turner T.J., & George I.M., 1999, MNRAS 307, L47
- (30) Hartmann D. & Burton W. B., 1997, “Atlas of Galactic Neutral Hydrogen”, Cambridge University Press, Cambridge, New York
- (31) Iwasawa, K. 1999, MNRAS, 302, 96
- (32) Iwasawa, K., Matt, G., Guainazzi, M., & Fabian, A. C. 2001, MNRAS, 326, 894
- (33) Iwasawa, K., Fabian, A. C., & Ettori, S. 2001, MNRAS, 321, L15
- (34) Komossa, S., Burwitz, V., Hasinger, G., Predehl, P., Kaastra, J. S., & Ikebe, Y. 2003, ApJLett, 582, L15
- (35) Lacy, M., Laurent-Muehleisen, S. A., Ridgway, S. E., Becker, R. H., & White, R. L. 2001, ApJ. Lett., 551, L17
- (36) Lara, L., Márquez, I., Cotton, W. D., Feretti, L., Giovannini, G., Marcaide, J. M., & Venturi, T. 2001, A&A, 378, 826
- (37) Leahy, D. A. & Creighton, J. 1993, MNRAS, 263, 314
- (38) Levenson, N. A., Weaver, K. A., & Heckman, T. M. 2001, ApJ, 550, 230
- (39) Maccacaro, T., Perola, G. C., & Elvis, M. 1982, ApJ, 257, 47
- (40) Mainieri, V., Bergeron, J., Hasinger, G., Lehmann, I., Rosati, P., Schmidt, M., Szokoly, G., & Della Ceca, R. 2002, A&A, 393, 425
- (41) Maiolino, R., Marconi, A., Salvati, M., Risaliti, G., Severgnini, P., Oliva, E., La Franca, F., & Vanzi, L. 2001, A&A, 365, 28
- (42) Matt, G., Pompilio, F., & La Franca, F. 1999, New Astronomy, 4, 191
- (43) McCarthy, P. J. 1993, ARAA, 31, 639
- (44) Norman, C., Hasinger, G., Giacconi, R., et al. 2002, ApJ, 571, 218
- (45) Ohta, K., Yamada, T., Nakanishi, K., Ogasaka, Y., Kii, T., and Hayashida, K., 1996, Ap.J., 458, L57.
- (46) Osterbrock D. E., Pogge R. W., 1985, ApJ 297, 166
- (47) Pilkington J. D. H., Scott P. F., 1965, MmRAS 69, 183
- (48) Schoenmakers, A. P., de Bruyn, A. G., Röttgering, H. J. A., & van der Laan, H. 2001, A&A, 374, 861
- (49) Stern, D., Moran, E.C., Coil, A.L., et al. 2002, ApJ, 568, 71
- (50) Tanaka Y., Inoue H. & Holt S. S., 1994, PASJ 46, L37
- (51) Vignati, P. et al. 1999, A&A, 349, L57
- (52) White R. I., Becker, R. H., Helfand D. J., Gregg M. D., 1997, ApJ 475, 479
- (53) van Breugel, W., De Breuck, C., Stanford, S. A., Stern, D., Röttgering, H., & Miley, G. 1999, Ap.J. Lett., 518, L61
- (54) Veilleux, S., Kim, D.-C., Sanders, D. B., Mazzarella, J. M., & Soifer, B. T. 1995, ApJS, 98, 171
- (55) Vignati, P., Molendi, S., Matt, G., et al. 1999, A&A, 349, L57
- (56) Young, A. J., Wilson, A. S., Terashima, Y., Arnaud, K. A., & Smith, D. A. 2002, ApJ, 564, 176