11email: m.a.thompson@kent.ac.uk, g.h.macdonald@kent.ac.uk
A molecular line survey of the candidate massive Class 0 protostar IRAS 23385+6053
We have carried out a molecular line survey of the candidate massive protostar IRAS 23385+6053, covering a 27.2 GHz frequency range in the 330–360 GHz atmospheric window. We detected 27 lines originating from a total of 11 species. Over a third of the identified molecular lines are from the asymmetric top molecule methanol (CH3OH). We did not detect any emission from high-excitation lines or typical hot core tracers (e.g. CH3CN, HCOOCH3). We derive a rotation temperature and column density from the methanol emission and estimate lower limits to the beam-averaged column density of the remaining lines. Upper limits to the beam-averaged column density of selected species were determined from the non-detection of their rotation lines. We rule out the presence of a hot molecular core associated with IRAS 23385+6053 by a combination of the non-detection of CH3CN emission and a simple bolometric luminosity approach. The molecular inventory and chemistry of IRAS 23385+6053 are contrasted to that of more evolved massive star-forming regions and the abundances predicted by recent time-dependent chemical models. The physical and chemical nature of IRAS 23385+6053 is shown to be consistent with that immediately prior to the hot molecular core stage.
Key Words.:
ISM: abundances – ISM: Individual object: IRAS 23385+6053 – ISM: molecules – Stars: formation1 Introduction
The evolutionary process in which a high-mass star develops within a molecular cloud core is still subject to some uncertainty. Low-mass star formation, on the other hand, is underpinned by an extremely successful classification system (e.g. André et al. awb00 (2000)), stretching from the earliest protostellar phase (Class 0) to obscured young stellar objects and T-Tauri stars (Class II/III). No analogous scheme exists for high-mass protostars and Young Stellar Objects (YSOs), although a tentative scheme linking the development of hot molecular cores to that of ultracompact HII regions has recently been proposed (Kurtz et al. kcchw00 (2000)). In part this is due to the observational challenges posed by objects that are less numerous, are at much greater distances, preferentially form in compact clusters and evolve more rapidly than low-mass star-forming regions.
Until recently, the earliest known phase in the development of a massive YSO was the ultracompact HII region (Churchwell churchwell02 (2002)), which traces the development of a high-mass star some 105 years after its formation (De Pree et al. dprg95 (1995)). Much effort in recent years has been placed into identifying the earlier phases of high mass star formation, i.e. the massive protostellar precursors of ultracompact HII regions (e.g. Molinari et al. mol96 (1996), 1998a , mol00 (2000); Sridharan et al. sbsmw02 (2002), Beuther et al. bsmmsw02 (2002), Lumsden et al. lhor02 (2002)). A large number of candidate massive protostars and YSOs have been identified in these studies and the physical conditions of the pre-ultracompact HII region phase are beginning to emerge.
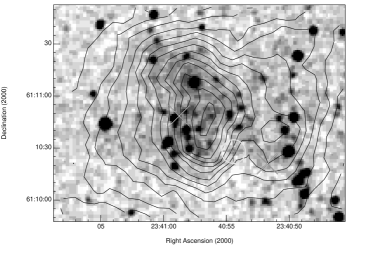
One of the prototypes of these candidate massive protostars is IRAS 23385+6053, identified in the search of Molinari et al. (mol96 (1996), 1998a ). It is comprised of a compact dense molecular core, massing some 370 , associated with a powerful molecular outflow seen in HCO+ and SiO emission (Molinari et al. 1998b ). Although there is nearby extended radio and mid-infrared emission (Molinari et al. 1998a , 1998b ) associated with two YSO clusters, the dense molecular core of IRAS 23385+6053 is coincident with neither (see Fig. 1) and is detected only by its far-infrared to sub-millimetre continuum emission. Molinari et al. (1998b ) determined the sub-millimetre to bolometric luminosity () and envelope mass to core mass () ratios for IRAS 23385+6053, which are standard diagnostic indicators for the evolutionary class of low-mass protostars (André et al. awb93 (1993)). Based on these indicators and the large bolometric luminosity ( for an assumed kinematic distance of 4.9 kpc) Molinari et al. (1998b ) concluded that IRAS 23385+6053 was the first bona fide example of a massive class 0 protostar.
Although a wealth of information on the physical properties of massive protostars and YSOs is becoming available there is as yet little information on their chemistry or molecular inventory. The gas-phase molecular chemistry of star-forming regions has long been regarded as a potential diagnostic of their age (e.g. Brown et al. bcm88 (1988)). Many chemical studies have been made of hot molecular cores and ultracompact HII region (Gibb et al. gniwb00 (2000); Thompson et al. tm99 (1999); Hatchell et al. 1998a , 1998b , Schilke et al. sgbp97 (1997)), but none to date of candidate massive protostellar objects. Molecular line surveys allow the abundances of a large number of molecular species to be determined, characterising the chemistry of the molecular gas and providing a list of molecular tracers that may be used to probe the physical conditions of massive protostars (e.g. to determine the gas kinetic temperature or density, or for use in infall searches). For these reasons we have carried out a molecular line survey of the candidate massive protostar IRAS 23385+6053 with the James Clerk Maxwell Telescope.
The observations and data reduction procedure are detailed in the next section. The identified molecular lines detected in the survey and their derived column densities and abundances are presented in Sect. 3. The results of the survey and their implications for the protostellar nature of IRAS 23385+6053 and its relation to the more evolved hot molecular cores and ultracompact HII regions are discussed in Sect. 4.
2 Observations and data reduction
2.1 Observations
The observations were carried out at the James Clerk Maxwell Telescope (JCMT111 The JCMT is operated by the Joint Astronomy Centre on behalf of PPARC for the United Kingdom, the Netherlands Organisation of Scientific Research, and the National Research Council of Canada.) during the August 1999 to January 2000 semester. The observations were scheduled according to the flexible-scheduling backup mode in operation at the JCMT, whereby scientific programmes are accorded a priority within a specified weather band defined by the atmospheric opacity at 225 GHz and then carried out by visiting observers according to suitable weather conditions. The data were thus obtained piecemeal over a period of several months, depending upon the local weather conditions and the visibility of the target source IRAS 23385+6053.
The 330–360 GHz region was selected for the molecular line survey to match as closely as possible the FWHM beam-width of the JCMT at this frequency (14″ at 345 GHz) to the observed angular diameter of the IRAS 23385+6053 molecular core (FWHM ″) as measured in the HCO+ J=1–0 transition, Molinari et al. 1998b ). This approach was crucial to minimise the beam dilution caused by observing such a compact source and also to avoid possible contamination from gas associated with the nearby mid-infrared sources (see Fig. 1). A secondary concern for choosing this frequency range was to facilitate the comparison of the survey results with the many surveys of hot cores and ultracompact HII regions carried out in this range (Thompson et al. tm99 (1999); Schilke et al. sgbp97 (1997); Macdonald et al. mghm96 (1996), Jewell et al. jhls89 (1989)).
All observations were made at the coordinates of the millimetre peak of IRAS 23385+6053 given by Molinari et al. (1998b ), i.e. (2000) = 23h40m545, (2000) = +61°10′28″. The pointing accuracy of the telescope was checked hourly against standard pointing calibrators and was found to be good to within 3–4″. The spectra were taken in beam-switching mode, in which the secondary mirror is chopped from on-source to off-source at a frequency of 1 Hz. Beam-switching is much superior to position-switching (i.e. moving the primary mirror to the off-source position) for obtaining the extremely flat baselines required to search for faint line emission. A chop throw of 3′ in RA was used to keep a constant reference position from spectrum to spectrum. This throw was more than sufficient to reach a clean reference position for all species except CO, which in massive star-forming regions is typically widespread over a much larger area.
The spectra were observed using the facility heterodyne receiver B3 (RxB3), which is a dual-SIS junction receiver operating in the 345 GHz band, coupled to the facility Digital Autocorrelation Spectrometer (DAS). The receiver was used in dual sideband mode in which the resulting spectra are comprised of two frequency bands (the upper and lower sidebands) folded over one another. The “main band” of the spectrum may be set to either the upper or lower sideband and the remaining sideband is often referred to as the “image band”. The main and image bands are separated from one another by roughly twice the intermediate frequency or IF of the receiver, which for RxB3 is 4 GHz, leading to a band separation of 8 GHz.
The receiver may also be used in single-sideband mode where the image band of the receiver is attenuated by roughly a factor of 20 using a dual-beam Mach-Zender interferometer. Strong lines in the image band may thus leak through to the main band, mimicking faint main band lines and the sideband rejection factor is not accurately calibrated over the entire passband of the receiver. We used the dual-sideband mode of receiver B3 to avoid problems in relative image band rejection across the passband and to instantaneously obtain twice the frequency coverage of single-sideband mode. The sideband of each detected line was determined by taking an additional spectrum with the local oscillator frequency shifted by +10 MHz. In the shifted spectrum lines in the image band appear to shift frequency by MHz relative to the lines in the main band.
The DAS was set to a bandwidth of 920 MHz to exploit the maximum dual-sideband bandwidth of RxB3. Our observing strategy was to take spectra with the main band set to the lower sideband, increment the central frequency of the main band by 800 MHz and repeat the spectra until the frequency range covered in the lower sideband reached that of the upper sideband from the first spectrum. A block of 10 spectra observed in this manner sample contiguous 8 GHz frequency ranges in both the lower and upper sidebands. Two of these blocks of dual-sideband spectra are sufficient to cover the entire 330–360 GHz frequency range, with a 1 GHz extension to either side. The 800 MHz frequency increment allows for a 120 MHz overlap between spectra, allowing the the raised noise at the edge of the passband to be avoided. Unfortunately, during the observations the second block of spectra was mistakenly observed in the the upper sideband rather than the lower sideband, leading to a duplication of the 338–342 GHz frequency range and a gap in the coverage between 352–359 GHz.
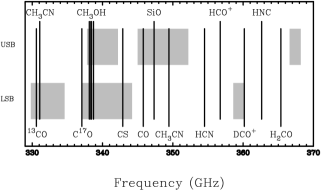
An attempt was made to take extra spectra to cover the gaps in frequency coverage, although the lack of suitable weather over the semester meant that the gaps could not be completely filled. The resulting frequency coverage of the survey is 27.2 GHz with gaps at 334.6–337, 344.2–345 and 352-358.6 GHz. Fig. 2 shows the total frequency coverage of the survey. Despite the gaps in frequency coverage the molecular line survey is 85% complete over the 329–361 GHz range originally intended and covers the frequencies of many important astrophysical transitions. The implications of the gaps in frequency coverage and their impact on the survey are discussed further in Sect. 4.
With the DAS set to a 920 MHz bandwidth the width of each channel was 625 kHz, with a spectral resolution of 756 kHz. Later in the data reduction procedure all spectra were binned to a channel width of 1.25 MHz to improve the signal to noise ratio. The standard three-load chopper-wheel calibration method of Kutner & Ulich (ku81 (1981)) was used to obtain line temperatures on the scale, i.e. corrected for the atmosphere, resistive telecope losses and rearward spillover and scattering. All line temperatures quoted in this paper are on the scale unless explicitly stated otherwise. Values of may be converted to the corrected receiver temperature by dividing by the forward spillover and scattering coefficient , which for the JCMT and RxB3 is 0.7 at 345 GHz. Absolute calibration of the scale was determined by regular observations of the standard spectral line calibrator NGC 7538 IRS1 and was found to be accurate to within 10%.
2.2 Data reduction and line identification
The data were reduced using the Starlink millimetre-wave spectroscopy package SPECX (Prestage et al. specx (2000)). Linear baselines were subtracted from each spectrum and the line parameters of peak temperature (), central observed frequency ((obs)) and line width at half maximum () were measured. A value of 51.0 km s-1 for the LSR velocity of IRAS 23385+6053 was assumed, following Molinari et al. (1998b ). Sample spectra are shown in Figure 3.


The noise in each spectrum was estimated using the line-free channels and was found to be typically 50 mK per 1.25 MHz wide channel. Line features below a minimum detection limit of 3 (0.15 K) were ignored to avoid inaccurate line identifications. Each line was identified at least twice in separate spectra, including the 10MHz shifted spectra and the 120 MHz overlaps between adjacent spectra. The values of , (obs) and were averaged together for multiple detections of the same line and these average quantities are listed in Table 1.
| (obs) | Species | Transition | (rest) | Notes | |||
|---|---|---|---|---|---|---|---|
| (GHz) | (K) | (MHz) | (GHz) | (K) | |||
| 330.587 | 6.89 | 4.4 | 13CO | 3–2 | 330.588 | 31.7 | |
| 337.060 | 0.90 | 2.7 | C17O | 3–2 | 337.061 | 32.4 | |
| 338.124 | 0.33 | 3.3 | CH3OH | 7(0)–6(0) E | 338.125 | 76.9 | |
| 338.344 | 0.73 | 4.6 | CH3OH | 7(1)–6(1) E | 338.345 | 69.4 | |
| 338.408 | 0.89 | 4.6 | CH3OH | 7(0)–6(0) A+ | 338.409 | 65.0 | |
| 338.515 | 0.21 | 3.9 | CH3OH | 7(2)–6(2) A | 338.513 | 103 | |
| 338.615 | 0.22 | 3.9 | CH3OH | 7(1)–6(1) E | 338.615 | 84.9 | |
| 338.722 | 0.27 | 3.6 | CH3OH | 7(2)–6(2) E | 338.722 | 86.1 | |
| 340.032 | 0.25 | 2.8 | CN | 3–2 2.5 3.5–1.5 2.5 | 340.032 | 16.3 | sl-blend |
| 340.035 | 0.24 | 2.8 | CN | 3–2 2.5 1.5–1.5 0.5 | 340.035 | 16.3 | h/fine blend with 2.5 2.5-1.5 1.5 |
| 340.247 | 0.59 | 3.5 | CN | 3–2 3.5 4.5–2.5 3.5 | 340.248 | 16.3 | |
| 340.714 | 0.26 | 3.8 | SO | 7(8)–6(7) | 340.714 | 81.2 | |
| 341.350 | 0.15 | 2.4 | HCS+ | 8–7 | 341.350 | 73.7 | |
| 341.415 | 0.38 | 4.2 | CH3OH | 7(1)–6(1) A | 341.416 | 80.1 | |
| 342.883 | 1.25 | 3.8 | CS | 7–6 | 342.883 | 65.8 | |
| 345.339 | 0.15 | 3.7 | H13CN | 4–3 | 345.340 | 41.3 | * |
| SO2 | 13(2,12)–12(2,11) | 345.339 | 93.0 | ||||
| 345.795 | 12.19 | – | CO | 3–2 | 345.796 | 33.2 | strongly self-absorbed |
| 346.527 | 0.35 | 4.7 | SO | 9(8)–8(7) | 346.529 | 78.8 | |
| 346.998 | 0.19 | 4.4 | H13CO+ | 4–3 | 346.999 | 41.6 | |
| 347.387 | 0.17 | 5.0 | U | ||||
| 348.534 | 0.15 | 5.0 | H2CS | 10(1,9)–9(1,8) | 348.532 | 105 | |
| 349.338 | 0.92 | 4.9 | C2H | 4.5–3.5 | 349.338 | 41.9 | |
| 349.400 | 0.61 | 3.7 | C2H | 3.5–2.5 | 349.401 | 41.9 | |
| 350.688 | 0.47 | 4.4 | CH3OH | 4(0)–3(1) E | 350.688 | 35.1 | poss. blend with NO 3.5 0.5–2.5 0.5 |
| 350.905 | 0.38 | 4.9 | CH3OH | 1(1)–0(0) A+ | 350.905 | 16.8 | |
| 351.768 | 1.60 | 4.9 | H2CO | 5(1,5)–4(1,4) | 351.769 | 62.5 | |
| 358.606 | 0.23 | 3.9 | CH3OH | 4(1)–3(0) E | 358.606 | 43.1 |
The lines were identified with molecular transitions by comparing their central observed frequencies to those listed in the JPL Molecular Spectroscopy Database (available from http://spec.jpl.nasa.gov). Other line lists used include the methanol lists of Anderson et al. (anderson (1993)) and the observational lists of lines detected by Jewell et al. (jhls89 (1989)) toward Orion-A, Macdonald et al. (mghm96 (1996)) toward G34.3+0.15, Schilke et al. (sgbp97 (1997)) toward Orion-KL and Thompson & Macdonald (tm99 (1999)) toward G5.890.39. A list of species identified in the molecular gas of IRAS 23385+6053 may be found in Table 2. The identification of asymmetric rotors (such as H2CS) from single line detections must be viewed with caution as these species possess many other transitions within the observed frequency range.
| Species | Number of |
|---|---|
| detected lines | |
| CO | 1 |
| 13CO | 1 |
| C17O | 1 |
| CH3OH | 10 |
| CN | 3 |
| SO | 2 |
| HCS+ | 1 |
| CS | 1 |
| H13CN | 1 |
| H13CO+ | 1 |
| H2CS | 1 |
| C2H | 2 |
| H2CO | 1 |
3 Results and analysis
3.1 Identified molecular lines
A total of 27 lines were identified in the survey, originating from 11 species, and are shown in Table 1. One further line at 347.387 GHz could not be identified with any transition listed in the JPL Molecular Spectroscopy Database and is also not listed in any of the other observational lists that were checked. A list of the identified species (including isotopomers) and the number of detected lines from each is contained in Table 2. Most of the lines identified in the survey originate from the J=7–6 transitions of methanol (CH3OH). With the exception of the 12CO J=3–2 line the lines are narrow, with typical FWHM linewidths of 4 MHz, which corresponds to a width of 3.5 km s-1 at 345 GHz.
Emission from the commonly used tracers of temperature and column density CH3CN (methyl cyanide) and CH3CCH (propyne or methyl acetylene) was not detected down to a level of K. If the most likely identification of the line at 345.399 GHz is the J=4–3 transition of H13CN then the SO2 molecule was also not detected toward IRAS 23385+6053. No transitions from the organic asymmetric rotors (e.g. CH3OCH3, HCOOCH3, NH2CHO, H2CCHCN or C2H5OH) observed to be widespread in hot molecular cores (e.g. Hatchell et al.1998a ) were detected.
The non-detections of these various transitions most likely arise from a mix of excitation and chemical effects. The narrow linewidths and faint molecular lines observed in the survey indicate that the molecular gas of IRAS 23385+6053 is cold, meaning that there is an insufficient kinetic temperature to adequately excite the higher energy transitions. High excitation lines require hot gas in order to be excited. The highest excitation transition observed in the survey was the 7(2)–6(2) A CH3OH line at 338.515 GHz, which possesses an upper energy level of K. It is likely that the non-detection of certain species whose lines in this frequency range are of high excitation (e.g. HC3N with an /k 300 K) is reflected by the inability of the cold gas to excite their transitions adequately rather than a genuinely low gas-phase abundance. However, asymmetric rotors such as SO2, HCOOCH3 and C2H5OH possess many lines across the frequency range of the survey with a wide range of excitation. The non-detection of the low-excitation lines of these species must arise from their low gas-phase abundance rather than excitation effects. We will further explore these issues and their implications for the chemistry of IRAS 23385+6053 in Sect. 4.
3.2 Rotation diagram analysis
The temperature and column density of the gas may be determined via rotation diagrams (Turner turner91 (1991)), also known as Boltzmann plots (e.g. Brand et al. bcpm01 (2001)). The main assumptions in the rotation diagram approach are that the gas is optically thin, in Local Thermodynamic Equilibrium (LTE) and can be described by a single rotational temperature . For these assumptions the column density equation may be written as (e.g. Thompson, Macdonald & Millar tmm99 (1999))
| (1) |
where is the integrated intensity of the line, is the line frequency, is the line strength, is the permanent dipole moment, and are, respectively, the reduced nuclear spin and K-level degeneracy of the molecule. The energy of the upper level of the line is represented by . The partition function as a function of is written as and represents the partitioning of the total level energies into each rotational level.
The column density derived from Eq. 1 is beam-averaged rather than source-averaged, as the beam-averaged receiver temperature is used instead of the source brightness temperature . To calculate a source-averaged column density the beam-filling factor of the emission (and hence the emitting area of the line) must be known. Each line will trace slightly different environments depending upon their critical densities and excitation temperature, thus there is no guarantee that the beam filling factors are constant for all species and lines. As the beam filling factors are unknown for the transitions in question we derive beam-averaged column densities throughout this paper.
Equation 1 is often known as the column density equation and, by taking logarithms of each side, it is possible to rearrange this equation to that of a straight line, i.e.
| (2) |
This equation is more commonly known as the rotation diagram equation (e.g. Macdonald et al. mghm96 (1996)). The left hand quantity in Equation 2 is more commonly known as and a plot of against results in a straight line with a gradient of and an intercept of . Methanol is the only species in our survey with a sufficient number of identified lines to plot rotation diagrams. Methanol is an asymmetric top molecule with its rotation-torsion levels split into two types of sublevel: A (symmetric) and E (degenerate). Both types must be analysed separately to take into account differences in sublevel populations.
We plotted separate rotation diagrams for the A and E-type methanol transitions identified in the survey, which may be seen in Fig. 4. Straight lines were fitted to the data using a least-squares fitting routine. The results of the straight line fits for the A-type transitions are K and cm-2. The fits to the E-type transitions yield a rotation temperature and column density of K and cm-2. The partition function was evaluated via interpolation from the values quoted in the JPL Molecular Spectroscopy Database to the rotation temperature derived from the rotation diagram. The column densities were then determined using Eq. 2 and the y-intercept value from the least-squares fit.

What can be immediately seen from the two rotation diagrams in Figure 4 is that the lower excitation transitions are inconsistent with the straight line fits. When transitions with values of less than 50 K are excluded from the straight line fits then the straight line correlation coefficient improves markedly for both rotation diagrams. We carefully inspected the data for any irregularities (e.g. pointing offsets, line misidentifications or blending, calibration errors) which may have caused the integrated intensity or upper level energy of any of the methanol lines to be over- or under-estimated. No such cause was found and we conclude that it is likely to be a genuine physical effect rather than an artefact of the observations. Discounting the low excitation lines with K from the straight line fit brings the rotation temperatures and column densities derived from each subtype into closer agreement, with K and cm-2. These straight line fits are indicated in Fig. 4 by dashed lines.
The most likely cause of the difference in the low-excitation transitions is a breakdown in the assumptions behind the rotation diagram approach, i.e. the gas may not be described by a single temperature or it is optically thick. If the former were true then the low excitation lines would predominantly originate from colder gas than the high excitation lines and one would expect the low-excitation lines to follow a steeper (i.e. colder) gradient. If the latter were true then the integrated intensity of the more optically thick lower excitation lines would be underestimated compared with the less optically thick higher excitation lines.
It is unlikely that the methanol lines are appreciably optically thick, as they are relatively faint and show no evidence of the line core saturation or asymmetric line profiles expected for optically thick lines. We do not detect the low excitation lines of the 13CH3OH isotopomer, although the upper limit on their detection ( K) does not allow stringent limits to be placed on the optical depth of the low excitation lines (). There is some evidence for a two-temperature distribution in the E-type rotation diagram, as the two lowest excitation lines appear to follow a steeper gradient. Further observations of lower excitation lines, for example in the 210–280 GHz window, are required to confirm this hypothesis.
3.3 Lower limits to column density
Eq. 1 may be used to yield lower limits to the beam-averaged column density for species with only one or two detected lines. To derive a lower limit to the beam-averaged column density we set the derivative of the temperature-dependent part of Eq. 1 to zero, i.e.
| (3) |
where represents the excitation temperature of the transition. Values of satisfying this condition are turning points in the column density equation. Using the Turner (turner91 (1991)) high temperature approximations for the partition function , it is easy to show that these turning points are minima (as the second derivative is positive) and also that they occur at values of for linear molecules and for symmetric and asymmetric top molecules. The resulting equations for the minimum beam-averaged column density may thus be written as:
| (4) | |||||
| (5) |
where Eq. 4 is used for linear molecules such as CO and HC3N and Eq. 5 is appropriate for symmetric and asymmetric top molecules such as CH3CN and H2CS.
We used Equations 4 and 5 to determine the beam-averaged column density lower limits () for the lines detected in the survey. Values of are shown in Table 3. Self-absorbed and blended lines were excluded from the analysis.
| Species | Nmin (cm-2) |
|---|---|
| 13CO | 1.9 1016 |
| C17O | 1.5 |
| SO | 2.7 1013 |
| HCS+ | 1.6 1012 |
| CS | 1.7 1013 |
| H13CN | 1.4 1012 |
| H13CO+ | 5.1 1011 |
| H2CS | 1.8 1013 |
| C2H | 1.6 1014 |
| H2CO | 4.1 1013 |
3.4 Upper limits to column density for undetected species
The column density equation (Eq. 1) may be used to determine an upper limit to the beam-averaged column density of molecular species that were not detected in the survey (e.g. Hatchell et al. 1998a ). In this case assumed values for the maximum integrated intensity of an undetected line and the excitation temperature of the gas must be used in place of and . The maximum integrated intensity for an undetected line is estimated from a 3 upper limit to the receiver temperature and an assumed value for the linewidth.
For all the upper limits derived in this paper we take the assumed linewidth to be the average linewidth of the detected lines, i.e. 4 MHz or 3.5 km s-1 at 345 GHz. We calculate upper limits to column density for two assumed temperatures (20 and 40 K), to bracket the rotation temperature of 20 K as derived from the methanol rotation diagrams and also the values derived by Molinari et al. (mol96 (1996), 1998b ) from ammonia and millimetre-wave dust continuum observations (27 and 40 K respectively). It should be noted that the latter temperature estimate from Molinari et al. (1998b ) is of the temperature at the outer radius of the millimetre-wave core.
Upper column density limits were calculated for various astrochemically important species that have been observed towards hot molecular cores and ultracompact HII regions, so that we may investigate the evolution of the molecular gas towards these later stages. We also selected species that are contained in chemical models of these regions (e.g. Viti & Williams vw99 (1999)). The upper column density limits are given in Table 4, along with the line used for the calculation and its rest frequency.
| Species | Line | (rest) | Nmax (cm-2) | |
|---|---|---|---|---|
| (GHz) | K | K | ||
| CH3CN | 18(0)–17(0) | 331.072 | 2.9 1015 | 1.9 1014 |
| CH3CCH | 20(0)–19(0) | 341.741 | 1.0 1016 | 3.7 1014 |
| HCOOCH3 | 17(5,12)–16(4,13) A | 343.150 | 7.9 1014 | 2.3 1014 |
| HC3N | 38–37 | 345.609 | 1.9 1018 | 1.2 1015 |
| SO2 | 4(3,1)–3(2,2) | 332.505 | 3.6 1013 | 4.6 1013 |
| OCS | 28–27 | 340.449 | 1.5 1018 | 7.8 1015 |
It can be seen from Table 4 that upper limits for species with only high-excitation lines ( K) are not well constrained for the K case. This is due to the exponential term in Eq. 1, which significantly raises the column density upper limit for lines possessing large values of in relation to the excitation temperature of the gas. As the assumed excitation temperature rises the derived column density upper limit decreases, until the point where the partition function term begins to dominate over the exponential ().
The low temperatures used in the calculation may not be appropriate for species that are thought to predominantly originate from the evaporation of dust grain ice mantles (CH3CN and HCOOCH3). These species, if they are present in the gas phase, are expected to have evaporated from the ice mantles at gas kinetic temperatures above 90 K (e.g. Hatchell et al. 1998a ). Purely gas-phase chemical models predict extremely low abundances of these molecules (Millar et al. mmg97 (1997)). In order to account for the possibility that IRAS 23385+6053 contains a small embedded hot molecular core heated by the central protostar we have evaluated column density upper limits for CH3CN and HCOOCH3 assuming an excitation temperature of 150 K. These limits are: for CH3CN and for HCOOCH3. We will investigate the likelihood that IRAS 23385+6053 contains an embedded hot molecular core and set limits on its possible size in Sect. 4.2.
4 Discussion
4.1 The molecular inventory of IRAS 23385+6053
The results of our survey show that IRAS 23385+6053 has a simple molecular inventory. The gas is comprised of simple molecules with emission detected from CO, CN, SO, HCS+, CS, HCN, HCO+, C2H, H2CO, CH3OH and H2CS. The latter molecule, H2CS, is an uncertain identification as several other low-excitation lines of this asymmetric top molecule lying in the frequency range of the survey were not detected. Only low-excitation lines of these species were detected with values of K. To this inventory we may add the following species observed toward IRAS 23385+6053 by other authors: NH3 (Molinari et al. mol96 (1996)), SiO (Molinari et al. 1998b ) and CH3CCH (Brand et al. bcpm01 (2001)).
We did not detect these last two species (SiO and CH3CCH) in our survey due to a combination of excitation and the sensitivity of our observations. The lines of these species in the 330–360 GHz frequency range are of moderate to high excitation; K in the case of the SiO 8–7 line and K for the CH3CCH 20(0)–19(0) line. The upper limit that we derived for CH3CCH in Sect. 3.4 for an excitation temperature of 40 K is larger than the column density measured by Brand et al. (bcpm01 (2001)) for the CH3CCH J=6–5 K-ladder lines by roughly an order of magnitude and thus our observations are consistent with those of Brand et al. (bcpm01 (2001)). Molinari et al.(1998b ) detected the SiO 2–1 line with a source-integrated column density of 1.4 1014 cm-2 for an assumed excitation temperature of 30 K. Using Eq. 1 we calculate a beam-averaged upper column density limit (based upon our non-detection of the SiO J=8–7 line at 347.331 GHz) of 1.0 1012 cm-2. This is inconsistent with the Molinari et al. (1998b ) detection and indicates that either the assumed excitation temperature is too large or that the emitting area of the SiO J=8–7 line is small enough for the beam-dilution in our 14″ beam to reduce the emission below our sensitivity limit ((rms) = 43 mK).
We did not detect emission from any of the complex organic molecules whose high abundances are a classic signature of hot molecular cores (e.g. CH3CN, HCOOCH3 or C2H5OH). These molecules are predominantly thought to originate from the evaporation of dust grain ice mantles and their non-detection towards IRAS 23385+6053 indicates that the presence of a hot molecular core within IRAS 23385+6053 is unlikely. A more sensitive search for the hot core tracer methyl cyanide (CH3CN) was conducted recently by Pankonin et al. (pcwb01 (2001)) towards a number of candidate massive protostars. Their non-detection of emission from the CH3CN J=12–11 K-ladder to a 1 r.m.s. level of = 13mK allows us to set an upper limit to the CH3CN column density of 5.0 1012 cm-2 for an assumed excitation temperature of 40 K (a factor of lower than our limit based on the non-detection of the J=18–17 K-ladder).
Important molecular lines that fall in the frequency bands missing from the survey are the HCO+ J=3–2 and HCN J=4–3 lines, plus several lines of SO2 and CH3OH. For the former two species we have detected their less common 13C isotopomers and are thus certain that the more common isotopomers are present in the molecular gas. The remaining two species are asymmetric rotors and there are many transitions lying in the frequency bands of the survey. Thus we are reasonably confident that the missing frequency bands do not affect the final conclusions of the survey.
The molecular inventory of IRAS 23385+6053 is that of a cold dense molecular core with depleted abundances of complex molecules and exhibiting emission only from low-excitation lines of chemically simple species. In many respects the molecular inventory of IRAS 23385+6053 shares many characteristics with the line-poor ultracompact HII regions observed by Hatchell et al. (1998a ). Both types of object exhibit emission from low excitation lines with K and show no evidence for hot, dense molecular gas. If IRAS 23385 can be thought of as a representative massive protostar this may indicate that the molecular inventory of massive star-forming regions evolves from line-poor protostars to line-rich hot cores as the molecular ices are evaporated from dust grains, then back to line-poor ultracompact HII regions as the chemically rich dense gas of the hot core is dispersed by the radiation from the newly-born massive stars.
In summary, the molecular inventory of IRAS 23385+6053 suggests that the molecular gas is cold and dense, with depleted abundances of the more complex saturated species that trace hot molecular cores. The composition of the gas appears to be similar to the line-poor ultracompact HII regions observed by Hatchell et al. (1998a ), whose limited molecular inventories are ascribed to the lack of a hot dense molecular core. We investigate this possibility in the following section.
4.2 Could IRAS 23385+6053 contain a hot core?
IRAS 23385+6053 does not exhibit any of the classic signs of a hot molecular core, i.e. high excitation lines or high abundances of saturated molecules such as CH3CN or HCOOCH3. The highest excitation lines detected in our survey have values of K and in the previous section, using the observations of Pankonin et al. (pcwb01 (2001)), we set an upper limit for the beam-averaged CH3CN column density of 5.0 1012 cm-2, which assumes an excitation temperature of 40 K. Nevertheless, given the small filling factor of the millimetre core (Molinari et al. 1998b ) and the beams of our and Pankonin et al’s study it is possible that a small, optically thick hot molecular core may lie below our sensitivity limits.
To explore this possibility and set an upper limit on the size of any hot molecular core we modelled the expected CH3CN emission from a compact molecular core using the LTE technique described by Hatchell et al. (1998a ). This technique assumes that the emission is in thermal equilibrium, but does not assume optically thin emission. The density of the IRAS 23385+6053 millimetre core is 107 cm-3 (Molinari et al. 1998b ) and this is more than sufficient to thermalise the CH3CN transitions. The LTE analysis technique predicts the line receiver temperature as a function of a column density , the gas kinetic temperature and the angular source FWHM . Here, as we can only assume an upper limit for the observed line receiver temperature, we do not have sufficient information to extract either the kinetic temperature or column density and so we model the emission based on assumed values of the kinetic temperature and the CH3CN source-averaged column density.
We assume that as the gas is thermalised . We use an upper limit for the line receiver temperature of 3, which is 51 mK in the Pankonin et al. (pcwb01 (2001)) study for the J=12–11 K-ladder and 116 mK for the CH3CN J=19–18 ladder that was undetected in our survey. Within both ladders we selected the K=0 component for our LTE calculations. To calculate the CH3CN source-averaged column density we assume a standard hot core abundance for CH3CN of 10-8 relative to H2 and use density and radius values for the millimetre core of cm-3 and 0.048 pc as derived from the envelope model of Molinari et al. (1998b ). The LTE models show that as the H2 density of the millimetre core is high, the CH3CN emission is extremely optically thick for both the J=12–11 and J=19–18 K-ladders and remains so even for high gas temperatures, small core radii and low CH3CN abundances. In the optically thick case, the predicted receiver temperatures are practically independent of the column density or abundance of CH3CN and depend solely on the kinetic temperature and beam filling factor of the core (see Equation 1 of Hatchell et al. 1998b ).
For a kinetic temperature of 150 K we determine a maximum hot core angular diameter of 07, using Pankonin et al’s detection limit and their FWHM beamwidth of 36″. The angular size of an optically thick core is inversely proportional to the square root of the kinetic temperature, so there is a slight increase in the maximum core size for colder cores (08 for a 100 K core) and a corresponding decrease for hotter cores (05 for a 300 K core). Even though our survey is a factor of two less sensitive than the work of Pankonin et al. (pcwb01 (2001)), we obtain tighter constraints upon the maximum hot core angular diameter because our FWHM beamwidth (14″) is less than half that of Pankonin et al. For a 3 upper limit of 112 mK we determine maximum hot core angular diameters of 05, 04 and 03 for kinetic temperatures of 100, 150 and 300 K respectively.
We have taken a kinetic temperature of 100 K as a lower limit to the temperature of a hot molecular core. The high abundances of saturated molecules that are present in hot cores are predominantly thought to arise from the evaporation of dust grain ice mantles (e.g. Brown et al. bcm88 (1988)), and these mantles would remain in the solid phase at temperatures much below 100 K. Thus, the maximum angular size of any hot molecular core that may be associated with IRAS 23385+6053 is 05, which corresponds to a spatial radius of 0.006 pc at the assumed distance to IRAS 23385+6053 of 4.9 kpc. This is roughly an eighth of the radius that Molinari et al. (1998b ) derive for the IRAS 23385+6053 millimetre core. The radii of hot molecular cores known to be associated with ultracompact HII regions has been measured as typically 0.03–0.06 pc via similar LTE modelling (Hatchell et al. 1998a ) or interferometric CH3CN observations Olmi et al. ocnw96 (1996); Hofner et al. hkcwc96 (1996)).
Using a simple argument based upon the Stefan-Boltzmann law we can estimate the minimum angular size of a hot core that is consistent with the bolometric luminosity of IRAS 23385+6053. The equilibrium temperature of the core is inversely proportional to the angular radius of the core (strictly, ) and so increasing the equilibrium temperature of the core decreases its angular radius. Assuming that the majority of the bolometric luminosity originates from the hot core and that the bolometric luminosity and distance of the core are 1.6 104 and 4.9 kpc respectively (Molinari et al. 1998b ), we derive a minimum angular diameter for a 100 K equilibrium temperature core of 28. The validity of this approach may be checked by comparing the predicted equilibrium temperature of the IRAS 23385+6053 millimetre-wave core to that determined by Molinari et al. (1998b ) from an envelope radiative transfer model. Using a core angular radius of 2″ the predicted equilibrium temperature is 60 K, fully consistent with the temperature of 40 K determined by Molinari et al. (note that their temperature is that at the external radius of the core and increases towards the centre).
The maximum possible hot core diameter for T 100 K that we have determined from the CH3CN upper limit (05) is considerably smaller than the minimum possible diameter derived from the simple Stefan-Boltzmann luminosity argument (28). Only by increasing the temperature of the core to greater than 300 K can we reconcile the CH3CN non-detection and the Stefan-Boltzmann predicted core size. However, such a high-temperature core is inconsistent with the non-detection of IRAS 23385+6053 at 15 m (Molinari et al. 1998b ) for all but extremely low-mass cores. We thus conclude that IRAS 23385+6053 is not associated with a hot molecular core.
The only supporting evidence for hot molecular gas towards IRAS 23385+6053 that would strengthen the case for a hot core is the association with an H2O maser (Molinari et al. mol96 (1996)). The collisional pumping of H2O masers requires the presence of gas densities cm-3 and kinetic temperatures of several hundred K (Elitzur et al. ehm89 (1989)). However, the positional accuracy of the H2O maser emission is only good to within ′ (it has only been observed to date as part of the Medicina H2O maser survey, Valdettaro et al.h2omedicina (2001)). Thus the maser is as likely to originate from shocks within the outflow associated with IRAS 23385+6053 than within a possible hot molecular core and by itself does not provide conclusive evidence for the presence of a hot molecular core.
IRAS 23385+6053 is not associated with either a hot molecular core or an ultracompact HII region. There is thus a strong possibility that it is in an evolutionary phase prior to these two phenomena. We will explore the nature of IRAS 23385+6053 in the next section, paying particular attention to the constraints that chemistry may place upon its evolutionary phase.
4.3 The physical and chemical nature of IRAS 23385+6053
Our molecular line survey reveals that IRAS 23385+6053 is comprised of cold gas with a molecular inventory limited to simple species such as CO, CS, SO, HCN and CH3OH. We do not detect emission from highly excited molecular lines (all lines detected in the survey have values of K), nor lines from saturated molecules believed to arise in the gas-phase from evaporation of dust grain molecular ice mantles. As a result it is unlikely that IRAS 23385+6053 is associated with a hot molecular core, although our data do not preclude the existence of a small hot core with a radius less than 0.006 pc.
A natural supposition given the non-detection of evaporated molecular species, the gas temperature of K determined from the methanol rotation diagrams and the candidate protostellar nature of IRAS 23385+6053 is that the molecular gas is in a cold, depleted “pre-switch on” state. In this scenario the massive protostar at the heart of the IRAS 23385+6053 millimetre-wave core has either not yet begun to warm the surrounding gas or has not yet warmed a sufficient volume of gas to be detectable. Thus many molecular species could be currently frozen out in dust grain ice mantles.
The temperature of the gas as probed by methanol in this study, CH3CCH in the study of Brand et al. (bcpm01 (2001)) and the NH3 study of Molinari et al. (mol96 (1996)) support this hypothesis, with gas temperatures ranging from 20–40 K. The small linewidths seen in our survey show that the gas is relatively quiescent compared to ultracompact HII regions and hot molecular cores which typically exhibit much broader linewidths of around 8–10 km s-1(Hatchell et al. 1998a ). IRAS 23385+6053 is revealed as a cold, dense, relatively quiescent molecular core, displaying protostellar hallmarks such as a strong outflow and high sub-millimetre to bolometric luminosity ratio (Molinari et al. 1998b ).
Does the chemistry of IRAS 23385+6053 also support this hypothesis? Recent chemical models (Rodgers & Charnley rc03 (2003); Viti & Williams vw99 (1999)) investigate the time-dependent evaporation of molecular ices within massive star-forming cores and their subsequent chemical evolution. The models predict that certain molecular species will be evaporated from the grain mantles at different epochs, depending upon their binding energy to the grain surface and the rise in luminosity of the central protostar or YSO. For example, in the collapse model of Rodgers & Charnley (rc03 (2003)) the abundance of SO2 is predicted to peak later than SO.
Before contrasting the column density ratios of various species to those predicted by the models it is useful to stress that due to the paucity of molecular lines detected in the survey we are able to provide stringent column density limits for only one species (methanol). The column density upper and lower limits that we have derived are all beam-averaged across a 14″ FWHM beam and it is not at all certain that the molecular species trace the same emitting area of gas. The high critical density lines of CH3CN with its large dipole moment are unlikely to trace the same gas as, for example, the low critical density lines of CH3OH with its relatively low dipole moment. With these caveats in mind, it is nevertheless instructive to compare the observed chemistry of IRAS 23385+6053 to that predicted by molecular evaporation chemical models in order to determine whether the models can constrain the evolutionary state of IRAS 23385+6053.
We have chosen to calculate the column density ratios as a fraction of the methanol column density so that the resulting ratio is either an upper or lower limit depending upon whether the other species is a detection or a non-detection. Column density ratios were calculated for those species modelled by Rodgers & Charnley (rc03 (2003)) and Viti & Williams (vw99 (1999)) and are found in Table 5. In order to calculate the column densities of more common isotopomers from their less common variants (e.g. HCO+ from H13CO+) we assumed that the more common isotopomer was optically thin and used standard interstellar isotope ratios.
For the undetected species with upper limits to column density we used values assuming an excitation temperature of 20 K to maintain consistency with the rotation temperature drived from the methanol rotation diagrams. This may be inappropriate for the hot core tracer molecules HCOOCH3 and CH3CN, but as their column density upper limits slowly decrease with temperature until the minimum column density ratios quoted in Table 5 are still valid for excitation temperatures less than this value.
| Species | |
|---|---|
| SO | |
| CS | |
| HCO+ | |
| H2CS | |
| H2CO | |
| CH3CN | |
| HCOOCH3 | |
| SO2 | |
| OCS |
The chemical models of Rodgers & Charnley (rc03 (2003)) and Viti & Williams (vw99 (1999)) were not explicitly calculated for the IRAS 23385+6053 molecular core and so we cannot constrain the chemical timescale in an absolute sense. However, Viti & Williams (vw99 (1999)) showed that whilst the evaporation timescale depends upon the rapidity of the molecular ice evaporation, the subsequent gas-phase evolution is similar for all evaporation models. We can thus use the column density ratios in Table 5 to determine if the chemistry of IRAS 23385+6053 is consistent with the early, middle or late phases predicted by the chemical models. These three phases represent the early stages of the evaporation in which the chemistry is dominated by small simple molecules with low surface binding energies (e.g. CO and CH4), the middle phase when most species have just evaporated from the grains and the late phase where the chemistry is dominated by the gas-phase reactions between evaporated species.
Broadly speaking the chemistry of IRAS 23385+6053 is consistent with the middle evaporation phases predicted by both models. In the model of Viti & Williams (vw99 (1999)) methanol comes off the grains roughly in the middle of the evaporation process, preceded by simple molecules with low surface binding energies and followed by the more complex species such as HCOOCH3, CH3CO and C2H5OH. The abundance of methanol after the initial evaporation rises rapidly, with a plateau at an abundance of which lasts for a few 103 years followed by a second rapid rise to a final plateau at an abundance of .
The observed column density ratios in Table 5 show that methanol is more abundant than almost every other species with the exception of OCS and CS. The ratios for SO, CS, HCO+, H2CS and H2CO are all lower limits and it is possible that these species are more abundant than methanol. Based upon the assumed excitation temperatures used in the calculation of the column density lower limit and the estimated kinetic temperature of the gas from the methanol rotation diagrams we expect the true column density to be underestimated by at most a factor of 10 (e.g. Thompson et al. tmm99 (1999)). For the ratios that are upper limits (CH3CN, HCOOCH3, SO2 and OCS) we can be reasonably certain that the only species that may be more abundant than methanol is OCS.
Methanol is predicted in the model of Viti & Williams (vw99 (1999)) to be more abundant than almost every other molecule in Table 5 during the early evaporation phase. The exceptions to this rule are OCS which is more abundant than methanol at all times, CS which has roughly the same abundance during its early evaporation, H2CO which is always more abundant than methanol and CH3CN which evaporates from grains marginally before methanol and is more abundant until methanol evaporates. In the later phases many species are predicted to have larger abundances than methanol, in particular CS, H2CS, SO, and the aforementioned OCS and H2CO. The models of Rodgers & Charnley (rc03 (2003)) broadly agree with these predictions for the late phase; they do not calculate abundance ratios for the early ice evaporation phase (note that their Figure 11 begins at a time 100 years after the evaporation phase).
On balance the chemistry of IRAS 23385+6053 resembles that predicted by Viti & Williams (vw99 (1999)) for the middle ice evaporation phase immediately prior to the development of a hot molecular core. The abundance of SO rises faster than that of methanol after the middle phase. HCO+ is more abundant than methanol during the early phase of evaporation and less abundant in the middle and later phases. The SO2 abundance is lower than that of methanol in the early and middle stages, rising toward that of methanol in the late stages. These results constrain the chemical timescale of IRAS 23385+6053 to that of the middle phase, i.e. where the majority of species are beginning to be evaporated from the dust grain ice mantles.
The major inconsistencies that arise between the observed ratios and the model predictions are for CS and OCS, where the observed ratios are larger than the model predictions. It is possible that the CS abundance is severely underestimated due to high optical depth. We can discount this possibility due to the non-detection of the C34S line at 337.397 GHz, which allows us to set a maximum optical depth of 2.6 for the main isotopomer. The column density upper limit for OCS cannot be more accurately constrained as the only OCS lines lying in our survey range are of high excitation, possessing values of K.
Both the physical and chemical properties of IRAS 23385+6053 point towards its protostellar nature and identify the IRAS 23385+6053 millimetre core as being on the verge of developing into a hot molecular core. However, in order to confirm this hypothesis the chemical abundances of the molecular gas must be constrained by further observations of lower excitation lines and more detailed modelling. In particular as the molecular core is unresolved by our survey observations the relative emitting sizes and beam filling factors of the various species are extremely uncertain. Interferometric observations are a priority to try and resolve the emission and derive firm abundance limits for the chemistry of IRAS 23385+6053.
5 Summary and conclusions
We have carried out a molecular line survey with a total frequency range of 27.2 GHz of the candidate massive Class 0 protostar IRAS 23385+6053. We detected emission from 27 lines originating from 11 molecular species. One line feature could not be identified with any known lines in the JPL Molecular Spectroscopy Database or with other observational line lists (Jewell et al. (jhls89 (1989)); Macdonald et al. (mghm96 (1996)); Schilke et al. (sgbp97 (1997)); Thompson & Macdonald (tm99 (1999))). No emission was detected from high excitation lines ( K) or from the complex saturated molecules (e.g. CH3CN, HCOOCH3 or C2H5OH) observed toward hot molecular cores. Over a third of the identified lines originate from methanol (CH3OH).
We derived the rotation temperature and column density for methanol using the rotation diagram approach and estimate lower beam-averaged column density limits for molecular species with one or two line detections (e.g. Thompson & Macdonald tm99 (1999)). Upper limits for undetected species were determined from the r.m.s. noise level of appropriate spectra. We draw the following conclusions from our survey:
-
1.
The molecular inventory of IRAS 23385+6053 resembles that of the line-poor ultracompact HII regions observed by Hatchell et al. (1998a ). They both exhibit emission from low excitation transitions of simple molecules and show no signs of hot core emission. Given the supposed massive protostellar nature of IRAS 23385+6053 this may indicate that the molecular inventory of massive star-forming regions evolves from line-poor protostellar cores through a line-rich hot molecular core phase and back to a line-poor ultracompact HII region phase when the hot dense molecular core has been dispersed.
-
2.
We see no evidence of a hot molecular core associated with IRAS 23385+6053. No emission was detected from high-excitation lines that are tracers of hot molecular gas and the rotation temperature derived from the methanol emission is K. We rule out the presence of a hot core by a combination of the LTE modelling of the CH3CN emission that is consistent with our non-detection of the CH3CN J=19–18 K-ladder and a simple argument based upon the Stefan-Boltzmann law and the bolometric luminosity of any possible hot molecular core. The H2O maser associated with IRAS 23385+6053 (Molinari et al. mol96 (1996)) must be associated with outflow shocks rather than the dense molecular core.
-
3.
The chemical composition of the IRAS 23385+6053 molecular core is consistent with the predictions of Viti & Williams (vw99 (1999)) for a molecular core in the middle evaporation phase, i.e. when the majority of species are beginning to be evaporated from dust grain ice mantles. This confirms the hypothesis of Molinari et al. (1998b ) that IRAS 23385+6053 is an extremely young massive protostellar object, possibly on the verge of developing into a hot molecular core.
Acknowledgements.
The authors would like to thank Neil Alvey and Samantha Large for their assistance with the data reduction and line identifications. We would also like to thank the referee, Todd Hunter, for providing several useful suggestions which considerably improved this paper, particularly the argument for the lack of a hot molecular core. MAT is supported by a PPARC postdoctoral grant. This research has made use of the SIMBAD astronomical database service operated at CDS, Strasbourg, France and the NASA Astrophysics Data System Bibliographic Services. Quicklook 2MASS images were obtained as part of the Two Micron All Sky Survey (2MASS), a joint project of the University of Massachusetts and the Infrared Processing and Analysis Center/California Institute of Technology, funded by the National Aeronautics and Space Administration and the National Science Foundation. MSX 8 m data were obtained from the NASA/IPAC Infrared Science Archive, which is operated by the Jet Propulsion Laboratory, California Institute of Technology, under contract with the National Aeronautics and Space Administration.References
- (1) Anderson, T., Herbst, E., Delucia, F.C., 1993, J. Mol. Spectrosc., 159, 410
- (2) André, P., Ward-Thompson, D., Barsony, M., 1993, ApJ, 406, 122
- (3) André, P., Ward-Thompson, D., Barsony, M., 2000, in Protostars & Planets IV, ed. V. Mannings, A. Boss & S. Russel (Tucson:Univ. Arizona Press), 59
- (4) Beuther, H., Schilke, P., Menten, K. M., Motte, F., Sridharan, T. K., & Wyrowski, F. 2002, ApJ, 566, 945
- (5) Brand, J., Cesaroni, R., Palla, F., & Molinari, S. 2001, A&A, 370, 230
- (6) Brown, P. D., Charnley, S. B., & Millar, T. J. 1988, MNRAS, 231, 409
- (7) Churchwell, E. 2002, ARA&A, 40, 27
- (8) de Pree, C. G., Rodriguez, L. F., & Goss, W. M. 1995, Revista Mexicana de Astronomia y Astrofisica, 31, 39
- (9) Elitzur, M., Hollenbach, D. J., & McKee, C. F. 1989, ApJ, 346, 983
- (10) Gibb, E., Nummelin, A., Irvine, W. M., Whittet, D. C. B., & Bergman, P. 2000, ApJ, 545, 309
- (11) Hatchell, J., Thompson, M. A., Millar, T. J., & Macdonald, G. H. 1998a, A&AS, 133, 29
- (12) Hatchell, J., Thompson, M. A., Millar, T. J., & Macdonald, G. H. 1998b, A&A, 338, 713
- (13) Hofner, P., Kurtz, S., Churchwell, E., Walmsley, C. M., & Cesaroni, R. 1996, ApJ, 460, 359
- (14) Jewell, P. R., Hollis, J. M., Lovas, F. J., & Snyder, L. E. 1989, ApJS, 70, 833
- (15) Kurtz, S., Cesaroni, R., Churchwell, E., Hofner, P., Walmsley, C.M., 2000, Protostars and Planets IV (Tuscon, Arizona Press), eds. v. Mannings, A.P. Boss, S.Russell, p299
- (16) Kutner, M.L., Ulich, B.L, 1981, ApJ, 250, 341
- (17) Lumsden, S. L., Hoare, M. G., Oudmaijer, R. D., & Richards, D. 2002, MNRAS, 336, 621
- (18) Macdonald, G. H., Gibb, A. G., Habing, R. J., & Millar, T. J. 1996, A&AS, 119, 333
- (19) Millar, T. J., Macdonald, G. H., & Gibb, A. G. 1997, A&A, 325, 1163
- (20) Molinari, S., Brand, J., Cesaroni, R., & Palla, F. 1996, A&A, 308, 573
- (21) Molinari, S., Brand, J., Cesaroni, R., Palla, F., & Palumbo, G. G. C. 1998a, A&A, 336, 339
- (22) Molinari, S., Testi, L., Brand, J., Cesaroni, R., & Pallo, F. 1998b, ApJ, 505, L39
- (23) Molinari, S., Brand, J., Cesaroni, R., & Palla, F. 2000, A&A, 355, 617
- (24) Olmi, L., Cesaroni, R., Neri, R., & Walmsley, C. M. 1996, A&A, 315, 565
- (25) Pankonin, V., Churchwell, E., Watson, C., & Bieging, J. H. 2001, ApJ, 558, 194
- (26) Prestage, R.M., Meyerdierks, H., Lightfoot, J.F., Jenness, T., Tilanus, R.P.J., Padman, R., Chipperfield, A.J., 2000, Starlink User Note 17, Starlink Project, CCLRC
- (27) Rodgers, S. D. & Charnley, S. B. 2003, ApJ, 585, 355
- (28) Schilke, P., Groesbeck, T. D., Blake, G. A., & Phillips, T. G. 1997, ApJS, 108, 301
- (29) Sridharan, T. K., Beuther, H., Schilke, P., Menten, K. M., & Wyrowski, F. 2002, ApJ, 566, 931
- (30) Thompson, M. A. & Macdonald, G. H. 1999, A&AS, 135, 531
- (31) Thompson, M. A., Macdonald, G. H., & Millar, T. J. 1999, A&A, 342, 809
- (32) Turner, B. E. 1991, ApJS, 76, 617
- (33) Valdettaro, R. et al. 2001, A&A, 368, 845
- (34) Viti, S. & Williams, D. A. 1999, MNRAS, 305, 755