Observing the CMB at High- using the VSA and AMI
Abstract
We discuss two experiments - the Very Small Array (VSA) and the Arcminute MicroKelvin Imager (AMI) - and their prospects for observing the CMB at high angular multipoles. Whilst the VSA is primarily designed to observe primary anisotropies in the CMB, AMI is designed to image secondary anisotropies via the Sunyaev-Zel’dovich effect. The combined -range of these two instruments is between and .
1 Introduction
With the publication of the WMAP data wmap , the focus for observational CMB effort is moving to higher resolution. Here we describe two experiments, one currently operating, one under construction, which are designed to provide complementary observations of primary and secondary CMB anisotropies over the multipole range to .
2 The Very Small Array
The Very Small Array (VSA) is a 14-element interferometric telescope designed to image faint structures in the CMB on degree and sub-degree angular scales. The instrument is situated on Mount Teide in Tenerife, and is operated jointly by the Cavendish Astrophysics Group, Cambridge, Jodrell Bank Observatory (JBO), Manchester and the Instituto de Astrofisica (IAC), Tenerife. The VSA currently can operate in the frequency range 26–36 GHz with an observing bandwidth of 1.5 GHz and has been routinely observing the CMB since September 2000.
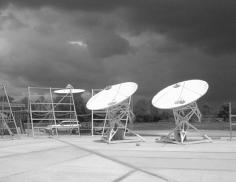
Each receiving element of the array consists of a corrugated horn-reflector antenna feeding a cooled HEMT amplifier. The antennas are mounted on a tilt-table and can be placed anywhere on the table, allowing freedom to design the array configuration for specific observational goals. During the first two observing seasons (September 2000 – September 2001 and October 2001 – present) observations of the CMB have been made using two different array configurations; the first used a compact configuration with a maximum baseline (antenna separation) of 1.2 m, while during the second season a more extended configuration was used, with a maximum baseline of 2.5 m (see Figure 1). The results from the two observing seasons are summarised below.


2.1 Observations in compact configuration
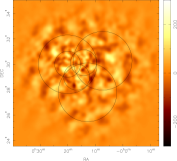
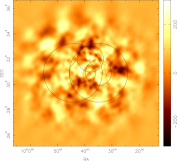
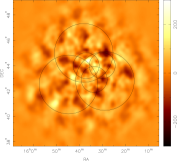
In its compact configuration, the VSA was sensitive to angular scales of – (equivalent to angular multipoles ). It mapped CMB fluctuations at 34 GHz in eight fields covering three separate areas of sky with a total area of 101 deg2 (see Figure 2). The noise levels in each field agree well with the expected thermal noise level of the telescope, and there is no evidence of any residual systematic features. Discrete radio sources were detected using a separate 15 GHz survey 9c and their effects removed using pointed follow-up observations at 34 GHz using a single-baseline interferometer operating alongside and simultaneously with the CMB observations. The residual confusion noise due to unsubtracted radio sources is less than K in the full-resolution images, which added in quadrature to the thermal noise increases the noise level by 6 K. The rms contribution to the images from diffuse Galactic emission is less than K. The power spectrum derived from this data produced clear detections of first and second acoustic peaks at and . The results of the first season of VSA observations were released in May 2002, and presented in references V1 ; V2 ; V3 ; V4 .
2.2 Observations in extended configuration
In September 2001, the VSA was re-configured for making higher-resolution observations of the CMB. Each receiver was re-fitted with a larger horn-reflector, 322 mm in diameter, and the antennas were spaced more widely on the table. In this ‘extended’ configuration, the VSA is sensitive to angular scales of – (–). By March 2002, it had completed nine fields covering three separate regions of sky with a total area of 25 deg2 (these fields are contained within the same regions of sky already observed by the VSA in its compact configuration).
The combined power spectrum from the two observing seasons (Figure 3, V5 ) covers angular multipoles – , clearly resolves the first three acoustic peaks, shows the expected fall off in power at high and starts to constrain the position and height of a fourth peak. Using the data from the two VSA configurations, we estimated cosmological parameters for four different models of increasing complexity V6 . In each case, the Bayesian evidence was calculated in order to determine whether the increased complexity of the models was required by the data. We found that the data are adequately explained by a simple flat cosmology without tensor modes. In this case, combining just the VSA and COBE data sets yields the 68 per cent confidence intervals , , , and . We also find that, by combining VSA data with estimates of from either the HST Key Project hst or Sunyaev-Zel’dovich and X-ray observations jones ; reese we obtain strong evidence for a non-zero cosmological constant independent of supernovae data.
The extended configuration results described above were announced in December 2002 and are presented in references V5 ; V6 .
Observations in the extended configuration are ongoing, with the aim of imaging a further 24 fields in 7 regions of the sky. This programme is due to be completed by mid-2003, and will contain times the amount of data presented in V5 .

2.3 Future VSA Observations
The first three acoustic peaks in the CMB power spectrum have now been detected at high significance, with positions and heights in line with those predicted by the concordance model. However, significant degeneracies in estimates of cosmological parameters still exist, which can be broken by making higher resolution measurements, beyond . Recent results from the Cosmic Background Imager (CBI) CBI and Arcminute Cosmology Bolometer Array Receiver (ACBAR) ACBAR at intermediate and high -values have shown the gradual decline of the CMB power spectrum towards higher , which is expected from Silk damping, but beyond , the CBI data show an unexpected detection of power, which may be due to the integrated SZ effect CBI-bond .
We are now planning to upgrade the VSA to enable high resolution, sensitive measurements of the power spectrum out to . These measurements will be important both for breaking degeneracies in cosmological model fitting and also for confirming or otherwise the CBI measurement of excess power at high-. To achieve the required sensitivity and resolution, four upgrades to the current system are proposed:
-
•
Super-extended configuration The current VSA array configuration will be stretched to allow maximum baseline lengths of up to 3.0 m (see Figure 4), and will allow observations out to . To maintain a good filling factor and to increase the sensitivity of the array, it is also necessary to replace the current 350-mm antennas with larger light-weight antennas approximately 550-mm wide. The new antennas will be fabricated from carbon-fibre laminate with a metal mesh front reflecting surface.
-
•
Broadbanding the main array At present the performance of the VSA is limited by its RF bandwidth. Using a broadband correlator and IF system already developed for AMI (see Section 3), we will upgrade the VSA from 1.5 to 6 GHz-bandwidth. This improvement will increase the observing speed of the VSA by a factor of 4.
-
•
Improved system temperature To further increase the sensitivity and observing efficiency of the VSA, the front-end amplifiers of each receiver will be upgraded by replacing the transistors with newer, lower-noise devices. This will reduce the overall system temperature from the current 35 K to 25 K. The combined improvement provided by the new broadband-system and amplifiers will result in an 8-fold increase in the observing speed of the instrument. The overall flux sensitivity of the upgraded VSA is shown in Figure 4.
-
•
Improved source-subtraction sensitivity Contamination of the CMB power spectrum from extragalactic point sources increases as and is expected to dominate at high . Therefore the flux density down to which point sources are currently detected and removed from VSA data must be improved. The single-baseline source-subtraction interferometer operating alongside the VSA will therefore also be upgraded with a new broadband correlator and improved amplifiers.

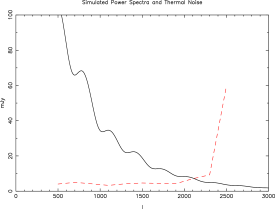
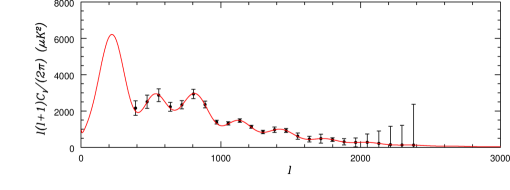
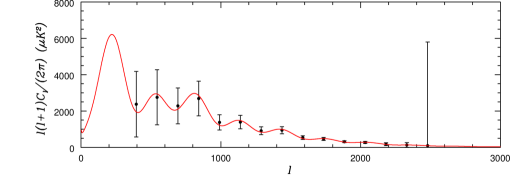
The new super-extended and enhanced VSA should be ready for operation by the end of 2004. During the first 12 months of observation in the new configuration, two distinct observing modes will be implemented. We plan to observe three large regions of sky, each consisting of a 19-field hexagonal close-packed mosaic. This level of mosaicing will provide resolution in -space of . In addition we will also make deeper observations of a smaller patch of sky consisting of one 3-field mosaic. This will be sample-variance limited at low but have sufficiently good thermal noise to determine the CMB power level in broad bins () at . Figure 5 shows simulated power spectra for these two observing modes. The error bars include sample variance, thermal noise and calibration error.
3 The Arcminute MicroKelvin Imager
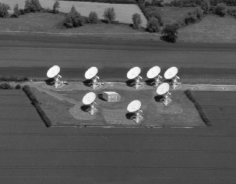
The Arcminute MicroKelvin Imager (AMI) is designed principally to image secondary anisotropies in the CMB, at higher angular resolution than the VSA. It consists of two interferometric arrays sited in Cambridge, both operating in the frequency range 12–18 GHz and both employing an analogue correlator system working over 6–12 GHz. The smaller array is entirely new, consisting of ten 3.7-m paraboloidal antennas situated inside a 30 40-m, 4.5-m high metal enclosure. The second array consists of the eight existing 13-m diameter antennas of the Ryle Telescope reconfigured from the present east-west arrangement into a new 2-dimensional compact array, with their receivers upgraded, and the entire existing correlator system replaced with the new 6–12 GHz design. This dual array design gives AMI good temperature sensitivity over a very large range of angular scales, as well as the high flux sensitivity needed to identify and remove the effect of radio sources from the data. The novel correlator design has all the intermediate frequency (IF) processing (amplification, path compensation, slope equalisation, as well as the correlation) done at the relatively high frequency of 6–12 GHz, using microstrip circuits. The advantage of this is that the relatively low fractional bandwidth eases the design of many of the system components, compared with a more traditional baseband design. The relatively low operating frequency allows a low system temperature from a sea-level site, at the expense of increased confusion from radio sources. This is dealt with by the longer baselines of the larger array, which have high sensitivity to point sources, allowing their removal from the short baseline data.
The primary goal of AMI is to make blind surveys for galaxy clusters via the SZ effect. Figure 7 shows the sensitivity of the two arrays plotted as flux density as a function of (which is related to baseline length in wavelengths by ). The thermal noise of the instrument, binned into quasi-independent (aperture-sized) bins, is shown, along with the expected rms signal from the primary CMB anisotropies, and the SZ signal from a set of representative clusters. It can be seen that most clusters are detected well above both the thermal noise and the primary CMB signal in the 3.7-m array and on the shortest baselines of the 13-m array, while the longer baselines of the 13-m array resolve out both primary and secondary CMB anisotropies and provide sensitivity to point sources (which have constant flux density as a function of baseline).

AMI is currently under construction and is expected to begin operation towards the end of 2003.
References
- (1) C. L. Bennett et al., ApJ, submitted (2003) (astro-ph/0302207).
- (2) J. R. Bond et al., ApJ, submitted (2002) (astro-ph/0205386).
- (3) W. L. Freedman et al., ApJ 553 (2003) 47.
- (4) K. J. B. Grainge et al., MNRAS 341 (2003) 1084.
- (5) M. E. Jones et al., MNRAS, submitted (2001) (astro-ph/0103046).
- (6) C. L. Kuo et al., ApJ (2002) (astro-ph/0212289).
- (7) B. S. Mason et al., ApJ, submitted (2002) (astro-ph/0205384).
- (8) E. D. Reese et al., ApJ 581 (2002) 53.
- (9) J. A. Rubiño-Martin et al., MNRAS 341 (2003) 1084.
- (10) P. F. Scott et al., MNRAS 341 (2003) 1076.
- (11) A. Slosar et al., MNRAS 341 (2003) 1084.
- (12) A. C. Taylor et al., MNRAS 341 (2003) 1066.
- (13) E. M. Waldram et al., MNRAS, in press (2003).
- (14) R. A. Watson et al., MNRAS 341 (2003) 1057.