22institutetext: School of Physics and Astronomy, University of Birmingham, Birmingham, B15 2TT, UK
33institutetext: Astronomical Observatory, Jagiellonian University, ul. Orla 171, 30-244 Cracow, Poland.
Physical changes during Z-track movement in Sco X-1 on the flaring branch
Abstract
We present results of a detailed study of X-ray flaring in the Z-track source Sco X-1 in a highly super-Eddington state made using high quality Rossi-XTE data from the PCA and HEXTE instruments. The emission model successfully used to explain the dipping LMXB, and other classes of LMXB in recent years, was applied to study the physical evolution along the Z-track which remains a major problem. This model consists of blackbody emission from the neutron star plus Comptonized emission from an extended accretion disk corona. As found in earlier work, major changes take place in the neutron star blackbody emission with increasing in flaring, and the blackbody radius increasing substantially to a maximum value of 9.40.6 km, consistent with the radius of the neutron star, after which decreases. Thus this result is a measurement of neutron star radius. The behaviour of Sco X-1 in flaring is compared with our previous results for the strong flaring that takes place in the bright dipping, flaring LMXB X 1624-490. Remarkably, during movement along the Normal Branch towards the apex with the Flaring Branch, the luminosities of both spectral components decrease, suggesting the possibility that may decrease on the Normal Branch, contrary to the widely-held view that increases monotonically along the Z-track. During flaring, we detect for the first time an increase of the Comptonization cut-off energy which may suggest heating of the ADC plasma by the neutron star flare. The energy of a broad Gaussian line at 6.4 keV does not change, but the intensity of the line increases in flaring suggesting either an increase in ADC size in flaring or the effects of irradiation by the neutron star.
Key Words.:
X rays: stars – stars: individual: Sco X-1 – stars: neutron – binaries: close – accretion: accretion disks1 Introduction
Flaring in Sco X-1 has been known for many years, since it became apparent that it had a quiescent state and an active or flaring state (Canizares et al. 1973; White et al. 1976). In the former, variability was limited, whereas in the flaring state, strong intensity variations are seen on timescale of minutes to hours. The similarity of other sources to Sco X-1 was realized by Mason et al. (1976), and van Paradijs & Lewin (1986) concluded that there was a distinction in Low Mass X-ray Binary sources (LMXB) between low luminosity, bursting sources and the bright sources such as Sco X-1.
Study of sources like Sco X-1 revealed different patterns of correlated hardness-intensity behaviour, leading to the conclusion of Hasinger et al. (1989) that the bright sources can be found on three different branches forming a skewed Z-shape in a hardness-intensity diagram: the Horizontal, Normal and Flaring branches. The Z-track sources are Sco X-1, Cyg X-2, GX 17+2, GX 349+2, GX 340+0 and GX 5-1. These hardness-intensity plots provided a model-independent method demonstrating that strong spectral changes were taking place within the sources, but not revealing the nature of the changes. At the same time it was found that the pattern of quasi-periodic oscillations (QPO) depended on position on the Z-track (van der Klis et al. 1987; Hasinger et al. 1989). Although these changes are suggestive of changes in the neighbourhood of the inner disk and compact object, they do not in themselves reveal the nature of the changes. More recently, evidence has been found that some of the related Atoll sources also move on a Z-track but on longer timescales (Muno et al. 2002); however, van der Klis (2002) has argued that the pattern of timing behaviour on the “Horizontal Branch” in one atoll source 4U 1608-52 is not as expected for a Z-track source. The Z-track and related Atoll sources have been seen generally as low-inclination LMXB sources as distinct from the high-inclination dipping and ADC sources (Frank et al. 1987). However, three of the Z-track sources display X-ray dipping implying high inclination (e.g. Kuulkers et al. 1996).
The nature of the physical changes taking place along the Z-track is not known. Detailed models have been proposed (e.g. Psaltis et al. 1995), but there has been no way of testing the details of, for example, the geometry of such models against observation. However, it was suggested that during movement along the Z-track, a single parameter changes, and it has generally been assumed that this is the mass accretion rate as proposed by Hasinger et al. (1989).
Spectral modelling of Sco X-1 was carried out by White et al. (1986) using a two-component model consisting of a blackbody plus a Comptonization term, and it was shown that flaring consisted of increases of the blackbody luminosity. However, different models were then proposed for LMXB which were radically different physically. The Eastern model of Mitsuda et al. (1989) consisted of multi-colour blackbody emission from the accretion disk, plus Comptonized emission of the neutron star. The Western model of White and co-workers (e.g. White et al. 1986) was of a self-Comptonized or generalized thermal type to explain the dominance of Comptonization in LMXB emission, while bright sources required an additional blackbody component (White et al. 1988). The ability of these different forms to fit LMXB spectra has resulted in the nature of the emission remaining controversial to the present.
2 The Birmingham emission model
In fact, the dipping LMXB sources displaying dips in X-ray intensity at the orbital period due to absorption in the outer disk (White & Swank 1982; Walter et al. 1982) have held the key to this problem. Spectral models are more strongly constrained by the requirement of having to fit not only the non-dip spectrum, but also several intensity levels during dipping without the source emission parameters changing. Work on the dipping sources led to a model consisting of blackbody emission from the neutron star plus Comptonized emission from an extended accretion disk corona (ADC) (Church & Bałucińska-Church 1995). This model provides very good fits to all of the 10 dipping sources (e.g. Church et al. 1997, 1998a, 1998b; Bałucińska-Church et al. 1999, 2000; Smale et al. 2001, 2002; Barnard et al. 2001). It also fits well the Atoll and Z-track sources included in an ASCA survey of LMXB (Church & Bałucińska-Church 2001) showing that the model describes well all classes of LMXB and that a blackbody component is present in all sources to different degrees.
After an initial period of testing the Birmingham model with data from many observations of LMXB, it was realized that use of the model revealed new features relating firstly to the blackbody emission and secondly to the Comptonized emission of the ADC. Firstly, the ASCA survey revealed systematic behaviour of the blackbody luminosity . The factors governing the level of observed thermal emission in LMXB have never been understood: Newtonian theory suggests that 50% of the X-ray emission should originate on the neutron star (or boundary layer). Apart from bright sources, the level is generally much less than 50%. The survey revealed a new empirical relation that the height of the equatorial emitting strip on the neutron star was equal to the height of the inner, radiatively-supported accretion disk (Church & Bałucińska-Church 2001). We do not think that this approximate equality spanning more than 3 decades of luminosity is coincidental, but that it suggests two mechanisms, at least, that actually determine the level of . The first is the process of accretion flow spreading on the surface of the neutron star proposed by Inogamov & Sunyaev (1999) which can explain the equality, since the extent of vertical spreading depends on the mass accretion rate, so that depends on the luminosity, as does . A comparison of the ASCA survey results with this theory (Church et al. 2002) was encouraging, with good agreement at low luminosities and agreement within a factor of three at higher luminosities. The other possibility is that material flows advectively, radially from the inner edge of the disk to the neutron star, directly leading to an approximate equality = as observed.
Our observations of the dipping LMXB have provided a significant result on the nature of the Accretion Disk Corona. Spectral fitting shows that this region is clearly extended as this emission component is removed very gradually as dipping progresses, the level only falling to zero when the absorbing region completely overlaps the extended emission region at the centre of a dip (Church et al. 1997). Furthermore, dip ingress times allow direct measurement of the size of the extended emitter when the absorber is known to have larger angular extent than the emitter, i.e. when the intensity falls to zero in dipping in any energy band. By this technique, the radius of the ADC has been measured in a number of dipping sources, and found to be typically 50,000 km or 15% of the accretion disk radius (Church 2001). The result is robust and precludes all models with small, central Comptonizing ADC including the Eastern model, since this would have size 100 km, i.e. 1000 times smaller.
3 The Birmingham model versus the Eastern model
The controversy over the emission model for LMXB persists to the present, various workers applying the Eastern model, while we have obtained strong evidence that the Birmingham model is correct. The Birmingham model differs from the Western model in that the evidence is for a blackbody component in all sources. In the Eastern model, X-ray emission is assumed to consist of disk blackbody emission plus neutron star emission Comptonized in an inner region. We summarize the evidence for and against each model, which we then discuss in more detail. One aspect of the Eastern model is that it often justified on the grounds of theoretical expectations (e.g. Done et al. 2002), not on observational evidence.
Evidence for the Eastern model:
-
1.
Its ability to fit LMXB spectra
Evidence against the Eastern model:
-
1.
Dip ingress timing proves that the ADC is large
-
2.
Smooth transition of blackbody properties from burst to non-burst emission supports blackbody origin on the neutron star
-
3.
Unphysically small values of inner disk radii radius of the neutron star when fitting the Eastern model
Evidence for the Birmingham model:
-
1.
Its ability to fit LMXB spectra
-
2.
The undoubted presence of extended Comptonized emission in the spectra of the dipping LMXB
-
3.
Dip ingress timing proves the ADC is extended
-
4.
The consistency of the derived blackbody radius with the radius of the neutron star in all sources up to a maximum value of 10 km as in Sco X-1 (the present work)
-
5.
Assuming blackbody origin on the neutron star in the ASCA survey leads to reasonable explanations of the mechanism determining the blackbody luminosity for the first time (Sect. 2).
The measurement of dip ingress times is strong, direct evidence for an extended, flat ADC above the accretion disk many times larger than required by the Eastern model. The only way of avoiding this conclusion would be if the absorbing region in dipping sources on the outer disk had a complex structure that caused gradual removal of point-like ADC emission. However, attempts to model gradual dip ingress in the source XB 1916-053 on this basis showed that the observed dipping could not be reproduced (Życki, private communication 2001).
Secondly, our ASCA survey of LMXB included testing of the Eastern model. Results of spectral fitting a two-component model were presented (Church & Bałucińska-Church 2001), this model consisting of a cut-off power law representation of Comptonization plus disk blackbody. In many cases, the level of this thermal component was such that the radius of the inner disk , which is a parameter of the disk blackbody, was less than 0.5 km, and so unphysical as many times less than the neutron star radius of 10 km (Church 2001). The validity of this conclusion was questioned by Done et al. (2002) in their paper based on fitting the Eastern model to the Z-track source Cyg X-2. They argued that the very small were an artifact of using an incorrect Comptonization model, i.e. a cut-off power law. This was based on assuming that the seed photons came from the neutron star or inner disk, and should be modelled by a simple blackbody, having the effect of a low energy cut-off in the Comptonized spectrum, which would fall steeply below 1 keV. Use of a cut-off power law would overestimate the Comptonized emission, and the disk blackbody would be underestimated. They concluded that the Eastern model was probably correct. The argument is however, not correct since the spectrum of the Comptonized emission depends on the size of the ADC. For an ADC extending 15% or more across the disk, the seed photons consist of emission from the inner 15% of the disk, and so have a soft integrated spectrum. The Comptonized spectrum thus continues to rise with approximately power law form at energies below 1 keV to 0.1 or even lower (Church et al. 2002). Thus the argument of Done et al. (2002) is not correct, and the small values of are not an artifact, and such results remain inconsistent with the actual radius of the inner disk. In the present work, we have applied both the Birmingham model and a two-component model in which the Comptonization term has disk blackbody seed photons, and find that the results of the two models are very similar, demonstrating that use of a cut-off power law is valid if the ADC is extended (Sect. 5.4).
If we accept the extended nature of the ADC as proven, the difference between the Eastern and Birmingham models reduces to whether the blackbody emission is from the inner disk or the neutron star. To avoid the observed emission being from the neutron star, the Eastern model postulates that this is Comptonized. Direct observational testing is difficult. However, the reasonable agreement between our results and the theory of Inogamov & Sunyaev supports origin on the neutron star. The large measured sizes of the ADC, and the high optical depth of the ADC (Church 2001) suggests that disk blackbody emission will not be seen since all of the hot inner part of the disk is covered by reprocessing corona. There are other arguments in favour of neutron star blackbody emission which we will only mention here: e.g. the blackbody X-ray emission in X-ray bursts decays to the quiescent blackbody component, and there is no doubt that the burst emission is from the surface of the neutron star.
Finally, an argument that has been raised against the Birmingham model is that theoretically the neutron star blackbody should be modified substantially by electron scattering in the atmosphere of the neutron star. We have previously addressed this argument (Bałucińska-Church et al. 2001), making the point that the only evidence for such modification is in a fraction of X-ray bursts (having 3 keV), there being no evidence in non-burst emission, and that theoretically whether modification takes place depends on the electron density which is very poorly known.
Thus there is substantial evidence in favour of the Birmingham model, and it is clearly of interest to test whether this model can provide an explanation of Z-track behaviour, i.e. show what physical changes take place during track movement. It is also plain that this can only be done when the correct model is used. Since the early work on Sco X-1, there has been relatively little spectral fitting work aimed at solving the Z-track problem. In the present paper, we apply the Birmingham model to X-ray spectra of Sco X-1 on the Normal and Flaring Branches using high quality data from Rossi-XTE.
4 Observations and data analysis
Numerous observations of Sco X-1 have been made using RXTE (Bradt et al. 1993); we have selected an observation made in two parts on 1998, January 7 and 8, since in the first observation, the source was in a strongly flaring state, but in the second was not flaring. Each observation lasted 35 ks. The data presented here were collected with both the proportional counter array (PCA) and the high energy X-ray timing experiment (HEXTE), using the PCA instrument in Standard 2 mode with a time resolution of 16 s. The PCA consists of five Xe proportional counter units (PCU) numbered 0–4, with a combined total effective area of about 6500 cm2 (Jahoda et al. 1996). Examination of the housekeeping data showed that PCU 0, 1, and 2 were reliably on during both observations, and PCU 3 and 4 were off. However, the count rate of the source Sco X-1 was so high that


it was not necessary or desirable to use more than a single PCU, since this would complicate analysis, and so PCU0 data were chosen. These observations took place before the loss of the propane layer in PCU0 which affected the background count rate and channel-energy conversion for this detector. Moreover, it was not necessary to use both anodes, and the left, but not the right, detector was used. Light curves and spectra were extracted as described below, and background subtracted, and deadtime corrected. Spectra were also corrected for pulse pileup necessary at the high count rate of Sco X-1.
Data were also obtained using the HEXTE phoswich detectors, which are sensitive over the energy range 15–200 keV, and data from one of the two clusters: Cluster 1, were selected. The instrument was operated in rocking mode moving in a cycle: on-source, offset by +1.5∘, on-source and offset by -1.5∘, spending 16 s in each position, so that the complete cycle occupied 64 s. Deadtime-corrected HEXTE lightcurves and source and background spectra were obtained using the hxtlcurv tool with 32 s time binning.
5 Results
5.1 The X-ray lightcurves
The PCA light curves and spectra were extracted using the standard RXTE analysis software, ftools 5.2. PCA lightcurves were extracted from the raw data in Standard 2 mode for the top layer of the PCU0 instrument and the left anode. Standard screening was applied to select only data having an offset of the telescope pointing axis from the source less than 0.02∘, and elevation above the limb of the Earth greater than 10∘. A total light curve in the band 1.9–18.5 keV was extracted, and background subtraction carried out. The program pcabackest was used to generate background data files corresponding to all PCA Standard 2 mode raw data, which were then used for correction of light curves. The latest background model was applied, specifically, the “bright” model recommended for Epoch 3 of the mission (defined as 1996, April 15 – 1999, March 22), produced in 2002. The light curve was background subtracted, and then deadtime correction carried out using dedicated software applying the prescription provided by the mission specialists. The background-subtracted deadtime-corrected light curve is shown on Fig. 1 This clearly shows strong flaring in the first part of the observation (Jan 7). Individual large flares last several thousand seconds, however, more rapid variability can also be seen in the light curve on timescales of 100–200 seconds. There is also a systematic decrease in intensity which can be seen to continue at the start of the Jan 8 data, after which intensity fluctuations become relatively small compared with the earlier strong flaring.
Light curves were also extracted in a low, a medium and a high energy band, suitably chosen to allow derivation of hardness-intensity diagrams. The energy bands
used were 1.9–4.1 keV (low), 4.1–7.3 keV (medium) and 7.3–18.5 keV (high), which selecting the channel-to-energy conversion appropriate to Epoch 3, correspond to the channel ranges 0–10, 11–19 and 20–50. Fig. 2 (a)–(c) shows the background-subtracted, deadtime-corrected light curves in these bands. A lightcurve was also extracted for standard-mode data from Cluster 1 of the HEXTE instrument with at time resolution of 32 s using the program hxtlcurv; this also carries out background subtraction and deadtime correction, and the latest deadtime coefficients file released in February, 2000, applied. The background subtracted, deadtime corrected lightcurve is shown in Fig. 2d in the total band, effectively 18–50 keV in this source. Fig. 2 demonstrates dramatically the high-energy nature of flaring. In the low energy band (Fig. 2 a), the intensity increases by 50%, while in the high band (Fig. 2c), the increase is 100% and in HEXTE (Fig. 2d) the increase is by 250%. The spectra show that most of the HEXTE counts are in the band 20–50 keV.
5.2 Hardness ratios
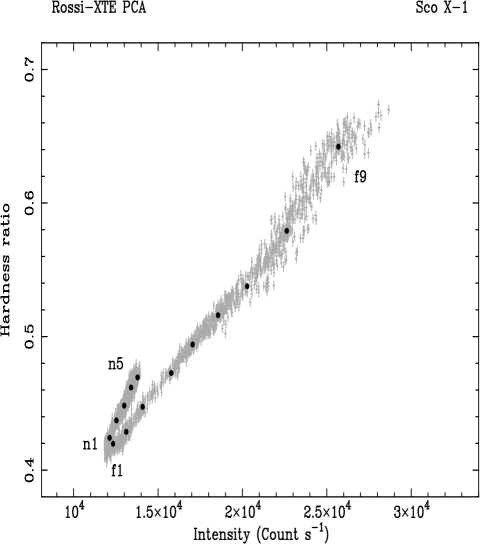
Hardness ratios were formed by dividing the intensities in the 7.3–18.5 keV and 4.1–7.3 keV bands, i.e. the high and medium bands. The variation of the hardness ratio with the summed intensity in the three bands spanning 1.9 to 18.5 keV is shown in Fig. 3 which also shows data selected for spectral analysis (below). The hardness ratio clearly shows two well-defined tracks, corresponding to the Normal and Flaring branches of the Z-track, containing the soft apex between these, but without horizontal track data or the hard apex. Clearly, Sco X-1 underwent a transition between the Flaring Branch and the Normal Branch during the observation. The location of the transition in the overall light curve (Fig. 1) was located by examining each individual data section (separated by data gaps due to SAA passage and Earth occultation). For each section, a hardness-intensity plot was made and overlayed on Fig. 3, allowing the section to be located on either the Flaring or Normal Branch. This revealed that the transition took place at a time of 95 ksec, so that all data before this was on the Flaring Branch, and all data later than this on the Normal Branch. Before the transition, the source oscillates backwards and forwards on the Flaring Branch. However, close inspection of the total light curve (Fig. 1) shows that even on the Normal Branch, several flare-like variations of small amplitude continue, each lasting 1000 seconds.
5.3 Selection of spectra
Data were next chosen for spectral analysis so as to span each branch with a number of spectra. Firstly, Flaring Branch data were selected by filtering for times less than 95 ksec. Then 9 intensity bands were chosen and the corresponding time intervals containing data in each band determined. These time filters (GTI: Good Time Intervals) were then used to produce light curves and spectra (f1 – f9) for each of the selections. Similarly, 5 bands were chosen for Normal Branch data (n1 –n5). Each selection was tested by overlaying the selected data as a mean value on the hardness-intensity diagram of Fig. 3. It can be seen that the selections used were satisfactory in that the points lie along the centres of the tracks. We have carried out a substantial amount of testing of this procedure, using the present data, and data on other Z-track and atoll sources. As the objective is to reveal the physical changes taking place during track movement, it is important that spectral points lie approximately along the centre of tracks. If this was not the case, spectral fitting results were found to change less systematically, as motion perpendicular to the track as well as parallel was taking place.
For each selection, spectra were extracted for the PCA using Standard 2 data, and corresponding background spectra generated.


Deadtime correction was performed, and finally a correction made for pulse pileup effects using dedicated software, which is a significant correction in the case of Sco X-1. A time constant of 1.80 sec was used as the best value for high count rates in the left anode detector (Jahoda et al. 1996). The high count rates resulted in the Poisson errors in spectral channels being very small, and so a
| spectrum | norm | norm | norm | /d.o.f. | ||||
|---|---|---|---|---|---|---|---|---|
| keV | keV | |||||||
| Normal Branch | ||||||||
| n1 | 2.050.08 | 0.680.22 | 1.890.28 | 6.0 | 181 | 6.200.34 | 0.820.66 | 41/54 |
| n2 | 2.120.06 | 0.800.26 | 1.980.39 | 6.4 | 200 | 6.110.35 | 1.030.60 | 29/54 |
| n3 | 2.160.05 | 0.820.17 | 1.900.23 | 6.1 | 191 | 6.260.36 | 0.810.50 | 30/54 |
| n4 | 2.160.04 | 0.920.15 | 1.930.19 | 6.4 | 195 | 6.280.33 | 0.740.40 | 32/54 |
| n5 | 2.210.08 | 1.070.20 | 2.000.27 | 6.5 | 215 | 6.310.19 | 0.810.15 | 34/54 |
| Flaring Branch | ||||||||
| f1 | 2.020.07 | 0.700.20 | 1.850.27 | 5.7 | 181 | 6.230.35 | 0.890.54 | 46/54 |
| f2 | 1.960.05 | 1.010.18 | 1.990.22 | 6.1 | 208 | 6.190.17 | 0.990.20 | 45/54 |
| f3 | 2.000.04 | 1.220.23 | 1.960.32 | 5.9 | 211 | 6.180.36 | 1.110.70 | 30/54 |
| f4 | 2.010.06 | 1.560.23 | 1.980.29 | 6.0 | 227 | 6.280.32 | 1.160.67 | 42/54 |
| f5 | 2.040.04 | 1.870.22 | 2.080.28 | 6.6 | 254 | 6.250.30 | 1.310.84 | 53/54 |
| f6 | 2.050.03 | 2.080.21 | 2.110.26 | 7.4 | 267 | 6.390.26 | 1.110.44 | 29/48 |
| f7 | 2.120.03 | 2.730.23 | 2.320.24 | 7.6 | 358 | 6.300.19 | 1.460.32 | 28/45 |
| f8 | 2.220.02 | 3.440.20 | 2.500.23 | 8.6 | 457 | 6.280.16 | 1.740.28 | 31/45 |
| f9 | 2.400.02 | 4.190.19 | 2.540.20 | 10.3 | 496 | 6.340.16 | 2.130.36 | 50/47 |
The normalization of the blackbody is in units of erg s-1 for a distance of 10 kpc, the normalization of the cut-off power law is in units of photon cm-2 s-1 keV-1 at 1 keV and the line normalization has units of photon cm-2 s-1.
systematic error of 2% was applied to each channel instead of the more normal 1%, to avoid obtaining unrealistic values of . HEXTE spectra were also extracted for each selection using the GTI filters from the PCA in each case using the RXTE-specific Ftool hxtlcurv. Each raw data file from Cluster 1 provided a source and a background spectrum, and the individual spectra were then added.
5.4 Spectral fitting results
To establish the upper limit to the usable energy range in each instrument, a source spectrum (source + background) was compared with the background spectrum. This showed that in general PCA data could be used up to 22 keV (where the source flux was substantially greater than the background), and HEXTE data could be used up to 50 keV. The bands 2.5 – 22 keV and 20–50 keV were firstly applied in spectral fitting. However, inspection of individual spectra sometimes required further channels to be ignored so as to exclude data, for example, above 21 keV in the PCA if the Poisson errors became too large for sensible fitting. An instrument response function was generated for the PCA using pcarsp embodying the latest improvements to the response made in 2002 by the release of Ftools 5.2. Use of the latest response function made a significant difference to spectral fitting results. The appropriate HEXTE response files for Cluster 1 were applied (i.e. the arf file of May 26, 2000 and the rmf file of March 20, 1997). The rmf file was rebinned to a total of 64 channels to match the HEXTE data with the Ftool rbnrmf.
PCA and HEXTE spectra were fitted simultaneously using Xspec allowing a normalization factor for HEXTE with respect to the PCA. Parameter values were chained between the PCA and HEXTE. Because the PCA does not extend below 2.5 keV where the column density is largely defined, the Galactic column density was set to the value atom cm-2 (Christian & Swank 1997). Simple one-component models were entirely unable to fit the spectra. Fitting a typical spectrum (n1: on the Normal Branch close to the soft apex) gave /d.o.f. = 7099/60 for an absorbed power law, 6281/60 for an absorbed blackbody, 1340/60 for absorbed bremsstrahlung, and 98/59 for an absorbed cut-off power law, although in the last case, the value of the normalization constant was unacceptable (close to unity).
Next, the two-component model discussed in Sect. 1 was applied, consisting of an absorbed blackbody and a cut-off power law: ab*(bb + cpl), the blackbody originating on the neutron star, and the Comptonized emission in an extended accretion disk corona. This model gave /d.o.f. = 92/57 for spectrum n1; however, it was clear from the residuals that a broad iron line was present, so the final model tried was ab*(bb + cpl + gau), with a Gaussian line added. This model gave /d.o.f. =41/54, and provided excellent fits to all of the spectra. The line half-width was fixed at 0.8 keV, to avoid the tendency of a broad line in spectral modelling to absorb the neighbouring continuum. A typical fit (spectrum n1) is shown in Fig. 4, and the fitting results for all spectra shown in Table 1.
We also fitted a two-component model consisting of blackbody emission from the neutron star plus the Zdziarski et al. (1996) Comptonization model (the thcompds model in Xspec) with disk blackbody seed photons. This model corresponds approximately to Comptonization in an extended ADC, except that the seed photons are assumed to originate from the complete disk instead of the inner 15%. However, tests have shown that this does not affect the spectrum above 0.1 keV. Spectral fitting results using this model were essentially identical with those shown in Table. 1, with no discernible differences in blackbody parameters for any spectrum, and only minor changes in power law index. This test demonstrates that a cut-off power law representation of Comptonization is valid given the extended nature of the ADC.


Spectral fitting results using the Birmingham model for the blackbody emission component are shown in Fig. 5 as a function of total luminosity in the band 1–30 keV, calculated assuming that the distance of Sco X-1 is 2.8 kpc (Bradshaw et al. 1999). Firstly, the upper panel gives the variation of blackbody temperature with total luminosity. It can be seen that as the source moves along the Flaring Branch to higher intensities, rises, rather slowly at first, and then faster. In fact, during the first 40% of the flaring movement, the increase in is small so that the changes are close to being isothermal. However, the luminosity of the blackbody component , obtained from the blackbody flux in the band 1–30 keV, increases all along the Flaring Branch (Table 1), as can be seen in the lower panel. Thus, it is clear that the early stages of flaring are dominated by an increase in blackbody area as the emitting region spreads over the neutron star. This is accompanied by an increase of to 2.4 keV at the peak of flaring. The central panel shows as a function of , with a smooth progression of values along the tracks as in the upper panel.
A smooth progression of values also takes place in movement along the Normal Branch towards the soft apex. It is immediately apparent from the upper panel that the total luminosity decreases as the source moves along the Normal Branch towards the apex. The lower panel shows that as well as decreases during Normal Branch movement towards the apex, i.e. the luminosity of the Comptonized emission also decreases. These results suggest that may actually decrease on the Normal Branch, contrary to the widely-held view that increases continually (see Sect. 6). Of course, it has been known for a long time that the X-ray intensity decreases on the Normal Branch, and this clearly presents a problem for the hypothesis that continually increases. One possibility is that the inferred from the luminosity is not the total, but only part of it (van der Klis 2000).
Finally, the lower panel shows that the blackbody luminosity bears a remarkably simple relation to the total luminosity, that is close to linear, but not passing through the origin, so that at the soft apex, is about 10% of , this fraction increasing to 30% at the peak of flaring.


Properties of the Comptonized emission are shown in Fig. 6. The normalization (lower panel) increases as flaring progresses. It is interesting that the Comptonization cut-off energy also increases systematically in flaring, implying an increase of electron temperature in the Comptonizing region, i.e. the extended ADC above the accretion disk. This increase was not previously known in studies of flaring. There is also an increase in the power law photon index , from 1.8 at the soft apex to 2.5 at the peak of flaring; i.e. the Comptonized emission becomes much softer. There is not strong evidence for Normal Branch data being separate from Flaring Branch data, except possibly in the case of the cut-off energy. The decrease of towards the soft apex is supporting evidence that the blackbody luminosity does decrease on the Normal Branch as the apex is approached, assuming that the value of , i.e. , does depend on .


In Fig. 7, we show the line energy and normalization; the line width had been fixed in the fitting (Sect. 5.4). The line energy appears not to change during Z-track movement; i.e. there is no evidence for change within the errors and the energy is consistent with iron line emission at energy 6.4 keV, i.e. fluorescent iron emission. The tendency of the line energy to be slightly low at 6.3 keV may suggest the possible presence of an absorption feature (Parmar et al. 2002). The line normalization however, does change significantly, increasing on the Flaring Branch. This suggests that changes are due to the varying illumination by the neutron star blackbody.
6 Discussion
To discuss the changes taking place in the blackbody emission, we must first summarize the evidence we presented in previous papers that the neutron star blackbody emission is not substantially modified by electron scattering and that results from using a simple blackbody model are thus valid. In Sect. 1, we summarized the evidence that the blackbody emission in LMXB originates on the neutron star, not from the inner accretion disk. The present results show a continuous pattern of change in the blackbody from the non-flaring to the flaring state, and if we accept that X-ray flaring is analogous in high-luminosity sources to X-ray bursting in fainter sources, this is also evidence that the emission originates on the star.
In our study of X-ray flaring in the dipping LMXB X 1624-490 (Bałucińska-Church et al. 2001), we review the evidence for and against possible modification of the neutron star blackbody. It has sometimes been claimed that neutron star blackbody emission should be modified by electron scattering in which case, fitting a simple blackbody could give incorrect results. It was concluded that no substantial modification takes place, as the evidence for modification is limited to a fraction of X-ray bursts in which rises to apparently super-Eddington values of 3 keV or more. In many bursts, and in non-burst emission there is no evidence for modification. Moreover, whether modification takes place depends strongly on the electron density in the atmosphere of the neutron star which is poorly known.
The present results show that flaring consists of strong changes in the blackbody emission. We can use the spectral fitting results to derive the blackbody emitting area via Stefan’s law: = 4 . In Fig. 8, we show the blackbody radius on which the emitting area depends.


On the Flaring Branch, there is a substantial increase in blackbody radius up to a maximum value, after which the radius decreases. The maximum value is 9.40.6 km, consistent with the radius of the neutron star. Fig. 3 shows a break in the flaring branch hardness-intensity diagram such that the flaring becomes harder after this break ( count s-1), and it is clear that this break takes place when the emission covers the whole of the neutron star. The value of increases at first slowly in flaring, then more rapidly. While it has been known for many years that increases in flaring in sources similar to Sco X-1, the increase of to a maximum value of 10 km, has not been known. It may also be that this does not always take place, and is a feature of the source when very bright.
On the Normal Branch, the blackbody radius decreases slightly as the soft apex is approached, while falls, and the measured decreases substantially. The most interesting feature is the implied decrease of on the Normal Branch. This is contradictory to the view widely-held that in motion along the Z-track from Horizontal to Flaring Branch, increases continuously. This was proposed by Hasinger et al. (1989), who noted that this would however require and intensity to be anti-correlated on the Normal Branch; i.e. it is a difficult to explain increasing mass accretion rate but decreasing X-ray intensity. Hertz et al. (1992) showed that the properties of Sco X-1 depend on distance along the Z-track measured from the soft apex, with positive values on the Flaring Branch and negative values on the Normal Branch. Thus, the smooth progression of properties implies dependence on a single parameter, normally assumed to be . Vrtilek et al. (1990) made ultraviolet line and continuum observations of Cyg X-2 simultaneously with Ginga X-ray observations, and argued that the ultraviolet emission increased along the Z-track supporting the contention that increases. However, the label of Flaring Branch had been assigned to data with strong variability due to X-ray dipping which thus may not have been real flaring branch data. Omitting these data from the results would mean that there is no very dramatic correlation of UV emission with track position. However, our results do suggest that decreases on the Normal Branch, since the luminosities of both spectral components decrease. Clearly, this possibility is important to the understanding of the Z-track sources.
We next compare these results for with results previously obtained: i) from the ASCA survey of LMXB (Church & Bałucińska-Church 2001), and ii) a study of X-ray flaring in the bright dipping LMXB X 1624-490 Bałucińska-Church et al. 2001). In the ASCA survey, an empirical relation was found between , the half-height of the emission region on the neutron star, and the equilibrium height height of the inner radiatively- supported disk. Over more than 3 decades of luminosity covered by the survey sources, it was found that , suggesting possible mechanisms that determine the extent of the blackbody emitting area on the star. Comparison of these results with the model of Inogamov & Sunyaev (1999) was made by Church et al. (2002). However, at the time of the survey, it was clear that the Z-track sources could not be represented by a single point on the – diagram, and would have to form a track. In Fig. 8 (lower panel), we show the variation of with for the present data on Sco X-1. This is related to blackbody radius by 4 = 4, where is the radius of the neutron star assumed to be 10 km, so that = . We also show on this diagram, the half-height of the inner radiatively-supported accretion disk , given by the expression = (Frank et al. 1992), where is the Thomson cross-section. It can be seen that is substantially larger than the radius of the neutron star for all data in Fig. 8, which would imply that all of the star should be emitting. However, we would not expect an equality = for any of the present data if we assume that cannot be larger than 10 km. It is possible that closer equality between and took place on the Horizontal Branch for which no data are available. Alternatively, it may be that a simple calculation of the radiative disk height is not valid at such high mass accretion rates, since the inner disk may be modified by irradiation by the neutron star.
In the source, X 1624-490, strong flaring also takes place. This is a dipping but not a Z-track source; however strong flaring has been found to take place in this source (Bałucińska-Church et al. 2001) and has recently been discovered in other dipping LMXB such as XB 1254-690 (Smale et al. 2002; Church et al. 2003). These sources are known to have high inclination as dipping is observed, and are bright such that flaring takes place. However, it is not yet clear whether the physical changes taking place in flaring are the same as in Sco X-1 and other Z-track sources which do not have so high inclination. In the case of X 1624-490, it was shown that in the non-flaring source, there was an equality = ; however, as flaring progressed, the emitting area on the neutron star was strongly reduced falling to 10 times smaller than (Bałucińska-Church et al. 2001). It was suggested that the increase of radiation pressure of the neutron star blackbody emission in flaring had a strong effect on the inner disk, blowing away the top layers and reducing the vertical extent of the disk. This would then be expected to feed back onto the neutron star leading to a reduced emission region height , explaining the observed decrease. This effect took place at erg s-1. In the case of Sco X-1, the smallest luminosity is erg s-1, substantially larger so it may be the case that radiation pressure effects have taken place before the source got to its starting position in the present data. If a depression in emitting area did take place, it is not unreasonable to expect the area to increase again in flaring.
At the soft apex, = erg s-1 which is super-Eddington for a 1.4M neutron star for which erg s-1, but depends on opacity and composition (Paczynski 1983). The measured total luminosity at the peak of flaring at erg s-1 is extremely super-Eddington; however, reaches a level of erg s-1 which is more consistent with the Eddington limit. The decrease in blackbody radius after the peak of flaring may thus be related to radiation pressure effects. Sco X-1 is one of a very small number (4) of persistent Galactic low mass neutron star binaries that are, at times, substantially super-Eddington (Grimm et al. 2002; Christian & Swank 1997; Church & Bałucińska-Church 2001). The above results depend of course, on the distance of Sco X-1. The distance to Sco X-1 was not well known, but a distance of 1.5 kpc was consistent with a luminosity of 1038 erg s-1 (White et al. 1985). However, Bradshaw et al. (1999) from parallax measurements of the radio emission of Sco X-1 in a series of eight VLBA observations spanning 3 years obtained a parallax of 0.000360.00004′′, and a distance of 2.80.3 kpc which we have adopted. This has the consequence that the luminosity of Sco X-1 can be several times the Eddington limit.
Finally, we review the changes in the Comptonized emission and iron line emission during track movement. As seen previously, a striking feature is the increase of Comptonization cut-off energy in flaring implying an increase of electron temperature in the Comptonizing region by a factor of two. This is the first time that such heating effects on the ADC plasma due to flaring have been seen. There is also a systematic increase in power law photon index to 2.5 at the peak of flaring. The line energy does not change and at 6.4 keV implies fluorescent emission. This may originate in the ADC itself, providing the density is high so that the ionization parameter is sufficiently low (see Bałucińska-Church et al. 2001) or possibly in the disk below the ADC. The increase of the line normalization in flaring could be explained either by the effects of illumination of the emission region by the neutron star or by a change of . These aspects will be further investigated in future work.
Acknowledgements.
This work was partially supported by Polish KBN grant PBZ-KBN-054/P03/2001References
- (1) Bałucińska-Church, M., Church, M. J., Oosterbroek, T., et al. 1999, A&A, 349, 495
- (2) Bałucińska-Church, M., Humphrey, P. J., Church, M. J., & Parmar, A. N. 2000, A&A, 360, 583
- (3) Bałucińska-Church, M., Barnard, R., Church, M. J., & Smale, A. P. 2001, A&A, 378, 847
- (4) Barnard, R., Bałucińska-Church, M., Smale, A. P., & Church, M. J. 2001, A&A, 380, 494
- (5) Bradshaw, C. F., Fomalont, E. B., & Geldzahler, B. J. 1999, ApJ, 512, 121
- (6) Bradt, H. V., Rothschild, R. E., & Swank, J. H. 1993, A&AS, 97, 335
- (7) Canizares, C. R., Clark, G. W., Li, F. K., et al. 1975, ApJ, 197, 457
- (8) Church, M. J. 2001, Proceedings of 33rd Scientific Assembly of COSPAR, Warsaw, July 2000, Adv Space Res, 28, 323
- (9) Church, M. J., & Bałucińska-Church, M. 1995, A&A, 300, 441
- (10) Church, M. J., & Bałucińska-Church, M. 2001, A&A, 369, 915
- (11) Church, M. J., Dotani, T., Bałucińska-Church, M., et al. 1997, ApJ, 491, 388
- (12) Church, M. J., Bałucińska-Church, M., Dotani, T., & Asai, K. 1998a, ApJ, 504, 516
- (13) Church, M. J., Parmar, A. N., Bałucińska-Church, M., et al. 1998b, A&A, 338, 556
- (14) Church, M. J., Inogamov, N. A., & Bałucińska-Church, M. 2002, A&A, 390, 146
- (15) Church, M. J., Bałucińska-Church, M., & Smale, A. P. 2003, A&A, in preparation
- (16) Christian, D. J., & Swank, J. H. 1997, ApJS, 109, 177
- (17) Done, C., Życki, P., & Smith, D. A. 2002, MNRAS, 331, 453
- (18) Frank, J., King, A. R., & Lasota, J.-P. 1987, A&A, 178, 137
- (19) Frank, J., King, A. R., & Raine, D. 1992, “Accretion Power in Astrophysics”, Cambridge University Press
- (20) Grimm, H.-J., Gilfanov, M., Sunyaev, R. A. 2002, A&A 391, 923
- (21) Hasinger, G., Priehorsky, W. C., & Middleditch, J. 1989, ApJ, 337, 843
- (22) Hertz, P., Vaughan, B., Wood, K. S., et al. 1992, ApJ, 396, 201
- (23) Inogamov, N. A., & Sunyaev, R. A. 1999, Astron Lett, 25, 269
- (24) Jahoda, K., Swank, J. H., Giles, A. B., et al. Stark, M. J., Strohmayer, T., Zhang, W., Morgan, E. H., 1996, SPIE, 2808, 59
- (25) Kuulkers, E., van der Klis, M., & Vaughan, B. A. 1996, A&A, 311, 197
- (26) Mason, K. O., Charles, P.A., White, N. E., et al. 1976, BAAS, 8, 433
- (27) Mitsuda, K., Inoue, H., Nakamura, N., & Tanaka, Y. 1989, PASJ, 41, 97
- (28) Muno, M. P., Remillard, R. A., & Chakrabarty, D. 2002, ApJ, 568, L35
- (29) Paczyński, B. 1983, ApJ, 267, 315
- (30) Parmar, A. N., Oosterbroek, T., Boirin, L., & Lumb, D. 2002, A&A, 386, 910
- (31) Psaltis, D., Lamb, F. K., & Miller, G. S. 1995, ApJ, 454, L137
- (32) Smale, A. P., Church, M. J., & Bałucińska-Church, M. 2001, ApJ, 550, 962
- (33) Smale, A. P., Church, M. J., & Bałucińska-Church, M. 2002, ApJ, 581, 1286
- (34) van der Klis, M. 2000, Ann Rev Astron Astrophys, 38, 717
- (35) van der Klis, M., Stella, L., White, N. E., Jansen, F., & Parmar, A. N. 1987, ApJ, 316, 411
- (36) van Paradijs, J., & Lewin, W. H. G. 1986, Proceedings of the NATO Advanced Research Workshop, Rottach-Egern, West Germany, June 17-20, 1985. Dordrecht, D. Reidel Publishing Co.
- (37) Vrtilek, S. D., Raymond, J. C., Garcia, M. R., et al. 1990, A&A, 235, 162
- (38) Walter, F. M., Mason, K. O., Clarke, J. T., et al. 1982, ApJ, 253, 67
- (39) White, N. E., & Swank, J. H. 1982, ApJ 253, L61
- (40) White, N. E., Mason, K. O., Sanford, P. W., Ilovaisky, S. A., & Chevalier, C. 1976, MNRAS, 176, 91
- (41) White, N. E., Peacock, A., & Taylor, B. G., 1985, ApJ, 296, 475
- (42) White, N. E., Peacock, A., Hasinger, G., et al. 1986, MNRAS, 218, 129
- (43) White, N. E., Stella, L., & Parmar, A. N. 1988, ApJ, 324, 363
- (44) Zdziarski, A. A., Johnson, W. N., & Magdziarz, P. 1996, MNRAS, 283, 193