11email: momany,piotto,bedin,ortolani,recio@pd.astro.it 22institutetext: INAF - Osservatorio Astronomico di Collurania, Via M. Maggini, 64100 Teramo, Italy
22email: cassisi@te.astro.it 33institutetext: Istituto di Astrofisica Spaziale e Fisica Cosmica, CNR, Via del Fosso del Cavaliere, 00133, Roma, Italy 44institutetext: Osservatorio Astronomico di Trieste, via Tiepolo 11, 34131 Trieste, Italy
44email: castelli@ts.astro.it
Why Hot Horizontal Branch Stars Can Appear Redder Than Red Giants ††thanks: Based on observations with the ESO/MPI 2.2m telescope, located at La Silla Observatory (Chile) and on observations with the NASA/ESA Hubble Space Telescope.
In this paper we report on a curious feature in the , () color-magnitude diagrams of globular clusters. In our database, we find that a considerable fraction of blue horizontal branch stars, hotter than the instability strip and cooler than the Grundahl et al. (1999) jump (i.e., (K)), have () colors redder than their red giant progenitors. This red incursion is not expected on theoretical grounds, as horizontal branch stars (whose convective regions are less extended than in red giant structures) should not “appear” cooler than a red giant. Analyzing data from different telescopes we show that: 1) the horizontal branch red incursion is strongly dependent on the shape of the adopted filter and to a lesser extent, on the filter; 2) the photometry done with filters which do not encompass the Balmer jump, do not show the blue horizontal branch red incursion; 3) the occurrence of this feature is also due to the peculiar dependence of the and magnitudes on stars effective temperature, gravity, and metallicity; 4) theoretical tracks can reproduce the observed horizontal branch morphology, provided that the appropriate (i.e. exactly responding to the filters effectively used in the observations) transmission curve efficiencies are used for deriving color- transformations; 5) the red incursion extent depends on metallicity.
Key Words.:
stars: imaging — stars: evolution — stars: Hertzsprung- Russell diagram — stars: horizontal-branch — ultraviolet: stars1 Introduction
Color-magnitude diagrams (CMD) of resolved stellar populations are the fundamental tool for testing predictions of stellar evolutionary theory and the capability of stellar models to finely reproduce the observations. Photometric studies are no longer limited to the classical bands, as high quality near-infrared and ultraviolet CMDs are becoming more and more available. Ultraviolet (UV) bands certainly cover the ideal wavelength region for the study of hot stellar populations. Indeed, UV observations help to remove the degeneracy between color and temperature for hot blue horizontal branch (HB) stars, allowing a more reliable measurement of atmospheric parameters (in particular temperature estimates).
Recently, the blue horizontal branch (BHB) population has been the subject of specific UV studies, and some interesting features were revealed only in ultraviolet CMDs: jumps (Grundahl et al. grun99 (1999), G99, Momany et al. moma02 (2002)), and peculiar horizontal branch extensions, like the blue-hook (D’Cruz et al. cruz00 (2000), Brown et al. brow01 (2001)). The ultimate goal of these studies is a better understanding of the physical mechanisms governing core-helium burning stars, and driving the horizontal branch morphology. To this end, our group has undertaken a long-term project to obtain wide-field multi-wavelength data of BHB globular clusters (GCs). Mainly, we used the WFPC2 on board of HST to map the central core of our target clusters (Piotto et al. piotto02 (2002)), and the wide field imager (WFI) at the ESO/MPI 2.2m for the coverage of the outer regions. Unfortunately, observations carried out through non-standard photometric systems sometimes generate puzzling and apparently un-physical properties in the observed CMDs.
In this paper we report on a curious feature in the observed HB morphology in the UV color-magnitude diagrams, and an explanation for it. Basically, in some of the , () diagrams of our database, we find that the blue HB stars hotter than the instability strip and cooler than the G99 –jump () have colors that place them on the right hand side of the red giant branch (RGB).
According to stellar evolutionary theory blue HB stars should not “appear” cooler than their RGB progenitor. Indeed, HB stars have hotter effective temperature than RGB stars with the same metallicity. In a color-magnitude diagram, we do not expect any red incursion of BHB stars to the cooler side of the RGB (which almost corresponds to the Hayashi track): for stars in hydrostatic equilibrium and having convection, the Hayashi line separates a permitted region (on its left) from a forbidden one (on its right). Despite this theoretical constraint, we will show that the unexpected finding of the BHB red incursion is present in at least 6 , () CMDs of BHB clusters we have observed. We will also show that this peculiarity is not present in all the CMDs from broad band photometry of BHB clusters, as the effect depends on the metallicity.
As discussed in Section 3, it turns out that the apparent anomaly rises when “non-standard” filters are used. We decided to publish these color-magnitude diagrams, and discuss the origin of the apparently un-physical HB morphology, in order to call the attention on the importance of using appropriate filter sets when acquiring photometric data. Alternatively, and for a proper interpretation of the empirical data, this paper shows the importance of using exactly the photometric passbands of the observational system when transforming the theoretical tracks to the observational plane.
2 Observations and Data Reductions
We present data collected with the Hubble Space Telescope (HST), and the ESO/MPI 2.2m telescope. data of NGC7089 and NGC5139 were taken on June 2002 with the Wide-Field-Imager (WFI) at the ESO/MPI 2.2m, employing the “new” filter (Germany germ02 (2002)). A second data set of NGC7078 and NGC7099 images was obtained on July 2000, employing the “old” filter at the same telescope.
Basic reduction of the CCD mosaic was performed using the IRAF package MSCRED (Valdes 1998), while stellar photometry was done using DAOPHOT/ALLFRAME (Stetson 1994). Calibration to the standard system was obtained using a set of standard stars from Landolt (1992). HST data of NGC7099, NGC7078, and NGC6205 were taken in the FW, FW, and FW bands. For these clusters we present only instrumental diagrams. Besides the HST and 2.2m data, we present published data of NGC1904 by Kravtsov et al. (krav97 (1997)), and NGC1841 by Alcaino et al. (alca96 (1996)), both collected at the ESO/NTT telescope. Lastly, we present composite catalogs of NGC4833 and NGC4590. The photometry of these clusters were taken from Melbourne et al. (mel00 (2000)) and Walker (walker94 (1994)), while the photometry were obtained employing the WFI “new” filter at the 2.2m telescope.
3 The Blue Horizontal Branch Red Incursion
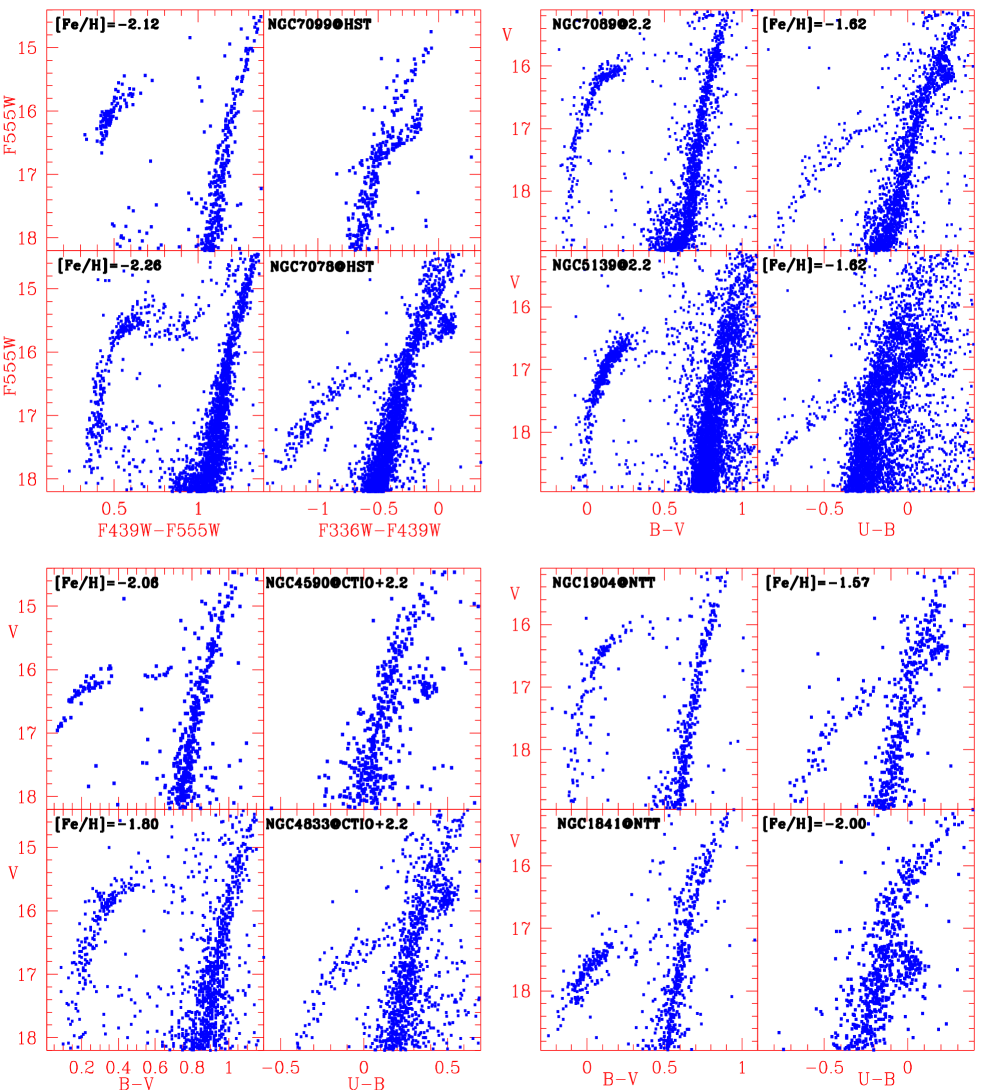
Figure 1 shows a zoom around the HB in the , () and , () diagrams of the 8 GCs, obtained with the 4 different telescopes (HST, NTT, CTIO and 2.2m ESO telescope). The clusters span a range in metallicity of dex, from the metal-poor regime to intermediate metallicity. For all clusters in the sample, the presence of the HB elbow and its incursion through the RGB is quite evident. Due to the larger sample of HB stars, it is really impressive in NGC7089, NGC7078, and NGC5139111, () diagrams of these clusters show even a greater extent of the red incursion. Note how the blue HB of NGC7099 lies almost entirely on the red side of the RGB in the , () diagram.
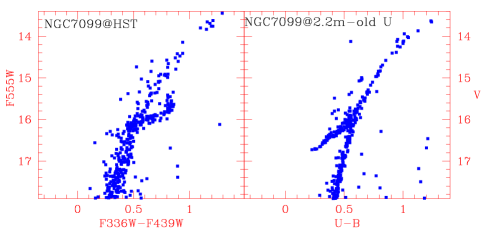

Figure 2 shows some of the conflicting results we faced in the course of our investigation. The , () diagrams of NGC7099, from data collected at two different telescopes, show completely different HB morphologies. In the case of the diagram obtained with HST, the BHB incursion is clearly visible, while in the other diagram (based on data collected with the 2.2m telescope) the BHB does not cross the cluster RGB at all. These differences are not to be attributed to the limit of the UV region reachable from the ground (at variance with the HST space observations), as Fig. 1 shows two CMDs (for NGC7089 and NGC5139), from data obtained at the ESO/MPI 2.2m telescope, clearly disclosing the HB red incursion. Neither the effect can be attributed to red leakage in the employed filters (the WFPC2 F336W and WFI new- filters are known to be affected by red-leaks). Red leakage is affecting mainly RGB stars, causing them to have smaller than expected magnitudes and therefore bluer colors. Indeed, considering the F336W filter (the most affected by red leakage among our filters) we calculate that for an RGB star at the level of the HB, with [Fe/H], the red leakage in the F336W band causes a blue-ward shift of only magnitude while the effect we discuss in this paper is of the order of few tenths of a magnitude.
The apparent contradictory results shown in Fig. 2 lead us to search for differences among the filters adopted to acquire the different data sets, in particular at the ESO/MPI 2.2m telescope. We found that the 2.2m data showing the BHB incursion were obtained using the two “new” and filters (Germany germ02 (2002)), while data not showing the incursion were obtained with the “old” and filters.
Prompted by this result, we have analyzed the normalized transmission curves of a variety of and filters (Fig. 3). We found that the “new” filter at the 2.2m, as well as the HST F336W, and the Strömgren filters, have a transmission curve with a peak around . On the other hand, the “old” filter at the 2.2m, and the Buser band (Buser buser78 (1978)) of the synthetic colors (Castelli cast99 (1999)) that were originally used for the transformations from the theoretical to the observational plane, have a transmission curve peaking around . It is worth mentioning that the latter group of filters have transmission curves that are closer to the standard Johnson (although this does not necessarily mean that the observational band, which is a convolution of the filter, CCD, telescope optics, and atmosphere transmission curves is exactly the standard Johnson (john55 (1955)) band). Interestingly enough, the clusters observed with the latter group of filters do not show the BHB incursion, whereas clusters observed through filters whose transmission peak at do. Also the filter can be important. For example, clusters observed with the new 2.2m filter and the old 2.2m filter (see Fig. 3) do not show the incursion. Clearly, it is the combination of non-standard and passband that creates the observed anomaly.
In Fig. 3 we show the normalized transmission curve of the filters used at the 2.2m, the HST F336W and F439W filters, and the Strömgren and filters. For two different metallicities ([Fe/H] and ), we also show synthetic spectra (Castelli & Kurucz cast03 (2003)) for BHB stars, and for RGB stars with surface gravity and effective temperature appropriate of red giants at the level of the HB luminosity. When comparing a BHB spectrum with the transmission curves of different and filters, it is clear that the occurrence of the BHB red incursion is related to the Balmer discontinuity: filters peaking around do not encompass the Balmer jump. These filters collect less flux with respect to filters peaking at . Consequently, the magnitudes of BHB stars are fainter and therefore their () colors will be redder. On the other hand, RGB stars have a shallower Balmer jump, hence these are less affected by differences in filters. Also important is the broadness of the new- filter at the 2.2m with respect to the old- filter. The blue side of the new- encompasses the Balmer jump, and is the cause of the anomalous morphology of the HB when the corresponding magnitudes are combined with new- filter at the 2.2m.
A deeper understanding of the BHB red incursion can be achieved when considering the dependence of the () color on stellar parameters such as surface gravity, effective temperature, and chemical composition. The synthetic photometry from the ATLAS9 models (Castelli cast99 (1999), Fig. 11) shows that, for a given gravity, the () index does not monotonically increase with decreasing temperature (see also Fig. 4). Instead, between K, the () index shows a minimum which increases with decreasing metallicity, and is almost independent from gravity. Moving towards higher temperatures (K), the () index increases from the quoted minimum and reaches a maximum value, whose intensity depends on gravity, but not on metallicity. The lower is the gravity, the higher is the maximum. Moreover, the () maximum moves from K for log to about K for log . This means that in a metal-poor cluster, the () index of a star with K and log (i.e. an HB star) may be close to the maximum value and therefore exceeds the () index of a RGB star with K.
This anomalous () behavior is not encountered when the “standard” -Buser filter or the old- filter at the 2.2m telescope are used, simply because the difference between the maximum and the minimum in the () curve is not large enough to produce the red incursion. On the other hand, the difference between the minimum and maximum () index becomes larger for filters with transmission curves shifted towards shorter wavelengths, to the point of producing the red incursion for the F336W filter on HST, Strömgren filter, and the new filter at the 2.2m telescope.
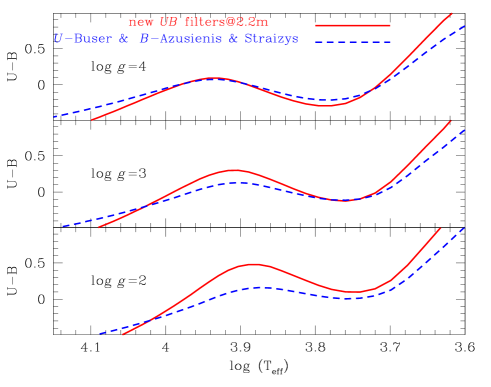
To better explain the red incursion observed for low gravity stars, we replaced in the synthetic photometry (Castelli, cast99 (1999)) the filter from Buser (buser78 (1978)) and the filter from Ažusienis & Straižys (azus69 (1969)) with the new and filters of the 2.2m photometric system. Figure 4 shows that, for typical gravities of HB stars (log ), there is a large difference in the () curves for the two sets of filters; particularly at the () maximum, where the difference is mag. Figure 4 also shows that while the difference between the () index of an HB star (log ) and an RGB star (log ) for the classical filters is approximately the same for all the temperatures, for the new filters at the 2.2m the () color of an HB star is redder than the () of an RGB star.
The effect we have just discussed is not new. It has been known as the “ultraviolet deficiency” of cool, BHB stars in the (, ) two-color diagram (see Markov et al. mark01 (2001) and references therein). Analyzing data for 6 GCs, Markov et al. compared the position of BHB stars with respect to i) a Population I sequence; and ii) a zero-age horizontal branch (ZAHB) two-color line, and quantified the deficiency. In analogy with our results, they also found that this observable is not common among all BHB clusters. Markov et al. argued that there exists a connection between this observable and cluster parameters. In particular, they showed how a satisfactory overlapping of the observed and theoretical sequences is achieved when using low-gravity (log ) atmospheric models.
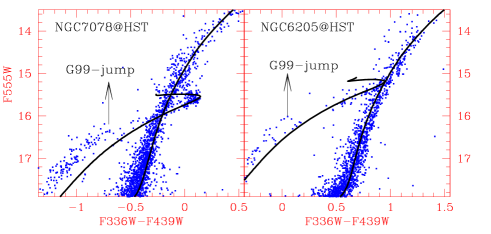
As expected from the above discussion, using a filter-set showing the BHB red incursion (e.g. the F336W filter on HST or the “new” filter at the 2.2m telescope) not all BHB clusters show the red incursion. It is clearly present in a metal-poor cluster like NGC7078, whereas completely missing in an intermediate metallicity cluster like NGC6205 (see also Fig. 6). Due to the small sample of clusters, we can neither observationally quantify the dependence of the effect on the cluster metal content nor precisely estimate the cutoff metallicity (if any) beyond which no incursion is observed. The fact that the HB of NGC1904 ([Fe/H], ) shows a red incursion, while NGC6205 ([Fe/H], ) does not show any incursion could suggest that this effect might be present mainly in clusters with metallicities lower than [Fe/H]. Inspection of the HST F555W, (F336WF439W) diagram of NGC6388 ([Fe/H], showing no indication of the incursion) suggests that the effect is not present in the CMDs from broad band photometry of high metallicity BHB clusters. In view of the strong dependence of the effect on the filter transmission curve, only a photometrically homogeneous observational data set, covering a large metallicity range will allow us to characterize the phenomenon, and investigate whether this feature can be used to constrain other cluster parameters, like metallicity, distance, and reddening.
The suggestion for a metallicity threshold of the incursion relies on a set of images collected with filters which are supposed to reproduce the standard Johnson bands at 3 widely used telescopes: HST, NTT and the 2.2m. It must be noted, as pointed out by the referee, that the red incursion effect is well visible also in other bands, like the Strömgren intermediate ones. However, the metallicity threshold is not present in all the photometric systems. Indeed, theoretical isochrones and ZAHBs (from the Cassisi & Salaris (cassisi97 (1997)) library) show the incursion in the Strömgren MV, () plane even at metallicities of , representative of metal rich GCs.
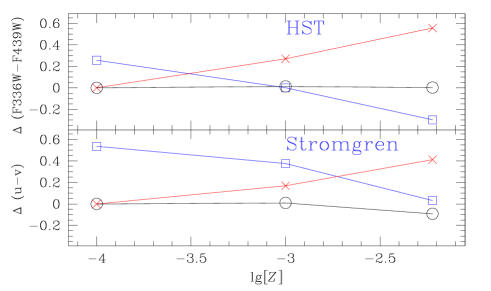
Figure 5 helps to understand the metallicity effect of the BHB red incursion. For the HST flight and the Strömgren photometric systems we have plotted the following three color differences as a function of metallicity: (1) measures the extent of the incursion, i.e. the difference in color between the reddest HB point and the RGB color at the level of the reddest HB point; (2) is the difference in color between the reddest HB point for the quoted metallicities and that for ; and lastly, (3) is the difference between the RGB colors (at the level of the reddest HB point for the three indicated metallicities) and that for . There are two important conclusions that can be drawn from Fig. 5. First of all, we confirm that, while the red incursion of the HB is present at least up to metallicities of in the Strömgren photometric system, the phenomenon is expected to disappear for clusters more metal rich than in the HST flight system, where the corresponding becomes negative. The second important evidence disclosed by Fig. 5 is that the extension of the red incursion (and its disappearance for more metal rich clusters in the broad band CMDs) is due to the fact that the RGB becomes redder and redder at increasing metallicity, while the color of the reddest HB point remains more less the same at varying the cluster metallicity.
In Fig. 6, we also compare the observed WFPC2/HST F555W, (F336WF439W) CMDs of NGC7078 and NGC6205 with the isochrones from Cassisi & Salaris (cassisi97 (1997)) transformed into the HST flight system. The data have not been calibrated, but the calibration to the HST flight system is simply a zero point translation, and does not affect the overall morphology of the CMD. It is worth noticing that the models reproduce very well the BHB “elbow” morphology, and, most importantly, reproduce the BHB red incursion when present. We have also compared the models with the CMDs from ground-based photometry for those clusters showing the BHB red incursion. In this case the models are not able to reproduce such a feature at all. This is a consequence of the fact that the -filter used to derive the color- relations (adopted for transforming the models from the theoretical to the empirical plane) is the -Buser filter, clearly inadequate to fit data obtained with “non-standard” filters (cf Fig. 3).
This occurrence strongly reinforces the need for appropriate color- relations, based on exactly the same filter passband used in the observations, in order to realize a meaningful comparison between theory and observations. Most importantly, the anomalous CMD morphology (produced by filters whose transmission is far from the standard ones) calls attention to another problem, often ignored by those in charge of the development and maintenance of imaging instruments: filter passbands must be as close as possible to the bands they pretend to reproduce. This simple rule makes the calibration to the standard photometric system more accurate, and avoids the production of apparently un-physical features in the observed CMDs.
4 Summary and final remarks
In the present work, we show the existence of a curious feature in the , () CMDs of some GCs. Quite surprisingly, in some observed CMDs, hot HB stars ((K) ) become redder than the much cooler RGB. An investigation of this effect has shown the following:
-
•
the size and the presence itself of this feature is strongly dependent on the passband of the adopted filter. In particular, filters which do not encompass the Balmer jump break, do not show the BHB red incursion;
-
•
also the -filter passband concur to cause the anomaly;
-
•
the occurrence of this feature is due to the peculiar dependence of the and filters on star effective temperature, gravity, and metallicity;
-
•
clusters more metal-rich than [Fe/H] do not show any BHB red incursion in the broad band Johnson and HST flight system, while there is no metallicity threshold in Strömgren photometry for metallicities lower than ;
-
•
evolutionary models using the correct filter passband, when transformed to the observational plane, finely reproduce the observed HB morphology.
We report this anomalous HB morphology to point out the importance of having observational photometric systems which accurately reproduce the standard ones. Unfortunately, the fact that the anomalous CMDs shown in this paper have been obtained from data acquired at some of the most widely used instruments for astronomical imaging shows how this problem is yet to be addressed.
Acknowledgements.
We warmly thank the referee, Frank Grundahl, for the useful comments which helped to improve the paper. In particular, we thank him for pointing out the presence of the effect described in this paper also in the CMDs from Strömgren photometry. We also thank G. Bono and V. Castellani for useful discussions on this matter. Y.M thanks S. Lucatello for useful discussions on stellar spectra. L.R.B., Y.M., S.O., G.P., and A.R.B. acknowledge the support of the MIUR (Cofin2001). S.C acknowledges financial support by MIUR (Cofin2002).References
- (1) Alcaino, G., Liller, W., Alvarado, F., Kravtsov, V., Ipatov, A., Samus, N., & Smirnov, O. 1996, AJ, 112, 2020
- (2) Ažusienis, A. & Straižys, V. 1969, Soviet Astronomy, 13, 316
- (3) Brown, T. M., Sweigart, A. V., Lanz, T., Landsman, W. B., & Hubeny, I. 2001, ApJ, 562, 368
- (4) Buser R. 1978, A&A, 62, 411
- (5) Cassisi, S. & Salaris, M. 1997, MNRAS, 285, 593
- (6) Castelli, F. 1999, A&A, 346, 564
- (7) Castelli, F.& Kurucz 2003, “Modelling of Stellar Atmospheres”, IAU Symp. 210, Eds. N.E. Piskunov, W.W. Weiss, D.F. Gray, PASP Conf. Ser., in press
- (8) D’Cruz, N. L. et al. 2000, ApJ, 530, 352
- (9) Germany, L. 2002, The Messenger, 107, 13
- (10) Grundahl, F., Catelan, M., Landsman, W. B., Stetson, P. B., & Andersen, M. I. 1999, ApJ, 524, 242 [G99]
- (11) Harris, W. E. 1996, AJ, 112, 1487
- (12) Johnson, H. L. 1955, Annales d’Astrophysique, 18, 292
- (13) Kravtsov, V., Ipatov, A., Samus, N., Smirnov, O., Alcaino, G., Liller, W., & Alvarado, F. 1997, A&AS, 125, 1
- (14) Landolt, A. U. 1992, AJ, 104, 372
- (15) Markov, H. S., Spassova, N. M., & Baev, P. V. 2001, MNRAS, 326, 102
- (16) Melbourne, J., Sarajedini, A., Layden, A., & Martins, D. H. 2000, AJ, 120, 3127
- (17) Momany, Y., Piotto, G., Recio-Blanco, A., Bedin, L. R., Cassisi, S., & Bono, G. 2002, ApJ, 576, L65
- (18) Piotto, G. et al. 2002, A&A, 391, 945
- (19) Stetson, P. B. 1994, PASP, 106, 250
- (20) Valdes, F. G. 1998, ASP Conf. Ser. 145: Astronomical Data Analysis Software and Systems VII, 7, 53
- (21) Walker, A. R. 1994, AJ, 108, 555