Weighting CMB and Galactic synchrotron polarisation
Abstract
We review the present knowledge of the diffuse Galactic synchrotron emission in polarisation. At microwave frequencies, we assess the expected contamination to the CMB polarisation angular power spectrum, for and modes, as expected after the WMAP first year measurements.
keywords:
cosmology , cosmic microwave background1 Introduction
An extraordinary improvement in Cosmic Microwave Background (CMB) observations is presently ongoing (see Bennett et al.2003 and references therein). Several balloon-borne and ground-based observations map CMB anisotropies on angular scales going from a few arcminutes to tens of degrees; the Wilkinson Microwave Anisotropy Probe111map.gsfc.nasa.gov (WMAP) satellite released recently the first year full sky maps, with angular resolution and a sensitivity of the order of ten K, on a frequency range extending from 22 to 90 GHz. The Planck satellite222astro/estec.esa.nl/SA-general/Projects/Planck will provide total intensity and polarisation full sky maps with resolution and a sensitivity of a few K, on nine channels in the frequency range 30-857 GHz.
Measurements of CMB polarisation are still at the beginning. As it is well known (see Zaldarriaga & Seljak 1997 and Kamionkowski, Kosowsky & Stebbins 1997), CMB polarisation is conveniently expressed in terms of and modes, non-local combination of the familiar and Stokes parameters. Total intensity and components are excited by all kinds of cosmological perturbations, namely scalars, vectors and tensors, and strongly correlated; the modes select vectors and tensors only. This rich phenomenology, and the hope to reveal tensors, i.e. cosmological gravitational waves, is the reason for the great effort toward CMB polarisation measurements, despite of the weakness of the signal, expected one order of magnitude less than total intensity. Recently, a first detection was carried out (Kovac et al.2002); WMAP was also successful in detecting the correlation.
Any CMB observation must control the foreground emission. Polarised foregrounds are less known than in total intensity, see De Zotti (2002) for reviews. At low CMB frequencies, say 100 GHz or less, the main foreground is synchrotron (Haslam et al.1982, Duncan et al.1997, 1999, Uyaniker et al.1999), which is the most known in polarisation, and the subject of this work. The free-free emission is relevant on the same frequencies, and is expected to be negligibly polarised. On higher frequencies, the Galactic thermal dust emission dominates, and is very poorly known in polarisation (Lazarian & Prunet 2002). Moreover, several populations of extra-Galactic sources are expected at all frequencies (see De Zotti 2002),
In this work we focus on the contamination coming from the diffuse polarised Galactic synchrotron emission. In Section 2 we review the current knowledge and forecast about this signal. In Section 3 we assess the level of contamination to the CMB radiation, on and modes, as expected after the first year WMAP measurements.
2 Guessing all sky polarised synchrotron
Current radio band observation cover about half of the sky at the degree resolution (Brouw & Spoelstra 1976), as well as low and medium Galactic latitudes with arcminutes resolution (Duncan et al. 1997, Uyaniker et al. 1999, Duncan et al. 1999), up to . These data allow an estimate of the polarised synchrotron fluctuations, and in particular their angular power spectrum, up to multipoles (Tucci et al. 2000, Baccigalupi et al. 2001, Giardino et al. 2002).
Giardino et al. (2002) assumed a theoretical polarisation degree of correlated with the Haslam et al. (1982) template at 408 MHz. The polarisation angle is assumed random and obeying the power spectrum derived from the high resolution radio observations mentioned above. The and simulated templates, reaching a resolution of about ten arcminutes, were then scaled in frequencies by considering either constant or a space-varying spectral index inferred by multi-frequency radio observations.
On sub-degree angular scales, by analysing the high resolution data in the radio band, Tucci et al.(2000) and Baccigalupi et al. (2001) found a quite flat slope for the polarisation angular power spectrum, , in agreement with Giardino et al. (2002) but with smaller amplitude. Baccigalupi et al. (2001) also estimated the power on super-degree angular scales, corresponding to multipoles , using the Brouw & Spoelstra (1976) data, finding a steeper behavior, .
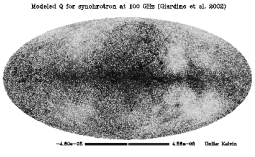
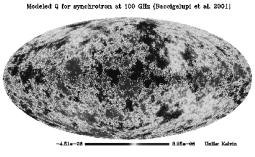
The two simulated templates, by Giardino et al. (2002), hereafter , and Baccigalupi et al. (2001), hereafter (obtained by properly rescaling the power of the template), are shown in figure 1, in a non-linear scale to highlight the behavior at high Galactic latitudes; the templates shown are for the Stokes parameter, the case of being qualitatively analogue, and have been extrapolated at 100 GHz. The two templates have roughly the same amplitude, but for more power on large angular scale can be clearly seen, and we return on this in the next Section. For completeness, we also show the template for the synchrotron spectral index as inferred by Giardino et al. (2002), in figure 2. As it can be seen, the spectral index is far from being uniform in the sky, having variations reaching on all Galactic latitudes, mostly on large angular scales.
Before going to consider the angular power spectrum and its relative strength compared to the CMB, it is interesting to look at the sky distribution of the forecasted synchrotron signal, to be compared with the Gaussianity of the CMB. The signal distributions are shown in figure 3; as expected for a Galactic signal, they are far from Gaussianity, and exhibit a marked super-Gaussian behavior. Note that this feature could be useful to reduce the contamination to the CMB, since recently proposed algorithms rely on the statistical independence of the signals to recover (Maino et al.2002).
3 Forecasted CMB contamination
As a CMB template, we generate a realization of the expected polarisation signal corresponding to the WMAP measurements, more precisely a flat Friedmann Robertson Walker (FRW) model according to table 7 in Spergel et al. (2003):
| (1) |
Moreover, we allow for a consistent background of gravitational waves, assumed to have a power which is with respect to the scalar one, with spectral index given by , according to the simplest inflationary prescription.
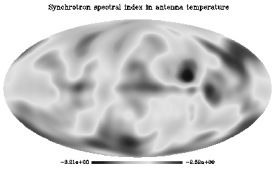
In Fig. 4 we report the power spectra of the and models compared to the CMB; in both panels, showing and modes, the dotted curve represents the CMB, while the upper and lower solid lines represent the and synchrotron models, respectively. The plots are at 100 GHz, in antenna temperature; at lower frequencies, the steep synchrotron frequency scaling makes the contamination rapidly worse, by a factor of about , according to the scaling represented in figure 2. At higher frequencies, the contribution from polarised dust emission is likely to become relevant (Prunet & Lazarian 2002). As a general feature, it can be noted how the Galactic emission has almost equal power on and modes, according to the most natural expectation for a non-cosmological signal (Zaldarriaga 2001).


The contamination is severe on large angular scales, almost covering the reinsertion bump, in both cases. The signal drops rapidly below the CMB at ; therefore, according to this scenario, the synchrotron contamination to the CMB mode acoustic oscillations should be irrelevant. On the other hand, the model predicts a severe contamination also for the first CMB acoustic oscillation, being although irrelevant at higher multipoles. This behavior clarifies the qualitative difference between the two template images in figure 1, where the power has clearly the dominant power on large angular scales, while the fine structure contribution for the case is much more important.
CMB modes are clearly dominated by foreground emission, on all scales and according to both models. Note that the level of power that we adopt is optimistically close to the upper limit set by WMAP, and corresponds to high energy inflation models. As we already stressed, at higher frequencies the contribution from polarised dust emission is likely to become relevant (Lazarian & Prunet 2002), and even a percent polarisation degree would greatly dominate the CMB modes.
Future CMB polarisation measurements must take into account the expected, severe contamination from diffuse Galactic synchrotron. In particular, modes are likely to receive a major contamination on all scales and at all frequencies. A way out is certainly the scanning of particularly clean regions; alternatively, the data analysis can suitably exploit the multifrequency coverage to isolate and subtract the Galactic contamination to the CMB. Although these are non-trivial tasks, they have to be accomplished in order to extract the whole scientific information contained in CMB polarisation.
The author warmly thanks Giovanna Giardino for useful discussions. The HEALPix pixelisation scheme, available at www.eso.org/healpix, by A.J. Banday, M. Bartelmann, K.M. Gorski, F.K. Hansen, E.F. Hivon, and B.D. Wandelt, has been extensively used.


References
- Baccigalupiet al. (2001) Baccigalupi C. et al.2001, A& A, 372, 8
- Bennettet al. (2003) Bennett et al.. 2003, ApJ submitted, preprint available at map.gsfc.nasa.gov
- Brouw (1976) Brouw W.N., Spoelstra T.A.T., 1976, A& AS 26, 129
- DeZotti (2002) De Zotti G., 2002 in Astrophysical Polarized Backgrouds, AIP conference proc. 609, S. Cecchini, S. Cortiglioni, R. Sault, and C. Sbarra eds., p. 295
- Duncanet al. (1997) Duncan A.R., Haynes R.F., Jones K.L., Stewart R.T., 1997, MNRAS 291, 279
- Duncanet al. (1999) Duncan A.R., Reich P., Reich W., Frst E., 1999, A& A 350, 447
- Giardinoet al. (2002) Giardino et al.2002, A& A 387, 82
- Haslamet al. (1982) Haslam C.G.T. et al., 1982, A&A S 47, 1
- Kovacet al. (2002) Kovac J. et al.2002, ApJ submitted, astro-ph/0209478
- Lazarian (2002) Lazarian A., Prunet S., 2002, in Astrophysical Polarized Backgrouds, AIP conference proc. 609, S. Cecchini, S. Cortiglioni, R. Sault, and C. Sbarra eds., p. 32
- Mainoet al. (2002) Maino D. et al.2002, MNRAS, 334, 53
- Spergelet al. (2003) Spergel et al.2003, ApJ submitted, preprint available at map.gsfc.nasa.gov
- Tucciet al. (2000) Tucci M. et al., 2000, New Astronomy 5, 181
- Uyanikeret al. (1999) Uyaniker B. et al.1999, A& AS 138, 31
- Zaldarriaga (1999) Zaldarriaga M., Seljak U., 1997, Phys.Rev.D 55, 1830
- Zaldarriaga (2001) Zaldarriaga M., 2001, Phys.Rev.D 64, 103001