High-Latitude H i in the Low Surface Brightness Galaxy UGC 7321
Abstract
From the analysis of sensitive H i 21-cm line observations, we find evidence for vertically extended H i emission (2.4 kpc) in the edge-on, low surface brightness spiral galaxy UGC 7321. Three-dimensional modelling suggests that the H i disk of UGC 7321 is both warped and flared, but that neither effect can fully reproduce the spatial distribution and kinematics of the highest -height gas. We are able to model the high-latitude emission as an additional H i component in the form of a “thick disk” or “halo” with a FWHM3.3 kpc. We find tentative evidence that the vertically extended gas declines in rotational velocity as a function of , although we are unable to completely rule out models with constant . In spite of the low star formation rate of UGC 7321, energy from supernovae may be sufficient to sustain this high-latitude gas. However, alternative origins for this material, such as slow, sustained infall, cannot yet be excluded.
Subject headings:
galaxies: ISM—galaxies: spiral—ISM: structure—galaxies: halos—galaxies: individual (UGC 7321)1. Background
UGC 7321 is a nearby, isolated Sd spiral galaxy seen nearly edge-on to our line of sight (). The distance to UGC 7321 is a matter of some uncertainty, but based on the brightest resolved stars it is estimated to be 10 Mpc (see Uson & Matthews 2003), and we adopt this value in the present work. UGC 7321 exhibits a highly flattened, diffuse stellar disk with no bulge component (Figure 1), and a very small intrinsic stellar scale height (150 pc; Matthews 2000). Its photometric properties have been studied by Matthews, Gallagher, & van Driel (1999), who found that it has an intrinsically low optical surface brightness disk [23.5 mag arcsec-2], indicative of a low current star formation rate. This is corroborated by its low far-infrared luminosity (), the nondetection of 21-cm radio continuum emission by Uson & Matthews (2003; mJy), and the rather modest H emission in this galaxy ( erg s-1; see Section 4.2). The high neutral gas content of UGC 7321 relative to its blue luminosity (1.0 /), together with its low dust content (Matthews & Wood 2001), moreover suggest that this galaxy has been an inefficient star-former over most of its lifetime.
Uson & Matthews (2003) recently obtained new aperture synthesis imaging observations of UGC 7321 in the H i 21-cm line using the Very Large Array (VLA)111The Very Large Array of the National Radio Astronomy Observatory is a facility of the National Science Foundation, operated under cooperative agreement by Associated Universities, Inc.. Details regarding these observations, as well as the global and kinematic properties of the neutral hydrogen in UGC 7321 are described by those authors. With a total of 12.3 hours of on-source integration time, the VLA data for UGC 7321 are among the most sensitive H i observations of edge-on spiral galaxies obtained to date. Since the observations also have reasonably good spatial and spectral resolution ( and 5.2 km s-1, respectively), they are well-suited for structural and kinematic studies of the H i gas in this nearby system. Here we use these data to explore the vertical distribution of the neutral hydrogen gas in UGC 7321. With the aid of three-dimensional models, we report evidence that the structure and kinematics of the H i component in UGC 7321 are more complex than a simple, thin-disk distribution. UGC 7321 has a cool H i disk that appears to be both warped and flared, but our analysis also suggests the presence of additional vertically-extended emission (Section 3.3). In Section 4 we briefly discuss possible origins for this high-latitude material.
2. HI Halos of Galaxies
H i surveys of the Milky Way have revealed that the distribution of its neutral hydrogen component is far more complex than simply a cool, thin disk of material lying along the Galactic midplane. The Galactic neutral medium instead contains both cool and warm layers of differing scale heights (Lockman 1984), as well as a halo component extending to substantial -heights (4.4 kpc; Kalberla et al. 1998).
From sensitive aperture synthesis observations, high-latitude H i gas has now also been detected in other nearby galaxies. For example, using deep H i observations of the nearby, edge-on Sbc spiral NGC 891, Swaters, Sancisi, & van der Hulst (1997) reported evidence for H i gas extending to heights of at least 5 kpc above the plane. Based on three-dimensional modelling, these authors argued that this emission is part of an H i halo that lags in rotation speed by 25-100 km s-1 relative to material in the disk.222Benjamin 2002 points out that the high end of this range appears to be inconsistent with H measurements of this galaxy. Similar analyses for the moderate inclination spiral NGC 2403 led to the suggestion that this galaxy also has a rotationally lagging H i halo and anomalous H i material that may be related to Galactic high-velocity clouds (Schaap, Sancisi, & Swaters 2000; Fraternali et al. 2001,2002). In addition, high-latitude H i features now have been seen in NGC 5775 and NGC 2613 (Irwin 1994; Irwin & Chaves 2003). Interestingly, NGC 5775 shows evidence for an H i halo, while NGC 2613 seems to show only multiple discrete high-latitude features (Irwin & Chaves 2003).
For NGC 891 and NGC 2403, Swaters et al. (1997) and Schaap et al. (2000), respectively, postulated that the H i halo gas in these galaxies is likely to have originated from a galactic fountain-type mechanism of the type described by Shapiro & Field (1976) and Bregman (1980). This explanation seems plausible for these systems, since both are bright galaxies with moderately high star formation rates and significant H and radio continuum emission. Still, the sample of nearby galaxies for which gaseous halos, particularly H i halos, have been detected remains quite small, and a number of puzzles regarding their structure and origin remain.
One difficulty with the galactic fountain scenario for the origin of high-latitude gas is that the energetics required to raise material from the disk to -heights of several kpc often appears to be much larger than can seemingly be supplied by ordinary supernova events alone (e.g., Rand & van der Hulst 1993; Lee & Irwin 1997). Moreover, evidence is accumulating that the observed vertical velocity gradients in halos are not entirely consistent with fountain predictions (Collins, Benjamin, & Rand 2002).
In some cases, it has been suggested that extraplanar gas, including H i, may have been acquired during interactions (e.g., Sancisi 1988) or buoyed up by tidally-triggered instabilities. Nonetheless, interactions seem an unlikely source for the halo gas in either NGC 891 or NGC 2403, since both of these galaxies appear to be isolated. One possible alternative for the origin of at least some fraction of the high- H i material in galaxies like these is that this gas is a remnant from an earlier evolutionary phase or is accreted via a slow “drizzle” (e.g., Oort 1970). The interest in these types of scenarios is further fueled by the recent results from QSO absorption line experiments toward moderate redshift galaxies (redshifts 1) that have shown these systems frequently are surrounded by very extended gaseous halos with covering factors of near unity (e.g., Lanzetta et al. 1995; Chen et al. 2001b). The large spatial extents of these halos (180 kpc), their presence around galaxies spanning all morphological types, and the inferred correlations between halo size and galaxy mass (Chen et al. 2001b), all hint that their origin may be tied to processes intrinsic to the galaxy formation process rather than the details of current star formation (see also Section 4 below). It follows that at least some remnant of such halos still may be present around many disk galaxies in the local universe, particularly if the halos are continually replenished.
One important way to test whether at least some fraction of the high-latitude H i emission observed in spiral disks could be linked to the galaxy formation process rather than a by-product of vigorous star formation, tidal interactions, or mergers is to search for evidence of high -height H i emission in isolated disk galaxies with very low levels of current star formation. H i-rich, low surface brightness (LSB) “superthin” spirals are just such objects (e.g., Uson & Matthews 2003). Since high -height gas can be most unambiguously detected in highly-inclined galaxies, we have chosen the edge-on LSB spiral UGC 7321 for such an investigation.
3. Results
3.1. The HI Total Intensity Map
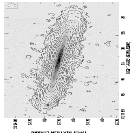
A total H i intensity map of UGC 7321 is shown in Figure 1, overlayed on an optical -band image from Matthews et al. (1999). It is apparent from this figure that even after accounting for the finite resolution of the VLA beam, the H i emission in UGC 7321 is not exclusively confined to a very thin layer. If the H i disk had an intrinsic FWHM thickness less than or comparable to that of the stars (i.e., ; Matthews 2000), the apparent thickness as observed with a 16′′ FWHM Gaussian beam should be 17′′. Instead we find based on intensity slices parallel to the minor axis that the H i layer has a mean apparent thickness of FWHM. In addition, a number of filamentary features protrude to even higher . That these features are not simply noise is implied by the fact that the disturbances are evident in several successive underlying contours (see also Figure 7 of Uson & Matthews 2003).
One-dimensional H i intensity slices extracted perpendicular to the disk of UGC 7321 at various projected radii consistently show cores that are Gaussian in shape, but with additional extended wings (Figure 2). These wings stretch to -distances of up to (2.4 kpc). Qualitatively the profiles shown in Figure 2 resemble plots of the distribution of H i volume density as a function of in the Milky Way disk (see Lockman 1984, his Figure 5). In the case of the Milky Way, Lockman showed that the observed density profile could be modelled as the sum of two Gaussian components, together with a more diffuse and extended exponential component. After correcting for underestimated low- emission and a distance to the Galactic Center of =8.5 kpc, Dickey & Lockman (1990) give FWHM for the Gaussian components of 212 pc and 530 pc, and a scale height for the exponential component of 403 pc. The nature of the vertical intensity cuts in UGC 7321 therefore hints at the possibility of an analogous multi-component H i disk structure in this “superthin” LSB galaxy.
While suggestive of an extended gas component, the vertical intensity cuts and total intensity map that we have derived for UGC 7321 give us only a projected density distribution and do not permit us to assess at what galactocentric radius the vertically extended material is located. For example, it is feasible that warped or flared gas from the outer disk regions seen along the line of sight is affecting the shape of the wings of the observed intensity profiles, and thus could mimic the signatures of a multi-component disk. More firmly establishing the presence of a multiple-component H i disk in UGC 7321 therefore requires exploiting the full three-dimensional nature of the H i data cube, and utilizing velocity as well as spatial information. We undertake this exercise in the following subsections.
3.2. Minor-Axis Position-Velocity Profiles
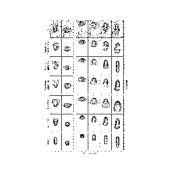
One powerful way of probing the structure of vertically extended gas in disk galaxies is to examine position-velocity (P-V) profiles perpendicular to the disk. In Figure 3 (right column) we plot such diagrams for UGC 7321 at several disk locations. In these panels, H i emission can be seen extending up to (2.4 kpc) from the plane. At these and other disk locations, most, although not all, of this vertically extended material has velocities within 50 km s-1 of the systemic velocity.
In a galaxy disk viewed edge-on, gas that is extended in and that is primarily clustered near the systemic velocity can be a signature of flaring of the H i layer (Sancisi & Allen 1979). However, certain characteristics of the high-latitude material in our present data argue against this explanation for UGC 7321. One is the existence of asymmetries in these features on the versus sides of the disk (see Figure 2 & 3), as well on the east and west sides (compare the panels at and in Figure 2). For such a highly inclined galaxy, a flare should be expected to be largely symmetric about the midplane. East-west asymmetries do not strictly exclude a flare, but would imply that the midplane density is different on the two sides of the disk. A second argument against a pure flare model is that the degree of disk flaring required to explain the high- emission would produce unique signatures in both the H i total intensity map and in the individual channel maps. As we show below, these features are not seen. Thus as we demonstrate in the next sections, while UGC 7321 does exhibit manifestations of both warping and flaring in its H i disk, neither of these effects alone appears to be sufficient to consistently explain the morphology and kinematics of its highest-latitude H i emission.
3.3. Three-Dimensional Galaxy Modelling
In order to further probe the nature of the high--height H i emission in UGC 7321, we have computed full three-dimensional (3-D) models of the galaxy and compared these with the observed H i channel maps, vertical P-V profiles, and total H i intensity map. For this analysis we have modelled the galaxy velocity field using the rotation curve for UGC 7321 derived by Uson & Matthews (2003), with the approaching and receding sides of the disk averaged. Assuming a constant Gaussian velocity dispersion for the gas of 7 km s-1, we then computed the H i intensity and velocity distribution using a modified version of the radiative transfer and rotation curve modelling code written by one of us (KW; see Matthews & Wood 2001). These model cubes could be subsequently analyzed in a manner identical to the real H i data set.
For our present analysis we have assumed that the H i is optically thin and that its density profile is Gaussian in both the and directions. The assumption that the gas is largely optically thin appears to be justified, since Uson & Matthews (2003) found evidence of only very mild self-absorption toward the center of UGC 7321 (where gas densities should be highest, and velocity crowding most extreme). Moreover, any optically thick clumps are likely to be confined primarily to the midplane, whereas in the present paper we are mainly concerned with probing the spatial and velocity structure of the higher latitude gas.
The choice of a Gaussian for the vertical intensity distribution is motivated by its success in describing the bulk of the global, vertical H i distribution of other galaxies [e.g., the Milky Way; Lockman (1984)] and its success in fitting our present data. However, a sech distribution (as expected for an isothermal disk) has a very similar shape to a Gaussian and would also be consistent with the data. This choice does not affect our conclusions.
For UGC 7321 we also find a Gaussian to provide a good representation of the radial H i intensity distribution, as is commonly found in late-type spirals (e.g., Krumm & Salpeter 1980). Other forms for the radial distribution (such as an exponential) provided significantly less satisfactory fits. In all of our models, the H i intensity in the direction has a scale length of 5.6 kpc (13.2 kpc FWHM) and is truncated at a radius of =11.8 kpc. All of our model data cubes also have been convolved with a Gaussian in the spatial domain in order to match the resolution of the VLA data. We adopt an inclination for UGC 7321 of and a position angle of 82∘. All of our model parameters are quoted as their values prior to convolution with the telescope beam. For each of the classes of models we describe below, we have explored a wide range of relevant parameter space, but limit our current discussion to only the best-fitting model of each category.
3.3.1 Single-Component Disk Models
The first class of model that we considered for UGC 7321 was that of a smooth, azimuthally symmetric Gaussian intensity distribution in both the and directions (hereafter, the “smooth model”). We already know this model to be somewhat of an oversimplification, since UGC 7321’s gas disk is clearly is mildly warped (Figure 1; see also Uson & Matthews 2003). However, it serves as an important baseline for comparison with more complex models.
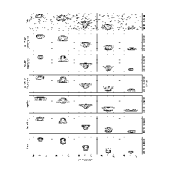
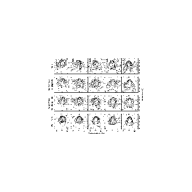
For the smooth model, we found the best overall fit to the data using a FWHM H i thickness of 370 pc, and a central density of 0.19 cm-3. In Figure 4 we plot several of the channel maps produced from this model alongside the real data333The full set of channel maps for UGC 7321 is presented in Uson & Matthews 2003.. In Figure 3 we plot several representative minor axis P-V plots for this model.
We see from Figure 4 that the distribution of the emission in most of the smooth model channel maps is not a good match to the data; in some of the channels, the model emission narrows in -extent with increasing (e.g., the and km s-1 panels), while in the actual data, the -distribution of emission broadens with increasing . In addition, the smooth model cannot simultaneously match the intensity in the midplane while still reproducing the full observed -extent of the emission (see also Figure 3). Finally, the mean FWHM thickness of the gas at inferred from this model is larger than that of the stars in the near-infrared [(FHWM)260 pc at ; Matthews (2000)], and exceeds typical H i scale heights of normal spiral galaxies. For example, the mean FWHM of the Milky Way’s cool H i disk at intermediate galactocentric radii (4-8 kpc) is only 230 pc (Dickey & Lockman 1990). Since in general, all but the youngest stars are dynamically hotter than the cool H i disks of normal galaxies, this smooth model is unappealing on physical grounds, particularly for such a dynamically cold system as UGC 7321. Some of these problems can be partially alleviated by modelling the emission in terms of two disk components of differing scale heights. However, such a model still cannot reproduce the broadening of the gas in the direction with increasing projected radius that is seen in a number of the individual channel maps.
Using our smooth model, we have explored the additional possibility that this model produces a poor match to the data simply because we have overestimated the inclination of UGC 7321. However, computing a similar model to that described above, except with , yields characteristic “V-shaped” channel maps, unlike those seen in our data (see also Figure 4 of Swaters et al. 1997). Moreover, this model predicts too little density concentration along the midplane. We conclude that our adopted inclination for UGC 7321 is not significantly in error.
It is clear from the H i total intensity map in Figure 1 that the H i disk of UGC 7321 has a mild integral sign warp (see also Uson & Matthews 2003). Therefore a more accurate model of UGC 7321 naturally should take this into account. In addition, inspection of the individual channel maps of UGC 7321 suggests that the H i layer appears to be flared (i.e., the -extent of the gas increases with increasing projected radius). In our next set of computations, we therefore introduced disk warping and flaring as follows:
| (1) |
The flaring scaleheight is . The warp is introduced by setting , with the azimuthal angle in the disk midplane, and for .
This analytic form for the flare was adopted based on its ability to provide a good fit to the data. Models where the scale height remained nearly constant within the inner few kpc (as is inferred, for example, in the Milky Way; Burton 1988) produced noticeably poorer fits.
The radius where the warp commences was taken to be 5.8 kpc (the edge of the stellar disk), and its maximum amplitude to be 480 pc (i.e., kpc and kpc). We assume that the line of nodes of the warp is straight throughout the disk. For the flaring, we found our best overall fit to the data taking the FWHM of the disk to be 260 pc at its center and taking the maximum thickness at to be 1.64 kpc FWHM. The corresponding scaleheight parameters are kpc and kpc.
Although it is difficult to accurately constrain gas scale heights at small galactocentric radius for edge-on disks (e.g., Olling 1997a,b), we found that models with much smaller gas scale heights at =0 provided less acceptable fits to the data. This would imply that the scale height of the cool H i disk in UGC 7321 is not significantly smaller than that of the stars. In fact, we note that with our adopted parameters, in order to properly fit the outer H i disk scale height, we find that the resulting FWHM of the gas layer in our best model actually exceeds by % that of the stars as measured in the NIR near the outskirts of the stellar disk (Matthews 2000). The requirement that therefore provides some estimate of the uncertainty in our flare model parameters. Interestingly, a near-equality of the gaseous and stellar scale heights in the outer disk of UGC 7321 was also suggested by Gallagher & Matthews (2002) based on the vertical distribution of luminous outer disk stars and dark nebulae seen in Hubble Space Telescope images.
Our resulting warp+flare models are illustrated in Figure 3 and Figure 4. Figures 3 & 4 show that our warp+flare model results is a substantial improvement in fitting the channel maps and the minor axis P-V plots. Overall this model reproduces quite well the bulk of the brightest midplane emission in UGC 7321. However, we find that the warp+flare model still is unable to reproduce the more diffuse, highest -height emission. This shortcoming is most evident for channels corresponding to velocities within 60 km s-1 of systemic. Furthermore, one-dimensional intensity cuts extracted in a manner analogous to those in Figure 2 do not exhibit the same type of extended wings seen in the data; rather for the warp+flare model, the intensity distribution can be almost completely reproduced by a single (albeit broader) Gaussian (Figure 5).
Constraining the peak amplitude of the flare to match the maximum observed -extents of the gas (i.e., FWHM of the flare equal to 3.3 kpc at ) significantly lessens the agreement with the data, as the highest -height flared material does not follow either the spatial distribution or the velocity structure of the observed high latitude gas (viz. the “large flare model” in Figures 3 & 4; note particularly the and km s-1 channel maps). Moreover, models with a higher amplitude flare fail to match the observed total H i intensity distribution since the disk begins to appear thickest at its edges, contrary to what is observed (Figure 6).
3.3.2 Two-Component Disk Models
In our own Galaxy, current evidence suggests that within the solar radius, H i material with 1 kpc (or possibly as high as 3 kpc) corotates with the gas in the plane (Dickey & Lockman 1990; Benjamin 2000; Lockman 2002). However, alternate tracers of the gaseous halo at higher -heights (e.g., C iv) have shown some evidence for lagging rotation within the inner Galaxy (Savage & Massa 1987). In external galaxies, evidence of lagging halos of ionized gas has also been reported (Rand 1997,2000; Tüllmann et al. 2000). In addition, as noted above, evidence for rotationally lagging H i halos has now been found for a few other carefully studied spirals. We therefore explore the possibility that such a model might also describe the high-latitude H i emission structure in UGC 7321.
For these “lagging halo” models we have included the following two components: (1) a thin disk of material that rotates according to the disk rotation curve and whose parameters (except for the central density) are fixed to those derived for our best-fitting warp+flare model above; (2) a thicker, Gaussian-shaped layer whose rotational velocity is permitted to decrease linearly as a function of -height. We use a velocity dispersion for the “halo” component of (e.g., Kulkarni & Fich 1985; Combes & Becquaert 1997). Here is the velocity dispersion in the thin disk (7 km s-1 in all models) and and are the scale height of the halo and the mean scale height of the flared thin disk, respectively.
In Figures 3 and 4 we show the results for a model where the halo component has the following parameters: a FWHM of 3.3 kpc, a central volume density 16 times lower than that of the disk material, a velocity dispersion of 35 km s-1, and a velocity that declines linearly to 50% of the in-disk value at 2 kpc, and remains constant thereafter. This corresponds to a falloff of 25 km s-1 kpc-1. While the particular combination of model parameters we have used is not necessarily unique, we see from these figures that such a model reasonably reproduces the spatial and velocity distribution of H i as observed in UGC 7321. The total intensity distribution derived from this model also matches well with the data (Figures 5 & 6).
Given the success of the lagging halo model at reproducing the H i structure of UGC 7321, we also explored whether the emission could be reproduced with a smooth disk and a lagging halo alone, without any flaring (the “smooth+lagging halo” model). The channel maps and vertical P-V slices predicted by such a model provide fair agreement with the data (Figures 3 & 4), although noticeable discrepancies begin to occur in the km s-1 channel map in Figure 4 and the W P-V slice in Figure 3. Moreover, such a model clearly is seen to break down in Figures 5 & 6. One-dimensional vertical intensity slices from this model show more pronounced non-Gaussian wings than does the warp+flare+lagging halo model. And the total intensity image created from this model is seen to significantly underestimate the thickness of the disk at large projected radii. We conclude that UGC 7321 cannot be modelled without including a flaring of the gas layer.
Lastly, we have also tested a model that includes warping and flaring, but where the halo corotates with the disk (the “warp+flare+corotating halo” model). As seen in Figures 3 & 4, in several channels this model seems to predict too much high-latitude emission at small projected radii (compare the 56.8, 46.5, and km s-1 channel maps in Figure 4). However, only the outermost () contours are affected, and it is only at these levels that the differences between the lagging and corotating models become readily apparent. To complicate matters further, in some instances, vertically extended gas is seen at locations more consistent with the corotating model than the lagging halo model (for example, the vertical P-V cut at W in Figure 3). This could reflect noncircular motions of the emitting gas, or may indicate that the rotational lag of the halo has a dependence on different from that in our models. At present, we are unable to distinguish between these possibilities.
3.3.3 Tests of the Models in the Presence of Noise
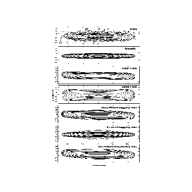
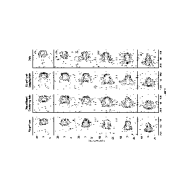
To better gauge how well we can distinguish between a lagging versus a corotating halo model given the noise in our observations, we have added to our models Gaussian noise identical to that in the real data and then re-examined the resulting channel maps and vertical P-V slices. We repeated this exercise several times in order to gauge how much faint features will appear to “vary” in the presence of random noise. We have also performed a similar experiment on the pure warp+flare model. Examples of channel maps and vertical P-V slices from these “noisy” models are shown in Figures 7 & 8.
From Figures 7 & 8 we can clearly see that noise alone is insufficient to emulate the types of high-latitude features we see in UGC 7321, as the warp+flare model shows essentially no evidence for such features. We also find that some differences between the lagging and corotating models do persist even in the presence of noise. For example, in the channel maps over the velocity range 20-50 km s-1, the lagging model consistently shows high-latitude material “trailing” to large projected radius, behind the bulk of the low-latitude emission. Such features are consistently seen in the data, but are not reproduced by the corotating halo model. Overall, at intermediate radii, the lagging halo model predicts more high- emission near the systemic velocity than does the corotating halo model, and this also seems borne out by the data at most disk locations where high- H i is observed (e.g., the 51′′, 78′′, and 105′′E P-V slices in Figure 8).
Based on the above arguments, we suggest a tentative preference for the lagging halo model for UGC 7321 over one where the halo corotates with the disk, with the caveat that a lagging halo model would seem to require the addition of some non-circular motions and/or a possible additional change in as a function of . However, given the limitations of present data and models, a situation where the bulk of the high-latitude gas corotates with the disk cannot yet be strongly ruled out.
A further outcome of the exercise of introducing noise into our models is to illustrate that a smooth H i halo can appear to break up into semi-discrete features in the presence of noise. Thus while the high-latitude gas in UGC 7321 may in fact have an intrinsically clumped or filamentary nature, this becomes difficult to distinguish from a relatively smooth emission distribution in our present data.
4. Discussion: the Origin of the Vertically Extended HI Emission
We have shown in the previous sections that the LSB spiral UGC 7321 contains vertically extended H i gas whose -height extends beyond that predicted for a simple, cool H i layer, even after accounting for the effects of warping and flaring. Moreover, based on our best-fitting 3-D models, we have suggested that at least a fraction of this high-latitude material may lag in rotation relative to the material in the midplane. The caveats are that such a model would seem to require the addition of some non-circular motions and/or a possible additional change in as a function of ; also, given the limitations of our data and models, a situation where the bulk of the high-latitude gas corotates with the disk cannot yet be definitively ruled out. The emergence of a corotating halo model would have interesting implications for the origin of the high-latitude gas in UGC 7321, since both ballistic models (i.e., those associated with galactic fountain flows) and hydrostatic models for galactic halos predict rotational lags. In the case of the hydrostatic models, cylindrical rotation can be achieved only if there exist additional pressure gradients or magnetic tension in the halo (Benjamin 2002).
4.1. Inferred Properties of the HI Halo
Independent of the exact kinematic structure of the high-latitude gas in UGC 7321, we can use our models to compute an estimate of the total mass contained in the high-latitude H i component in UGC 7321. For either our lagging or corotating halo model, the total mass of H i in the halo component is (roughly 12% of the total H i content of UGC 7321). Of this material, is present at (roughly 1% of the H i content of UGC 7321). This latter value is approximately fifteen times less than the fractional H i content inferred to be at comparable -heights in NGC 891 by Swaters et al. (1997). We now briefly consider possibilities for the origin of this (comparatively weak) halo component in UGC 7321.
4.2. Supernova Heating/Galactic Fountain
For those nearby galaxies whose gaseous halos have been studied to date, there appear to be well-established links between the properties of the multi-phase halos and the current star formation rates of the galaxies, implying the two are linked (e.g., Dahlem 1997 and references therein). This suggests that at least some portion of the halos may be formed via internal processes.
The type of thickened, rotationally lagging H i layer that we infer for UGC 7321 in Section 3.3 is qualitatively similar to the expectation for material originating via a galactic fountain, as described by Bregman (1980). In this scenario, gas heated by supernovae is predicted to move both toward larger and larger before cooling, recondensing, and returning near the point of origin via ballistic orbits. While in the halo, the gas should lag the disk rotation as a consequence of conservation of angular momentum. Using qualitative arguments, Swaters et al. (1997) and Schaap et al. (2000) have suggested scenarios of this type may account for the origin of the H i halos of NGC 891 and NGC 2403, respectively. However, it is unclear whether a detectable H i halo could be formed in this manner in a galaxy like UGC 7321, that exhibits such modest levels of current star formation.
Based on the IRAS far-infrared 60 and 100m fluxes for UGC 7321 (0.344 Jy14% and 0.964 Jy19%, respectively)444Values taken from the NED database. and the formulae given by Condon (1992), we estimate the current star formation rate in UGC 7321 for stars with is only 0.006 per year. This is 200 times smaller than the value similarly derived for NGC 891. On the other hand, UGC 7321 is a smaller, lower mass spiral than others where high-latitude H i has been reported, and likely also has a more tenuous interstellar medium. These factors may increase the efficiency with which supernovae can deposit gas at high latitudes.
An independent estimate of the star formation rate in UGC 7321 can be derived from the H data of Matthews et al. (1999). Although the H+[N ii] image presented by these authors is not flux calibrated, using the known -band luminosity of the galaxy, the mean H/[N ii] line ratio from Goad & Roberts (1981), and the relative throughputs of the broad-band continuum () and narrow-band (H+[N ii]) filters used by Matthews et al., we estimate an H luminosity for UGC 7321 from their data of erg s-1. Such a value is typical of quiescent, late-type spirals (e.g., Thilker et al. 2002). Using the formula given by Condon (1992), this corresponds to a massive star formation rate of 0.02 per year–a few times higher than estimated above from the FIR emission, but roughly consistent to within the uncertainties of both estimates.
In order to test whether it is feasible that supernovae could supply the energy required to maintain an observable H i halo in UGC 7321, we follow an approach similar to Kulkarni & Fich (1985). We neglect possible partial support for the gas that may come from magnetic fields, cosmic rays, and radiation, since based on the extremely weak radio continuum flux from this galaxy (Uson & Matthews 2003), these terms are likely to be quite small. In this case, assuming hydrostatic equilibrium, the kinetic energy of the halo is simply given by , where is the mass of the gaseous halo material (H i plus He) and is the velocity dispersion of the halo (35 km s-1 for our model). Using the halo mass quoted in Section 4.1, applying a factor of 1.34 to correct for He, and assuming a radius for the galaxy of 11.8 kpc, we derive the kinetic energy per unit area of erg cm-2 for the gaseous halo.
We assume that the timescale for intercloud collisions in the halo is likely to be longer than their free-fall time back to the disk, and therefore use the latter timescale to estimate the rate at which energy must be continuously supplied to maintain the halo. Assuming a downward velocity of 35 km s-1 from a height of 1.6 kpc, the approximate free-fall time is 46 million years. This then requires an energy input rate of erg s-1 cm-2.
From Cappellaro et al (1993), we find that mean supernova rates for typical Scd/Sd galaxies are 2.430.70 per 100 years, per , of which 24% are typically type Ia and 76% are core collapse supernovae. Since the -band luminosity of UGC 7321 is 1.1 (Uson & Matthews 2003), this yields an estimated total supernova rate of year-1. This number is roughly a factor of two higher than we might estimate from the massive star formation rate derived from the FIR fluxes above, but given the large uncertainty in the FIR measurements, we adopt this as a more “optimistic” estimate.
Fiducial kinetic energies for type Ia and core collapse supernovae are ergs and ergs, respectively (Abbott 1982). Of this energy, approximately 1% and 3%, respectively can be converted into bulk motions of gas clouds (Spitzer 1978). This predicts a kinetic energy per unit area supplied by supernovae of erg s-1 cm-2—a value comparable to estimated above, and therefore consistent with the possibility that supernova energies may be sufficient to maintain the high-latitude H i observed in UGC 7321.
We can provide an independent check on our energy injection estimate using the figures and relations supplied by Collins et al. (2002). Using their Figure 4, we find that a maximum observed gas height of 2.4 kpc implies a ratio of “kick” velocity to circular velocity in the midplane of 0.8. Choosing some intermediate galactocentric radius (say 4 kpc), and taking 100 km s-1 for UGC 7321, this implies =80 km s-1. From Figure 6 of Collins et al., the implied “cycling frequency” is yr-1. Inserting this into their Equation 5 leads to an estimate of the halo mass flux of yr-1. Finally, from the relation for the energy input requirement: (where the halo mass flux is in units of yr-1 and the kick velocity is in units of 100 km s-1) we arrive at erg s-1, or erg s-1 cm-2—very close to our estimate above.
Using the “kick” velocity estimated from the Collins et al. models, we can make another interesting comparison, namely how that value compares with the escape speed from the galaxy, . Assuming a spherical potential, the escape speed from a galaxy is given by equation 2-292 of Binney & Tremaine (1987). At our fiducial radius of 4 kpc, we thus derive an escape speed 141 km s-1—significantly higher than the kick velocity of 80 km s-1, implying UGC 7321 would be able to retain most of its fountain gas.
Of course the above estimates are highly idealized, and more sophisticated computations are clearly needed to test more accurately how efficiently supernovae (and stellar winds) can be in supplying gas to the halo, and whether the observed spatial and velocity structures of the high-latitude material quantitatively matches the predictions of galactic fountain-type models. Very deep H observations to search for an extraplanar component of ionized gas in UGC 7321 would also be of interest in further testing the link between star formation and high-latitude H i in this galaxy. In the mean time, we also consider the feasibility of other possibilities for the origin of the halo material in UGC 7321.
4.3. Alternative Possibilities
In spite of the well-established links between current star formation and the existence of gaseous halos in brighter galaxies, it is possible that star formation simply acts to augment the halo and lead to the partial ionization of pre-existing halo gas, thereby making these halos more extensive and more readily observable via a variety of tracers. This may be expected to occur if some gas were deposited in the halo either during an earlier phase in the galaxy’s evolution, or via ongoing accretion. We now consider these two possibilities in turn for the source of the high-latitude H i in UGC 7321.
4.3.1 Galactic Superwinds
Steidel et al. (2002) recently reported that for a sample of five intermediate redshift Mg ii absorption line galaxies, the models needed to explain the kinematic properties of the absorbers require either thick rotating gas layers and/or rotational velocities that decline with height above the plane. One galaxy in their sample, G1 1222+228, is particularly interesting in light of our findings for UGC 7321, as it appears to show some intriguing analogies.
Like UGC 7321, G1 1222+228 (redshift 0.55) has the morphology of a pure disk system of relatively low surface brightness, in spite of its edge-on geometry. Its absolute blue magnitude () and its peak rotational velocity (100 km s-1) both are also very similar to UGC 7321. From Steidel et al.’s Figure 4, we estimate the linear diameter of G1 1222+228 to be 12.1 kpc—again comparable to UGC 7321, particularly if the faint outskirts of the disk are invisible owing to their LSB nature. For this system, Steidel et al. successfully reproduced the Mg ii absorption profile for this galaxy using a model with an “effective height” for the gas layer (as measured from the midplane) of 5 kpc and a velocity structure for the high--height material that falls to zero velocity within a few kpc above the disk plane. This model is interestingly similar to our lagging halo model for UGC 7321.
Steidel et al. (2002) note the general problem of explaining Mg ii halos of moderate redshift galaxies from galactic fountains, since most Mg ii absorption systems are not currently highly active star-formers. Motivated by results from the strong far-UV absorption lines observed in Lyman break galaxies, they suggest as an alternative, large-scale galactic winds from a much earlier epoch of star formation (at redshifts 3). In this scenario, the shock-heated and metal-enriched superwind material would cool slowly to form the gaseous disk and halo observed in normal disk galaxies at low or moderate redshifts. Could this be the origin of the high-latitude H i in UGC 7321?
Although the galactic superwind scenario suggested by Steidel et al. (2002) has not yet been quantified in detail, based on dynamical arguments it is not clear whether material deposited in the halo at high redshift would still be observable in local galaxies. The metal-line absorption features in the halos of galaxies probed by QSO absorption lines, including Mg ii, appear to arise in discrete clouds (e.g., Petitjean & Bergeron 1990), and Chen, Lanzetta, & Webb (2001a) have argued that the timescale for collisions and subsequent orbital decay of these clouds should be considerably less than a Hubble time. Therefore it is uncertain whether any remnant of gaseous halos formed by superwinds at high redshifts could persist to the present epoch.
4.3.2 Infalling Gas
If the high-latitude H i material in UGC 7321 is not directly tied to current star formation, and is not a remnant from an early galactic superwind, an alternative is that at least some fraction of this gas has been acquired through the accretion of intergalactic clouds or small companions (e.g., Oort 1970; van der Hulst & Sancisi 1988). This could have occurred in the form of a one-time accretion of a dwarf satellite or the “drizzle” of small parcels of H i onto the galaxy.
UGC 7321 appears to be a very isolated galaxy, and Uson & Matthews (2003) put a 10 upper limit on the H i masses of any gas-rich companions or clumps within 12 arcminutes (36 kpc) of UGC 7321 of . In addition, the mass of any possible infalling clumps would be limited by the constraint that they cannot excessively heat and disrupt the disk (e.g., Tóth & Ostriker 1992).
We can obtain a rough estimate of the maximum mass of a satellite, , that could have been recently accreted by UGC 7321 without destroying its thin stellar disk using the relation given by Lacey (1991):
Here, is the stellar velocity dispersion, is the disk mass, and is the peak disk rotational velocity. Taking to be equal to the total estimated mass of gas and stars in the disk, =105 km s-1 (Uson & Matthews 2003), and =20 km s-1 (Matthews 2000), we find . This is comparable to our inferred halo mass for UGC 7321; however, any gas-rich dwarf galaxy is likely to have a dark matter content equal to at least a few times its visible mass (e.g., Côté, Carignan, & Freeman 2000). Thus it appears possible, although unlikely that the high-latitude material in UGC 7321 originated from a single accretion event.
Still another possibility is that UGC 7321 has been accreting small parcels of gas throughout much of its lifetime. Indeed, a variety of lines of evidence suggest that slow, continual gas accretion (of order a few per year) may be a common occurrence for disk galaxies (e.g., Wakker et al. 1999; Binney 2000; see also Oort 1970). In the case of UGC 7321, the misaligned angular momentum thus acquired (e.g., Binney & Jiang 1999; Debattista & Sellwood 1999) could also offer an explanation for the origin of the warp in this isolated system (see also the discussion in Uson & Matthews 2003). In order to maintain the observed thick H i layer, we estimate that a mass infall rate of 3.8 per year would be required based on the relation , where we have taken erg s-1 and assumed 35 km s-1. This is comparable to gas infall rates estimated for the Milky Way (Binney 2000). However, in order for infalling material to share the rotation of the disk, this requires that the clumps must become “dragged” along with some sort of pre-existing, rotating medium, and the existence of such a medium is unclear. This objection could partially be alleviated if infalling clumps acted to trigger further instabilities in the disk and thus raised additional rotating gas to high .
5. Summary
Using sensitive VLA H i observations in combination with 3-D modelling, we have found evidence for high-latitude (2.4 kpc) H i emission in the edge-on, LSB spiral galaxy UGC 7321. We are unable to reproduce the spatial and kinematic structures of this vertically extended material solely by projection effects from warping and flaring of the gas layer. However, we are successfully able to model the H i distribution in UGC 7321 with a combination of a thin, cool H i disk with mild warping and flaring, together with a thicker “halo” component.
We find tentative evidence that the vertically extended gas exhibits a lag in rotation velocity by of 25 km s-1 kpc-1 relative to the cooler H i material in the midplane. However, given the possible presence of additional non-circular motions and the sensitivity limits of our data, it is impossible to completely rule out models where the extended gas largely corotates with the disk.
We estimate a FWHM for the cool disk component to be 260 pc at the disk center, flaring to a FWHM of 1.6 kpc at the last observed point; we estimate the FWHM thickness of the halo to be 3.3 kpc. Based on our best models, the H i “halo” comprises roughly 12% of the total H i content of UGC 7321. Although the best-fitting model we have derived for UGC 7321 is not necessarily unique, after exploring a large range of parameter space, we find our model to reproduce the data significantly better than other physically motivated models, including those with a higher-amplitude flare, or those with a vertically extended halo but no flaring.
Our detection of vertically extended H i emission (beyond that attributable to a warp or flare) in UGC 7321 represents the first time that evidence of such an ISM component has been reported in a nearby galaxy with such a low current star formation rate. Our rough calculations imply that energy input from supernovae may be sufficient to maintain the observed high-latitude H i in UGC 7321. However, slow, sustained gaseous infall (in the form of clumps with H i masses ) remains another viable explanation, and could also explain the existence of the warp in this isolated galaxy. Our findings suggest that H i halos may be common features of spiral disk galaxies in the local universe, and that their existence is not necessarily dependent on vigorous levels of current star formation.
References
- (1) Abbott, D. C. 1982, ApJ, 263, 723
- (2) Benjamin, R. A. 2000, RevMexAA, 9, 256
- (3) Benjamin, R. A. 2002, in Seeing Through the Dust: the Detection of H i and the Exploration of the ISM of in Galaxies, ed. A. R. Taylor, T. L. Landecker, and A. G. Willis, ASP Conference Series, Vol. 276, (San Francisco: ASP), 201
- (4) Binney, J. J. 2000, in Dynamics of Galaxies: from the Early Universe to the Present, ASP Conference Series, Vol. 197 ed. F. Combes, G. A. Mamon, and V. Charmandaris, (San Francisco: ASP), 107
- (5) Binney, J. & Tremaine, S. 1987, in Galactic Dynamics, (Princeton: Princeton University Press)
- (6) Bregman, J. N. 1980, ApJ, 236, 577
- (7) Burton, W. B. 1988, in Galactic and Extragalactic Radio Astronomy, 2nd edition, ed. G. L. Verschuur and K. I. Kellermann (Springer-Verlag: New York), 295
- (8) Cappellaro, E., Turatto, M., Benetti, S., Tsvetkov, D. Y., Bartunov, O. S., & Makarova, I. N. 1993, A&A, 273, 383
- (9) Chen, H.-W., Lanzetta, K. M., & Webb, J. K. 2001a, ApJ, 556, 158
- (10) Chen, H.-W., Lanzetta, K. M., Webb, J. K., & Barcons, X. 2001b, ApJ, 559, 564
- (11) Collins, J. A., Benjamin, R. A., & Rand, R. J. 2002, ApJ, 578, 98
- (12) Combes, F. & Becquaert, J.-F. 1997, A&A, 326, 554
- (13) Condon, J. J. 1992, ARA&A, 30, 575
- (14) Côté, S., Carignan, C., & Freeman, K. C. 2000, AJ, 120, 3027
- (15) Dahlem, M. 1997, PASP, 109, 1298
- (16) Debattista, V. P. & Sellwood, J. A. 1999, ApJ, 513, L107
- (17) Dickey, J. M. & Lockman, F. J. 1990, ARA&A, 28, 215
- (18) Fraternali, F., Oosterloo, T., Sancisi, R., & van Moorsel, G. 2001, ApJ, 562, L47
- (19) Fraternali, F., van Moorsel, G., Sancisi, R., & Oosterloo, T. 2002, AJ, 123, 3124
- (20) Gallagher, J. S. III & Matthews, L. D. 2002, in Stars, Gas, and Dust in Galaxies: Exploring the Links, ASP Conference Series, Vol. 285, ed. E. Grebel and W. Brandner, (ASP: San Francisco), 303
- (21) Goad, J. W. & Roberts, M. S. 1981, ApJ, 250, 79
- (22) Howk, J. C. & Savage, B. D. 1997, AJ, 114, 2463
- (23) Irwin, J. A. 1994, ApJ, 429, 618
- (24) Irwin, J. A. & Chaves, T. 2003, ApJ, 585, 268
- (25) Jiang, I.-G. & Binney, J. 1999, MNRAS, 303, L7
- (26) Kalberla, P. M. W., Westphalen, G., Mebold, U., Hartmann, D., & Burton, W. B. 1998, A&A, 332, L61
- (27) Krumm, N. & Salpeter, E. E. 1980, AJ, 85, 1312
- (28) Kulkarni, S. R. & Fich, M. 1985, ApJ, 289, 792
- (29) Lacey, C. 1991, in Dynamics of Disc Galaxies, ed. B. Sundelius (Göteborg: Chalmers University), 257
- (30) Lanzetta, K. M., Bowen, D. V., Tytler, D., & Webb, J. K. 1995, ApJ, 442
- (31) Lee, S.-W. & Irwin, J. A. 1997, ApJ, 490, 247
- (32) Lockman, F. J. 1984, ApJ, 283, 90
- (33) Lockman, F. J. 2002, ApJ, 580, L47
- (34) Matthews, L. D. 2000, AJ, 120, 1764
- (35) Matthews, L. D., Gallagher, J. S., & van Driel, W. 1999, AJ, 118, 2751
- (36) Matthews, L. D. & Wood, K. 2001, ApJ, 548, 150
- (37) Olling, R. P. 1996a, AJ, 112, 457
- (38) Olling, R. P. 1996b, AJ, 112, 481
- (39) Oort, J. H. A&A, 7, 381
- (40) Petitjean, P. & Bergeron, J. 1990, A&A, 231, 309
- (41) Rand, R. J. 1997, ApJ, 474, 129
- (42) Rand, R. J. 2000, ApJ, 537, L13
- (43) Rand, R. J. & van der Hulst, J. M. 1993, AJ, 105, 2098
- (44) Sancisi, R. 1988, in QSO Absorption Lines: Probing the Universe, ed. J. C. Blades, D. Turnshek, & C. A. Norman (Cambridge University Press: Cambridge), 241
- (45) Sancisi, R. & Allen, R. J. 1979, A&A, 74, 73
- (46) Savage, B. D. & Massa, D. 1987, ApJ, 314, 380
- (47) Schaap, W. E., Sancisi, R., & Swaters, R. A. 2000, A&A, 356, L49
- (48) Shapiro, P. R. & Field, G. B. 1976, 205, 762
- (49) Spitzer, L. Jr. 1978, in Physical Processes in the Interstellar Medium (New York: John Wiley & Sons)
- (50) Steidel, C. C., Kollmeier, J. A., Shapley, A. E., Churchill, C. W., Dickinson, M., & Pettini, M. 2002, ApJ, 570, 526
- (51) Swaters, R. A., Sancisi, R., & van der Hulst, J. M. 1997, ApJ, 491, 140
- (52) Thilker, D. A., Walterbos, R. A. M., Braun, R., & Hoopes, C. G. 2002, ApJ, 124, 3118
- (53) Tóth, G. & Ostriker, J. P. 1992, ApJ, 389, 5
- (54) Tüllmann, R., Dettmar, R.-J., Soida, M., Urbanik, M., & Rossa, J. 2000, A&A, 364, L36
- (55) Uson, J. M. & Matthews, L. D. 2003, AJ, 125, 2455
- (56) van der Hulst, T. & Sancisi, R. 1988, A&A, 95, 1354
- (57) Wakker, B. P., Howk, J. C., Savage, B. D., van Woerden, H., Tufte, S. L., Schwarz, U. J., Benjamin, R., Reynolds, R. J., Peletier, R. F., & Kalberla, P. M. W. 1999, Nature, 402, 388
- (58)