THE X-RAY HALO OF G21.5–0.9
Abstract
The emission of the plerion G21.5–0.9 appears more extended in X rays than in radio. This is an unexpected result because it would imply that short-lived X-ray electrons may reach distances even larger than radio electrons. Applying an empirical relationship between dust scattering optical depth and photoelectric column density, the measured column density leads to a large optical depth at 1 keV, of about 1. Therefore we investigate the hypothesis that the detected halo be an effect of dust scattering, re-analyzing an Cal/PV XMM-Newton observation of G21.5–0.9 and critically examining it in terms of a dust scattering model. We also present a spectral analysis of a prominent extended feature in the northern sector of the halo.
INTRODUCTION
In various respects supernova remnant G21.5–0.9 looks like a standard plerion. In fact it shows: i. a filled-center morphology, both in radio and in X rays; ii. a flat radio synchrotron spectrum; iii. a non-thermal X-ray spectrum, with photon index . There is no direct evidence of the pulsar powering the nebula (no pulsed emission has been detected as yet), but G21.5–0.9 harbours an almost point-like central X-ray source, that has been interpreted as the termination shock of the pulsar wind (Slane et al., 2000).
However a non-thermal X-ray halo has been recently detected, extending well beyond the boundaries of the radio emitting plerion (Warwick et al., 2001). This is the opposite of what observed in other plerions, as well as of what standard models of plerions would predict. Our main goal is to investigate the origin of this halo.
Moreover, a result of past X-ray spectral analyses of the halo region (Warwick et al., 2001; Safi-Harb et al., 2001) has been that the overall spectrum of the halo does not show any thermal signature. No thermal emission has been even detected in “the North Spur”, a feature in the northern part of the halo, that morphologically resembles a partial shell. In this paper we shall also discuss this point.
THE NATURE OF THE X-RAY HALO
Difficulties with the standard interpretation
An X-ray synchrotron nebula with a size larger than the radio emitting nebula represents a challenge to the existing models of plerion. In fact the synchrotron emitting relativistic electrons are expected to be injected in the immediate surroundings of the associated pulsar, and then to be advected and/or diffused to fill the whole nebula; in the meanwhile synchrotron losses are selectively quenching higher energy particles. Therefore X-ray emitting electrons should typically disappear before reaching the boundary of the magnetic bubble, which instead should be rather well outlined at radio wavelengths. The above scenario nicely explains (at least at a qualitative level) the behavior of most plerions, in which the apparent size of the nebula is shrinking with increasing photon energy.
In order to account for the opposite behavior, as observed in G21.5–0.9, one may for instance invoke higher diffusion for higher energy electrons. But then, in order to effectively get synchrotron emission, strong magnetic fields are required: therefore the magnetic bubble should extend to the whole X-ray halo; but in this case it is hard to explain why the radio emitting electrons do not fill the whole magnetic bubble. More detailed modelling may be devised, but the above reasoning should have made clear the theoretical embarrassment rising after the G21.5–0.9 case.
An alternative explanation: dust scattering
An alternative interpretation is that the plerionic nebula is not intrinsically more extended in X rays than in radio; but that the observed X-ray halo is just an effect of dust scattering in the foreground medium.
Following the empirical relation derived by Predehl and Schmitt (1995), the measured column density (as from Warwick et al., 2001) corresponds to (where indicates the dust scattering optical depth at 1 keV). For such a high value the expected fractional halo intensity is compatible with what measured (38%) in the 0.1–2.4 keV band. However the Predehl and Schmitt statistical relation allows a considerable dispersion, and therefore it is not sufficient by itself to prove that dust scattering is the main cause of the halo observed in G21.5–0.9.
We should add that fits to the halo spectrum imply values significantly lower than in the inner part of the plerion (Warwick et al., 2001; Safi-Harb et al., 2001). This decrease of with increasing radius cannot be intrinsic; it may be regarded, instead, as a sign that dust scattering distorts to some extent the local spectra, biasing the spectral fits. Scattering may partly affect even the observed radial softening in the X-ray halo. The analysis described below is intended to explore in depth the dust scattering hypothesis, by investigating the halo properties in various X-ray energy bands, taking advantage of energy scaling relations intrinsic of the scattering physics.
MODELLING A DUST SCATTERING HALO
The data
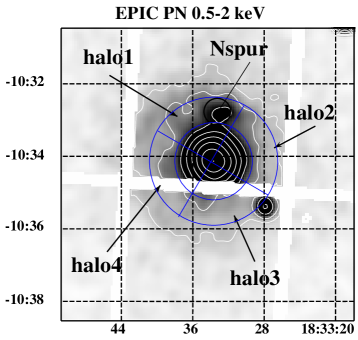
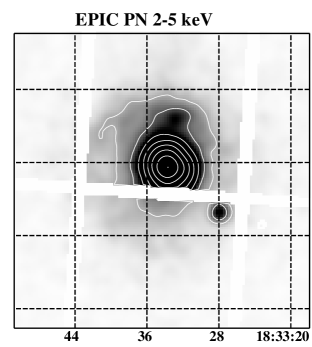
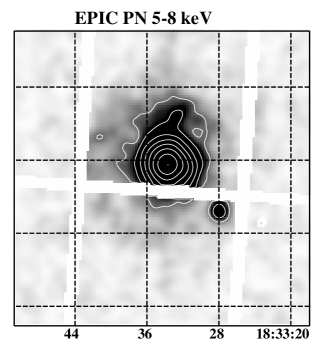
We have reanalyzed EPIC/PN data obtained in a XMM-Newton Cal/PV observation of G21.5–0.9. In Figure 1 the source is imaged in three different bands, 0.5–2, 2–5 and 5–8 keV. Overlaid to the soft image are the selection areas for the spectral analysis described in the last section: an annulus with inner and outer radius of respectively and has been subdivided into 4 sectors, labelled as halo1 (P.A. from to ), halo2 (P.A. from to ), halo3 (P.A. from to ), halo4 (P.A. from to ); furthermore, a diameter circle centered on the North Spur has been labelled Nspur.
The model assumptions
Our analysis is based on some assumptions, which are listed below.
-
•
We assume that the scattering is adequately described by the Rayleigh-Gans Theory. This implies well defined energy dependences, both for the halo scale length () and for the scattering optical depth (; see e.g. Mauche and Gorenstein, 1986). A deviation from these power laws is expected in soft X rays, and is actually observed in our data (see below).
-
•
The dust properties (namely dust density and grain size distribution) are taken to be homogeneous along the line of sight. In the case of variations in the distribution, a sort of average is obtained. An uneven density distribution along the line of sight, instead, does not affect the profile of the halo tail (on which we base our analysis).
-
•
We model the intrinsic X-ray size of the source as only weakly dependent on energy. In fact in other plerions the X-ray size may slightly shrink with increasing energy. Anyway this would not affect the dust halo tail, where the original source can be hardly distiguished from a point-like source.
-
•
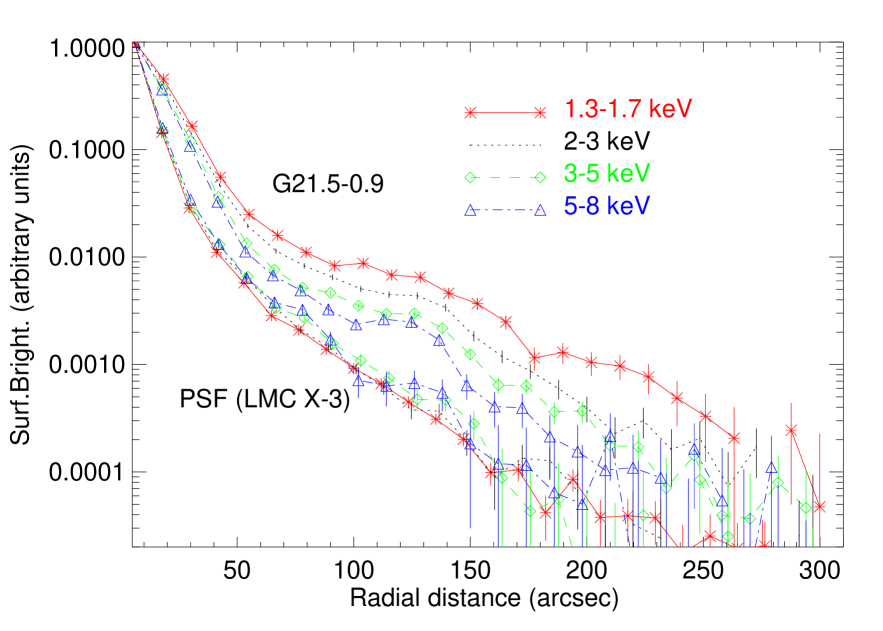
We assume EPIC/PN Point Spread Function (PSF) to be energy independent. Looking at the radial profiles of a point-like source (LMC X–3; Figure 2) it can be easily verified to be a valid approximation.
To summarize, all above assumptions look reasonable. Moreover the final conclusions do not strictly require them to be valid. Therefore we believe our results are rather robust.
Analysis procedure
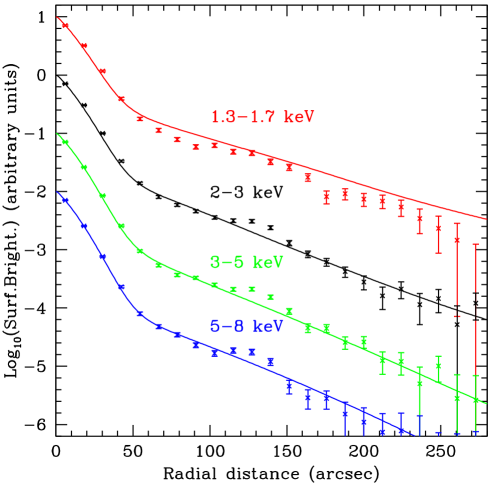
This procedure is based on the comparison of radial profiles in various X-ray bands. In order to obtain profiles of sufficient quality to detect even the outermost tail, we have limited our analysis to 4 spectral bands, namely 1.3–1.7 keV, 2–3 keV, 3–5 keV, and 5–8 keV.
Figure 2 shows the 4 profiles, for G21.5–0.9 as well as for LMC X–3 (a bright point-like source with low , used to determine the instrumental PSF). The profiles are background subtracted and vignetting corrected, and out-of-time events have been taken away. In the case of G21.5–0.9 we have also excluded regions of the image containing the North Spur and the star SS 397. All profiles are shown normalized to their peak value. In the case of G21.5–0.9 the radial profile is getting broader in softer X rays: this is not an instrumental effect, since from Figure 2 it is apparent that the PSF is energy independent till the faintest parts of its wings.
In order to fit the dust scattering halo of G21.5–0.9 we adopt a model with 3 parameters: (optical depth at 1 keV), (maximum grain size) and (power-law index of the grain distribution; Predehl and Schmitt, 1995). Taking the 5–8 keV profile G21.5–0.9 as a good guess of the halo-free source profile, a fit to the 2–3 keV source profile (see the relative curve in Figure 3) gives , , . Then, keeping all the best-fit parameters fixed, we have used the energy scaling laws for dust scattering in Rayleigh-Gans approximation (size , ) to successfully reproduce also the profile in the 3–5 keV X-ray band, while the data at 1.3–1.7 keV look slightly overestimated (Figure 3).
DISCUSSION
The main results of the above analysis are the following:
-
•
By comparing our best-fit () and (3.3) with the values averaged over a large sample of sources ( and ; Predehl and Schmitt, 1995), the distribution of grain sizes turns out to be flatter and more extended to larger sizes than the average; while, owing to the uncertainties involved in the Predehl and Schmitt empirical relation, the best-fit (1.50) is in reasonable agreement with the value (1.07) derived from ,
-
•
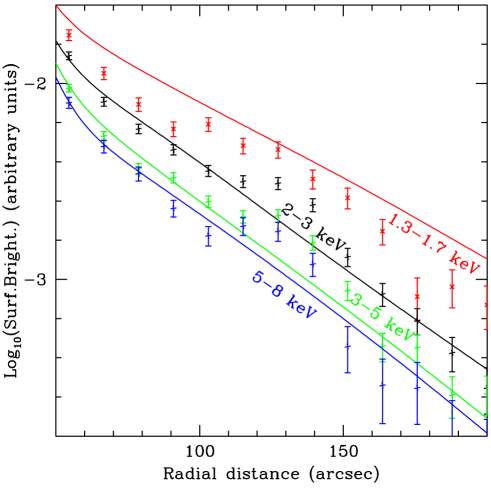
The detected slight discrepancy from the 1.3–1.7 keV data (about 30%, with the model overestimating the data) is naturally explained in terms of the invalidity of the Rayleigh-Gans theory in soft X rays. Simulations with a similar ratio (Smith and Dwek, 1998) give an offset in the same direction as observed, ranging from 25% (for graphite grains) to 50% (for silicate grains).
-
•
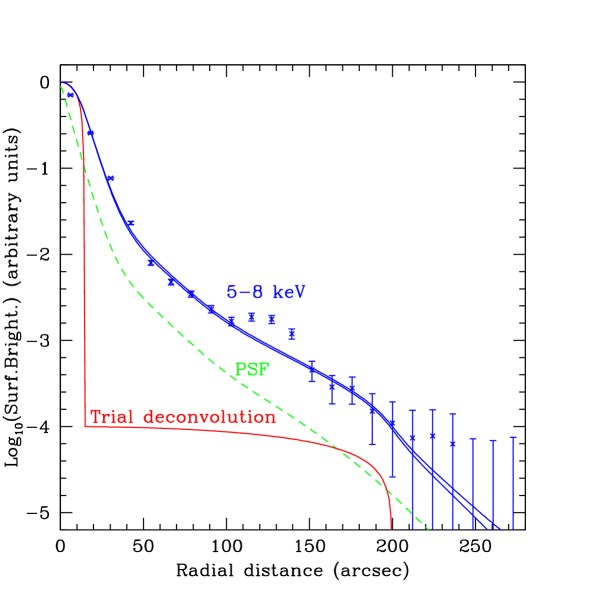
The radial profile in the 5–8 keV band, that on the basis of the above analysis should be only slightly affected by dust scattering, shows instead a tail broader than the PSF (Figure 4). This effect, although involving very weak surface brightnesses ( times the peak), is significant. It may either be an instrumental bias that we have not identified yet (and that is not documented), or the evidence of an intrinsic extended component, even though much less prominent than previously thought.
-
•
We have tried to reproduce the data in the 5–8 keV band convolving various simple source models with the PSF. No source smaller in size than the radio plerion has been found to reproduce correctly the X-ray wings. A good fit is obtained modelling the intrinsic halo as a uniform sphere of radius and surface brightness times the inner component (for a total flux which is only 2% of that of the inner source, Figure 4), although this solution is not unique.
THE NORTH SPUR
A spur has been detected in the northern sector of the halo (see Figure 1, as well as Warwick et al., 2001; Safi-Harb et al., 2001). The presence of this intriguing feature cannot be explained by our dust model. A pure power-law fit to the spur EPIC/PN spectrum gives acceptable values. However a pure power-law fit to the spur gives , namely a factor 2 less than for the other spectra: this discrepancy may indicate that a pure power-law fit is not appropriate.
If a thermal component is included in the fit model, it is significatively detected in the spur, while it is not detected in other halo regions. This is shown by the (1-, 2-, 3-) confidence contours plotted (Figure 5) in the parameters plane for the thermal component: the close contours refer to the area labelled Nspur (see Figure 1 for the areas definition), while fits to the areas labelled halo1, halo2, and halo3 give only upper limits to the thermal fraction (open contours). In fact, adding a thermal component in the fit to the Nspur region, the estimated is now between 1.7 and , values consistent with the other halo regions.

ACKNOWLEDGEMENTS
This work has been partly supported by the Italian Ministry for University and Research (MIUR) under Grant Cofin 2001–02–10.
REFERENCES
- (1)
- (2) Mauche, C. W., and P. Gorenstein, Measurements of X-ray scattering from interstellar grains, Astrophys. J., 302, 371–387, 1986.
- (3)
- (4) Predehl, P., and J. H. M. M. Schmitt, X-raying the interstellar medium: ROSAT observations of dust scattering halos, Astron. Astrophys., 293, 889–905, 1995.
- (5)
- (6) Safi-Harb, S., I. M. Harrus, R. Petre, et al., X-Ray observations of the Supernova Remnant G21.5–0.9, Astrophys. J., 561, 308–320, 2001.
- (7)
- (8) Slane, P., Y. Chen, N. S. Schulz, et al., Chandra observations of the Crab-like Supernova Remnant G21.5–0.9, Astrophys. J., 553, L29–L32, 2000.
- (9)
- (10) Smith, R. K., and E. Dwek, Soft X-ray scattering and halos from dust, Astrophys. J., 503, 831–842, 1998.
- (11)
- (12) Warwick, R. S., J.-P. Bernard, F. Bocchino, et al., The extended X-ray halo of the Crab-like SNR G21.5–0.9, Astron. Astrophys., 365, L248–L253, 2001.
- (13)