SWIRE: The SIRTF Wide-area InfraRed Extragalactic Survey
Abstract
The SIRTF Wide-area InfraRed Extragalactic survey (SWIRE), the largest SIRTF Legacy program, is a wide-area, imaging survey to trace the evolution of dusty, star-forming galaxies, evolved stellar populations, and AGN as a function of environment, from redshifts z3 to the current epoch. SWIRE will survey 7 high-latitude fields, totaling 60 - 65 sq. deg. in all 7 SIRTF bands: IRAC 3.6, 4.5, 5.6, 8m and MIPS 24, 70, 160m. Extensive modeling suggests that the Legacy Extragalactic Catalog may contain in excess of 2 million IR-selected galaxies, dominated by (1) 150,000 luminous infrared galaxies (LIRGs: L L⊙) detected by MIPS (and significantly more detected by IRAC), 7,000 of these with z2; (2) 1 million IRAC-detected early-type galaxies ( 2105 with and 10,000 with ); and (3) 20,000 classical AGN detected with MIPS, plus significantly more dust-obscured QSO/AGN among the LIRGs. SWIRE will provide an unprecedented view of the evolution of galaxies, structure, and AGN.
The key scientific goals of SWIRE are: (1) to determine the evolution of actively star-forming and passively evolving galaxies in order to understand the history of galaxy formation in the context of cosmic structure formation; (2) to determine the evolution of the spatial distribution and clustering of evolved galaxies, starbursts and AGN in the key redshift range, 0.5z3, over which much of cosmic evolution has occurred; (3) to determine the evolutionary relationship between “normal galaxies” and AGN, and the contribution of AGN accretion energy vs. stellar nucleosynthesis to the cosmic backgrounds. The large area of SWIRE is important to establish statistically significant population samples over enough volume cells that we can resolve the star formation history as a function of epoch and environment, i.e. in the context of structure formation. The large volume is also optimised for finding rare objects.
The SWIRE fields are likely to become the next generation of large “Cosmic Windows” into the extragalactic sky. They have been uniquely selected to minimize Galactic cirrus emission over large scales. GALEX will observe them as part of its deep 100 sq deg survey, as will Herschel. SWIRE includes 9 sq deg of the unique large-area XMM-LSS hard X-ray imaging survey, and is partly covered by the UKIDSS deep J & K survey. An extensive optical/near-IR imaging program is underway from the ground.
The SWIRE data are non-proprietary; catalogs and images will be released twice-yearly, beginning about 11 months after SIRTF launch. Details of the data products and release schedule are presented.
1 Scientific Goals of SWIRE
1.1 Modes and Rates of Star Formation
With SWIRE we seek to directly measure the light of both dusty galaxies and evolved stellar populations at (Universe age 2 Gyr) 111H0=75 km/s/Mpc, 0.7, =0.3, which we adopt throughout except for some length scales and volumes quoted in H km/s/Mpc units, with enough galaxy and volume cell statistics to fully sample the range of density environments from dense clusters to voids.
From a theoretical viewpoint, the standard cosmological paradigm — that we live in a CDM universe that began with the Big Bang followed by an inflationary period — has been exceedingly successfully in explaining the major cosmological observations, including the cosmic microwave background and its spatial structure, the power spectrum of the CMB, cosmic nucleosynthesis, the large-scale filamentary structure of the cosmic web of galaxies, and dark matter halos.
When it comes to galaxy formation and evolution, the observational situation becomes much more complex because we most easily study light, whereas theory only directly predicts the distribution and merging history of the underlying mass distribution, and the relation between the two depends on complex, usually non-linear, astrophysical processes. In spite of this, hierarchical theories have also been remarkably successful at predicting the overall scheme of galaxy formation and evolution: that it is dominated by merging of clumps within dark matter halos and the steady accretion of gas into disks; that it was at peak activity at z1-3; that it seems to have occurred faster in higher density environments; and that it has declined sharply since z1. The morphology of galaxies seems to have evolved strongly, driven by both major and minor mergers and by episodes of gas accretion, and the Hubble sequence as we now know it seems to have come into being between redshifts 1 to 2.
Mid- and Far-infrared (IR) observations of evolving galaxies are essential because a large fraction of emitted starlight in galaxies is absorbed and re-emitted by dust in the thermal infrared. The COBE detection of the Cosmic Infrared Background (CIB) has illustrated that 50% of the total luminous energy density of the Universe emerges longward of 1m (Hauser & Dwek, 2001). An even higher fraction of a galaxy’s light (90% or more) can emerge in the far-infrared in starbursts, which may be a significant mode of star formation over the history of the Universe. The most extreme IR objects are the ULIRGs (ultraluminous IR galaxies), with QSO-scale luminosities (), which are very rare in the local Universe.
The ISO satellite made several important surveys at 6.7, 15, 90 and 170m, resulting in star formation histories that increase even more steeply back in time than observed in the UV-optical (Rowan-Robinson et al., 1997; Elbaz et al., 1999). Perhaps most surprisngly, a large population of faint submillimeter sources has been discovered, using SCUBA on JCMT, which represent a population of very luminous objects at redshifts –4 with a much higher space density than the local ULIRGs (Blain et al., 2002; Chapman et al., 2003b). These populations, and the integrated CIB, have been modelled successfully using phenomenological models (Rowan-Robinson, 2001; Chary & Elbaz, 2001; Xu et al., 2001) some of which require high rates of luminosity evolution, . Moreover the star formation efficiencies (SFEs) of the high z ULIRGs may have been much higher than now; Blain et al. (1999) find the halo mass-to-infrared light ratio of a typical merger at z=3 to be 200 times smaller than today.
These results challenge hierarchical models conceptually because it is expected that galaxy masses grow slowly as smaller systems merge and gas accretes. Indeed, no CDM-based model, whether semi-analytic or N-body, has successfully reproduced the observed numbers of high redshift ULIRGs from the submm data (Guiderdoni et al., 1998; Fardal et al., 2001; Devriendt & Guiderdoni, 2000; Somerville et al., 2001; Somerville, 2003). Instead, very high star formation rates (SFRs) at early times are more reminiscent of monolithic collapse theories than the standard hierarchical theory. In an extreme case, too much star formation in bursts at high redshift will conflict with the conversion rate of baryonic matter into stars that is derived from deep K-band studies (Dickinson et al., 2003).
There are significant unknowns associated with these studies of the evolving IR galaxy populations. A major one is the dust temperature: with only a single 850m detection on the Rayleigh Jeans tail of the Planck spectrum, the temperature is unconstrained and the luminosity and SFR can be uncertain by up to 2 orders of magnitude (Kaviani et al., 2003). Rowan-Robinson (2001) suggests that the high redshift IR population might be dominated by cooler dust emission from larger disks than the sub-kpc-scale warm dust sources that seem to characterize local ULIRGs, and indeed Chapman et al. (2003a) find evidence for some cool ISO sources at z1. Other unknowns include the timescale for starbursts at high redshift, the form of the initial mass fucntion (IMF) in starbursts (an IMF truncated at the low mass end would reduce conflicts between the observed luminosities and the conversion rate of gas to stars (Franceschini et al., 2001)), and the contribution to the IR luminosities of dust-enshrouded AGN.
SWIRE is designed to provide unique and essential information about star formation rates and modes between about 0.5z3. The multiple bands spanning the thermal infrared from 4 to 160m provide unprecedented coverage of the SED, which will allow an accurate estimate of the luminosity of the warmer dust components out to redshifts 2, and cooler components to lower redshifts. Color-dependent luminosity functions will elucidate starburst vs. quiescent star formation rates, and starburst timescales vs. AGN processes. SWIRE will address how star formation in IR-luminous systems differed at early times from today. The majority of SWIRE dusty populations will be LIRGS () at z1, when bulges and disks were fully coming into being, so we can study star formation rates associated with these processes directly. The z2 SCUBA sources had much higher star formation efficiency than local ULIRGs: did they simply have more prodigious nuclear starbursts (local ULIRGs concentrate their starbursts within the central 1kpc, and frequently the central 100pc)? Or did they sport extensive disks with high star formation efficiencies throughout, driven by high rates of gas accretion in galaxy clusters? Or are they enormous mergers with extensive regions of distributed star formation? The dust temperature associated with these episodes will be a strong discriminator because higher density star forming regions typically reach higher dust temperatures.
The large SWIRE fields will allow us to track these processes as a function of environment in hundreds of volume cells from rich clusters to the “field”. For example, we can search for the CDM-predicted trend for active star formation to be more closely confined to the denser regions of the Universe at the higher redshifts, and as star formation rates decrease in overall strength with cosmic time, to move systematically to less and less dense environments.
The large volume of SWIRE is also uniquely important for the discovery of rare objects; a large “shallow” extragalactic survey can cover more volume than the same amount of time spent on a smaller, deeper one (Condon et al., 1998) as demonstrated by the success of the Sloan Digital Sky Survey at finding z5 QSOs (Fan et al., 2003). In particular, SWIRE has much more volume sensitivity to z3 ULIRGs than current submm surveys, with the potential to detect 100 z3 ULIRGs per square degree by their 8 &/or 24m flux, according to the models of Xu et al. (2003), which are consistent with faint submm counts and redshift distributions, and the CIB. Thus SWIRE will confirm the presence of a substantial population of high z ULIRGs, improve estimates of their luminosities and SFRs, and trace their clustering properties. Intriguingly, there is tentative evidence to suggest that high- sub-mm sources may be clustered (Scott et al., 2002; Almaini et al., 2003), as might be expected if these events are tracing the highest density environments at these redshifts. According to semianalytic star-formation scenarios (e.g, Somerville et al. (2001)), ULIRGs at high-z may be tracers of already formed massive halos. Although at low redshift ULIRGs are associated with violent mergers and are not found in massive halos (rich clusters), at earlier epochs galaxy building occurred first in the deepest potential wells, and distant ULIRGs may be the progenitors of current cluster spheroids. SWIRE may detect enough ULIRGs at z2.5 with halos of mass M⊙ to allow a statistical estimate of , the rms fluctuation of the mass distribution on 8/h Mpc scales; the predicted number density of such halos differs by a factor of 6 at z2.5 for 0.70.9 (Somerville, 2003).
1.2 Spheroids
While dust emission in galaxies tracks the most recently formed stellar populations, the SEDs of passively evolving older stellar populations peak in the near-infrared, and the wavelength bands of SIRTF’s IRAC camera were selected (in part) to optimize study of them at high redshifts. A fundamental goal of SIRTF/IRAC is to establish the evolution of the mass and luminosity functions of evolved stellar populations, and relate them to the morphological and color evolution of galaxies and the establishment of the Hubble sequence (Simpson & Eisenhardt, 1999). Is there a significant population of high redshift evolved systems which formed at very high redshift in a “monolithic collapse” scenario, as perhaps indicated by the SCUBA sources, or can hierarchical models fully explain the formation of massive galaxies and spheroids at moderate redshifts from merging of pre-existing galaxian units? Are the stellar populations of distant spheroids being formed in substantial amounts at 1z2, or are older stellar populations being dynamically assembled into massive systems at these moderate epochs?
Fossil evidence in the local Universe favors a uniform, high-redshift formation epoch for massive cluster ellipticals; in particular, the tightness of the fundamental plane and the enrichment of massive systems with elements (Ellis et al., 1997) point to rapid homogeneous star formation episodes at high redshift. However, recent HST imaging of distant spheroids has revealed substantially more morphological than color evolution at z2-3, revealing increasing evidence for mergers and peculiarites with increasing redshift (Conselice, 2003; Phillips et al., 2001), and evidence for significant color inhomogeneities (Benson et al., 2001; Menanteau et al., 1999; Kajisawa & Yamada, 2001). Estimates for the stellar masses and the stellar mass build-up with redshift of a deep K-band sample in the HDF-N (Dickinson et al., 2003) indicate that only 3-14% of the current day mass in stars had formed by z2.7, and 50-75% had formed by z1. This is in agreement with some hierarchical models (between which there is significant dispersion in predictions), but apparently in disagreement with models in which the bulk of stars in present day spheroids formed at very early times (z2). On the other hand, Benson et al. (2001) find that hierarchical models under-predict the proportion of high-redshift, homogeneous, passively evolving objects, and Labbe et al. (2003) find a much larger population of red systems with z2 in the HDF-S than Dickinson et al. (2003) do in HDF-N. Conselice (2003) finds that the rate of major mergers amongst the most massive systems increases strongly with z, reaching 50% at z2.5, in qualitative agreement with the hierarchical picture. On the other hand, massive systems with rapid star formation must already be in place at z , an observation that is difficult to reconcile with slow stellar mass build-up predictions of some hierarchical models, such as Cole et al. (2000). Central to these discussions is the cosmological model assumed; eg. Phillips et al. (2001) find morphological number counts in the HDFs inconsistent with the large implied by current concordance cosmology.
SWIRE/IRAC will directly provide the accumulated mass in evolved stars measured from the r′-5m SEDs. IRAC design was in part optimized for measuring the stellar mass of distant systems, and the GOODS Legacy program takes this science to the deepest possible SIRTF limit in a very small region of sky. Ground-based and HST NICMOS studies are limited to m, corresponding to z0.6 for the 1.6m SED peak of evolved stellar systems. IRAC therefore provides much more robust determination of stellar masses to much higher redshifts (Sawicki, 2002; Dickinson et al., 2003; Franceschini et al., 2003). SWIRE/IRAC observations are very well matched in depth to SWIRE dusty galaxy observations, sampling the important z=1-2 redshift range over which low matter-density cosmological models predict much evolution.
A key advantage of SWIRE’s large area coverage is that these questions can be addressed using large samples over many contiguous volume cells, thus minimizing cosmic variance problems, such as those implied between HDF-N and HDF-S, as mentioned above. Moreover we naturally expect a strong dependence of cosmic evolution and the timescales of galaxy formation on the local matter density, so it important to survey the full matter density range in a homogenous fashion.
1.3 Active Galaxies
The fundamental cosmogonic questions concerning active galactic nuclei (AGN) include (1) the true distribution of physical processes underlying the zoo of observational classes of AGN; (2) the connections between galaxy formation and black hole growth and activity; (3) the importance of AGN contributions to re-ionizing the Universe; and (4) the contribution of gravitational energy from AGN to the overall luminous energy density of the Universe as a function of redshift.
The most challenging aspect of AGN research over the years has been in assembling complete samples, because AGN suffer very strong observational selections effects of many kinds, which are very difficult to separate from intrinsic physical differences. SWIRE will be one of the best ever surveys for AGN because many AGN classes emit strongly in the mid-IR where extinction is low and where SWIRE has excellent volume sensitivity. In particular, many AGN have warm mid-to-far-infrared colors compared to star formation-dominated galaxies, and thus will be preferentially selected by the highly sensitive 8 and 24m SIRTF bands.
Moreover, evidence is now very strong for the existence of a substantial population of AGN which are heavily absorbed, and which are strong mid- to far-IR emitters. Highly reddened and absorbed AGN are turning up in radio, hard X-ray and near infrared surveys (Maiolino et al., 1998; Gregg et al., 2002; Cutri, 2001). Some of these populations are consistent with the classical AGN unification picture featuring axisymmetrical distributions of surrounding absorbing material, and others favor a young AGN turning on during a merger/starburst episode, deeply embedded in obscuring material from most or all vantage points. Furthermore, the long-standing puzzle over the mismatch between the spectral slope of the cosmic X-ray background and that of its presumed consituent quasars may be solved now that the XRB is close to being resolved by XMM and Chandra, and is found to be well explained by a population of high column AGN which increases in number density with redshift (Comastri et al., 2001; Gilli, 2001; Polletta et al., 2003).
A major SWIRE goal is therefore to determine the evolving number density of AGN, particularly heavily obscured ones, and to quantify much better than any other survey their number density at z1, and their contribution to the CIB; see Polletta et al. (2003) for a recent model. A difficulty with this goal concerns the most heavily obscured AGN, which can have columns over N (Maiolino et al., 2000), and which can therefore be optically thick even in the near- and mid-IR and thus not recognizable even in SWIRE mid-IR colors. Thus it is most important to undertake hard X-ray surveys in SWIRE fields. The XMM-LSS field (Section 1.5) will be our prime one for obscured AGN studies.
The other key wavelength range for detection of heavily obscured AGN is the radio, thus a systematic deep radio survey would be of great value in the SWIRE fields. The remarkably tight FIR/radio correlation for star forming galaxies can be used as a tool for identifying radio-loud AGN. Only with radio and hard X-ray surveys can the population of dust-shrouded AGNs be recognized and discriminated from starbursts.
SWIRE can be expected to make direct and unique contributions to the AGN unification debate, due to the size and completeness of its AGN samples. SWIRE will constrain the IR properties of AGN of all types over large volumes and all environments: how many of the known AGN classes are IR-loud and how does IR-loudness relate to other AGN properties and to the presence of a starburst? SWIRE will also track the IR evolution of all IR-loud AGN classes over a substantial redshift range, addressing the global evolutionary connections between them.
Another important SWIRE goal is to understand the “starburst-AGN connection”. The locally observed correlation between the masses of black holes and their surrounding stellar bulges (Magorrian et al., 1998) implies that the formation of the two are linked, yet we do not understand how. Clues must come from the relationship between star formation and black hole accretion in active galaxies, since it is widely believed that merger-driven starbursts are effective bulge-builders. A close phenomenological relationship between starbursts and AGNs has been recently suggested by Franceschini et al. (2003) based on deep combined IR and XMM-Newton observations. How are starbursts and AGN triggered in active galaxies? How does AGN feedback affect starburst activity and vice versa?
In the local Universe, IR-luminous starburst and AGN activity is often triggered by galaxy mergers, especially for the most luminous ULIRGs () (Surace et al., 2000; Farrah et al., 2001). At high redshift, however, the trigger for starburst/AGN activity of the luminous submillimeter sources is not known. Possibilities include multiple mergers between many small galaxies, or even collapse of a large disk of gas to form a protogalaxy (Farrah et al., 2002a), this latter possibility is hinted at by models for high- sub-mm sources that suggest a cirrus origin for the sub-mm emission (Efstathiou & Rowan-Robinson, 2003).
Once triggered, the effects of starburst and AGN activity on each other are currently the subject of debate. Theoretical arguments (Silk & Rees, 1998) suggest that the onset of AGN activity will curtail a starburst, due to superwinds from the AGN, and indeed modelling of starburst and AGN activity in protogalaxies (Granato et al., 2001), and of BH and spheroid formation (Archibald et al., 2002) suggest that most of the star formation must have taken place before the onset of AGN activity. Conversely, there is substantial observational evidence (Priddey & McMahon, 2001; Farrah et al., 2002b) that starburst and AGN activity can be coeval in QSOs and Hyperluminous Infrared Galaxies (); many of these systems contain a luminous AGN together with star formation rates (inferred from sub-mm observations) so high that it is unphysical to argue that they are not at or near their peak.
1.4 Large Scale Structure
Theories of structure formation were strongly constrained by the statistical measurements of clustering in some of the early galaxy redshift surveys. Surveys of infrared galaxies, in particular, were able to rule out the then standard Cold Dark Matter Model (Efstathiou et al., 1990; Saunders et al., 1991). Present day redshift surveys such as the 2dFGRS (Colless et al., 2001), SDSS (York et al., 2000) and, in the far-infrared, the Point Source Catalog Redshift survey, PSC-z (Saunders et al., 2000) are now able to provide definitive measurements of the galaxy clustering in the local Universe.
Despite this success, we have always known that galaxies are biased tracers of the matter distribution. The evidence for this is that different types of galaxies cluster differently (Babul & Postman, 1990; Lahav et al., 1990; Oliver et al., 1996; Norberg et al., 2002). If then some dynamical comparisons of the galaxy velocity field and density fields are consistant only if bias is included (Dekel, 1994; Strauss & Willick, 1995; Rowan-Robinson et al., 2000) while other comparisons do not require bias (Willick & Strauss, 1998), and recent studies of 2dFGRS redshift-space distortions are also consistent with no bias (Lahav et al., 2002). Bias is expected because galaxies represent only a small fraction of the total mass and even in very simplistic models where galaxies form at the peak of the mass distribution this produces a bias (Kaiser, 1984). The strong interactions seen in actively star-forming, ULIRGs also provide circumstantial evidence that galaxy formation depends on the environment in which galaxies find themselves, which would also lead one to expect a bias. Until this question of bias is resolved the modern galaxy surveys will be unable to probe the clustering properties of the underlying mass field and thus test the cosmological models that relate these to the CMB fluctuations.
Recently, models of structure formation have included physically motivated mechanisms for galaxy formation to predict the spatial and temporal evolution of galaxies, either using semi-analytic prescriptions or hydrodynamic N-body simulations (Pearce et al., 2001; Somerville et al., 2001; Benson et al., 2001; Blanton et al., 2000). By predicting the clustering properties (and their evolution) of different types of galaxies such models provide testable explanations of galaxy bias. However, this field is still in its infancy, partially due to a lack of observational constraints over a significant redshift baseline.
SWIRE is able to make two key contributions to the understanding of bias and constraining structure formation models of galaxy formation: the survey samples very different populations of galaxies within the same volume of the Universe and it provides a good sampling of large volumes at high redshift.
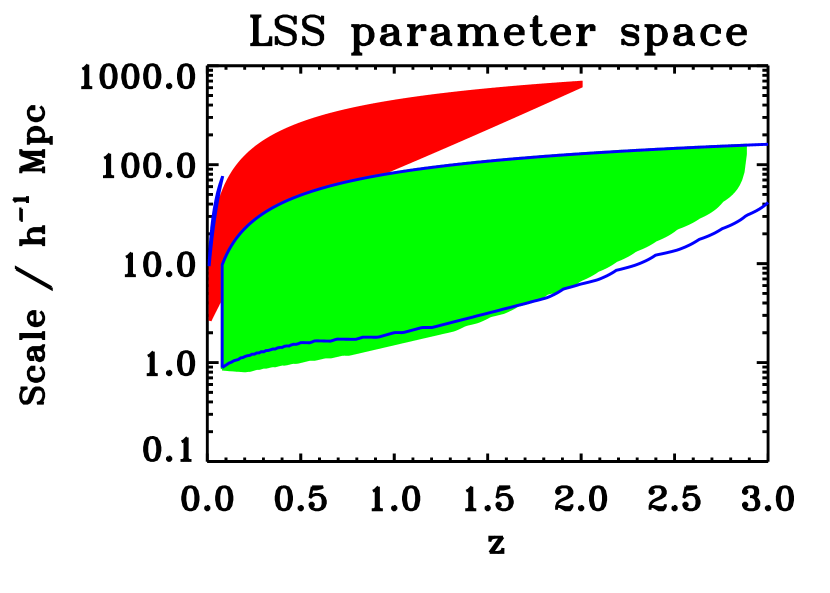
We illustrate the large-scale structure parameter space that SWIRE and other surveys could probe in Figure 1 and Table 2. The parameters of interest are the spatial scale of clustering, , and the redshift, . To judge how a survey probes this parameter space we imagine the survey out to to be divided into cells with volume and assume that a cell has to have a mean density above 1 galaxy per cell to be included, and that 100 cells are required for a useful clustering analysis. We also imposed a minimum redshift below which the mean density of the survey is poorly determined due to sampling variance.
1.5 Clusters and the XMM-LSS Field
As outlined above, measuring high redshift clustering is one of the challenges of modern observational cosmology. Whereas galaxies are often considered as difficult objects to understand in terms of initial density fluctuations, clusters of galaxies, in a first approximation, are simpler and complementary. Indeed, an ab initio theory exists (and is well tested by N-body simulations) to describe how the cluster density variations relate to the dark matter density variation (biasing) while such a relation does not exist for galaxy formation. Moreover, clusters are the most massive relaxed entities of the Universe, located at the intersection of the cosmic filaments; cluster growth occurs by matter accretion flowing along the filaments. Studies of structure evolution and of cluster abundance can independently check cosmological parameter values determined from CMB and SN studies, as they do not rely on the same physical processes. Lastly, from the purely physical point of view, clusters represent dense environments i.e. deep potential wells as well as high concentrations of galaxies, dark matter, and intra-cluster gas. The entire cluster-group population thus provides an ideal range of conditions to study environmental effects on the formation of galaxies, active nuclei and the triggers of star forming activity.
The number of spectroscopically confirmed clusters beyond is still quite small; the reason is simple: detection of high-redshift clusters requires finely-tuned multi-color techniques in the optical wave-band because of the high surface density of faint background galaxies. Proposed techniques, e.g. adaptive matched-filters (Kepner et al., 1999), cluster elliptical red-sequence (Gladders & Yee, 2003), photometric-redshift classification (Kodama et al., 1999), etc, are very model dependent owing to color evolution of the cluster galaxies and, since they rely primarily on photometric redshifts, they frequently provide large numbers of cluster candidates which are simply portions of cosmic filaments viewed in projection. In parallel, X-ray observations at high galactic latitude are an important tool for detecting distant clusters because cluster emission, which can only be produced by hot gas trapped in deep potential wells, is extended and easily distinguishable from unresolved QSOs, greatly reducing confusion and projection effects arising in the optical.
In this context, using the unrivalled sensitivity of the XMM-Newton Observatory, the XMM Large Scale Structure Survey (XMM-LSS) has been designed to investigate the large scale structure of the Universe out to a redshift of 1 as traced by clusters. It will moreover probe the presence of massive clusters out to z2 and enable QSO studies out to z4 with a density of objects some 6 times larger than 2dF. A detailed description of the XMM-LSS can be found in Pierre et al. (2002), and preliminary results in Pierre et al. (2003). The optical counterpart of the X-ray survey is being provided by the CFHT Legacy Survey222http://cdsweb.u-strasbg.fr:2001/Science/CFHLS/ and is subject to a vigorous spectroscopic follow-up program (Valtchanov et al., 2003; Willis et al., 2003).
The XMM-LSS depth (z1-2 for clusters, z4 for QSOs) matches that of SWIRE very well. Consequently, the combination of the XMM-LSS and SWIRE data set over an area of 9 sq. deg. will provide the first coherent study of biasing mechanisms as a function of scale for X-ray hot (XMM), dark (weak lensing), luminous galaxies (optical, SWIRE) and obscured (SWIRE) material as well as unique new insights into the physics of heavily obscured objects.
1.6 Other Fields of Study with SWIRE
Besides the extragalactic topics described above, which drove the design of the SWIRE survey, there are many other studies possible with SWIRE data. These include nearby resolved galaxies, brown dwarfs, evolved stars, circumstellar disks, cirrus emission, and asteroids. While we cannot address all of those topics here, we give a few highlights with further details in Section 6.
There are 4542 2MASS galaxies with diameter in the 2MASS Extended Source Catalog within the SWIRE fields, about 500 of which have diameter . Many of these NIR-selected galaxies may be detected as extended by IRAC.
SWIRE will be exceptionally powerful for brown dwarf detection due to its wide area coverage and sensitivity, potentially able to detect a 5Gyr old, 275K brown dwarf at 10pc. We give estimates of detection statistics in Section 6.9.
SWIRE can also provide samples of new debris disks around young stars, unbiased by age or spectral type. We may expect to detect up to 150 of them with MIPS.
2 The SWIRE Survey
The SWIRE fields are listed in Table 1. The SWIRE survey was designed to take maximum advantage of the unique capabilities of SIRTF to further the study of cosmology and of galaxy formation and evolution; it is the widest survey that can be made with the SIRTF time available that is comensurate with robust data quality. In addition, since it is a Legacy survey, an over-riding principle in the design of SWIRE was to ensure that the data products would be of long-lasting value for an extremely broad range of scientific investigations, and not just for the few that the SWIRE team itself would be able to undertake.
The depth, area-coverage and number of fields of the SWIRE survey were the result of a trade-off analysis between redshift depth, maximum volume cell size, number of volume cells, number of lines-of-sight required to minimize cosmic variance, acceptable foreground cirrus noise levels and total integration time. An initial consideration was that SWIRE complement the already planned deep survey of the Guaranteed Time Observers (GTO; Fazio et al. (2003); Rieke et al. (2003)), which covers 60.4 to 5 photometric sensitivities, 2Jy at 3.6m and 0.11mJy at 24m.
A governing factor in the SWIRE design was the availability of SIRTF astronomical observing templates (AOTs). For MIPS a natural mode and survey depth for a large area survey which nicely complements the GTO deep survey is moderate scan speed with two passes of 4s integrations each. (see Section 2.2.2 for details). This results in 80 seconds of integration per point on the sky with a sensitivity at which many models predict the extragalactic sky to be mildly confusion limited to the SIRTF 70m beam (see Table 4). This then became the depth yardstick for SWIRE.
The total area coverage was selected such that the survey would probe several hundred volume cells of scale 100 Mpc; enough to sample many different environments within the cosmic web. The number of lines-of-sight was a trade-off between cosmic variance considerations (more fields) and maximizing the physical size-scale probed in each field (fewer, larger fields), moderated by the availability of large sky areas with acceptable cirrus noise levels. The resulting 7 fields project between 130 and 250 100h-1 co-moving Mpc at z=2, with about 50 100Mpc-scale co-moving radial distance cells along each line of sight to that epoch.
The SWIRE fields and SIRTF prime observation windows are detailed in Table 1, with secondary windows listed for 3 fields. The expected SWIRE 5 photometric sensitivities compared to anticipated cirrus noise (see below) and confusion limits are shown in Table 4. Regarding confusion noise, care must be taken in comparing different predicitions, which depend both on the underlying source count model, the method used to derive the confusion noise, and the accuracy with which the PSF, the instrument and the data taking methods are modeled. A detailed treatment for MIPS is given by Dole et al. (2003), and predictions based specifically on the SWIRE models, data observation strategy and data processing methods are presented by Rowan-Robinson et al. (2003).
| Field | Center | Area | Primary1 | P.A. | Background | |||
|---|---|---|---|---|---|---|---|---|
| (J2000) | (square degrees) | Window | I(100)m | |||||
| RA | DEC | MIPS | IRAC | Start | End | (°E of N) | (MJy/sr) | |
| h m s | d m s | |||||||
| ELAIS-S1 | 00 38 30 | 44 00 00 | 14.32 | 14.26 | Oct 28 | Dec 25 | 293–249 | 0.42 |
| XMM-LSS | 02 21 00 | 05 00 00 | 9.00 | 8.70 | Dec 25 | Feb 5 | 328–343 | 1.3 |
| CDF-S | 03 32 00 | 28 16 00 | 7.14 | 6.58 | Dec 20 | Feb 19 | 303–351 | 0.46 |
| Lockman | 10 45 00 | +58 00 00 | 14.32 | 14.26 | Oct 26 | Dec 25 | 224–179 | 0.38 |
| Lonsdale | 14 41 00 | +59 25 00 | 6.70 | 6.69 | Nov 19 | Jul 15 | 259–28 | 0.47 |
| ELAIS-N1 | 16 11 00 | +55 00 00 | 9.00 | 8.70 | Dec 16 | Sep 3 | 255–1 | 0.44 |
| ELAIS-N2 | 12 36 48 | +41 01 45 | 4.45 | 4.01 | Jan 29 | Sep 16 | 216–357 | 0.42 |
1 Assuming 2003 August Launch. In the event that fields cannot be scheduled in the primary window, secondary windows are: ELAIS-S1: May 27 – Jul 26, PA = 136–179; CDF-S: Jul 23 – Sep 26, PA=150–198; Lockman: Mar 24 – May 23, PA = 70–24.
| z | Co-moving Length Scale | Co-moving Volume | Maximum number of cells | ||||||
|---|---|---|---|---|---|---|---|---|---|
| Mpc | /Mpc3 | ||||||||
| 6′ | 30′ | 1° | 2° | 4° | 65 square degree | ||||
| 0.1 | 0.51 | 2.6 | 5.1 | 10 | 21 | 0.16 | 168 | 1.34 | 0.16 |
| 0.5 | 2.3 | 11 | 23 | 46 | 93 | 15 | 1.54e4 | 123 | 15 |
| 1.0 | 4.0 | 20 | 40 | 81 | 162 | 82 | 8.21e4 | 657 | 82 |
| 1.5 | 5.3 | 27 | 53 | 107 | 213 | 188 | 1.88e5 | 1.6e3 | 188 |
| 2.0 | 6.3 | 32 | 63 | 127 | 253 | 315 | 3.15e5 | 2.5e3 | 315 |
| 3.0 | 7.8 | 39 | 78 | 155 | 311 | 581 | 5.81e5 | 4.7e3 | 581 |
This table gives the co-moving length scales for given anglar separations at different redshifts (columns 2-6). The smallest SWIRE field has an angular scale of 2°, the largest 4°. The total volume of the SWIRE survey at different is provided in column 7 and the number cells of a given size that the survey can be divided into is in columns 8-10. We have assumed kms-1Mpc-1, =0.3, =0.7.
| SWIRE | Survey | Instrument | RA | Dec | Bands | Size | Depth 1 |
|---|---|---|---|---|---|---|---|
| h m | d m | ||||||
| ELAIS-S1 | ELAISa | ISO | 0 35 | 43 28 | 7,15,90m | 4 | 1mJy2 |
| BeppoSAX/MECSb | 0 35 | 4 28 | 2-10 kev | 1.7 | 36 ks | ||
| ES1 Radio Surveyc | ATCA | 0 35 | -43 28 | 1.4GHz | 4 | 80Jy | |
| XMM-LSS | XMM/Moderate Surveyd | XMM | 2 24 | 5 | 0.5-10 kev | 2 | 20 ks |
| Subaru/XMM-Newton | XMM | 2 18 | 5 00 | 0.5-10 kev | 1 | 50&100ks | |
| Deep Surveyd | Subaru | R | 1.3 | 283 | |||
| SCUBA/SHADESf | 450&850m | 0.25 | 60,3mJy | ||||
| VLA | 1.4GHz | 1 | 12Jy | ||||
| XMM/LSS VLA Surveyg | VLA | 2 24 | 4 30 | 1.4GHz | 5.6 | 4mJy | |
| CDF-S | CDF-Sh | Chandra | 3 32 | 27 48 | 0.5-8kev | 0.1 | 1Ms |
| HST-WFPCi | VI | 17 | 28.2 | ||||
| HST-ACSj | BViz | 0.25 | V28 | ||||
| SIRTF/GOODSk | 3.6-24m | 300,50 | 4,0.02Jy4 | ||||
| SIRTF/GTOl | 3.6-160m | 0.4 | 0.11mJy5 | ||||
| Lockman | LH-E | ROSAT-HRIm | 10 53 | 57 29 | 0.5-2 kev | 0.13 | 1.2 Ms |
| ROSAT-PSPCm | 10 52 | 57 21 | 0.5-2 kev | 0.3 | 200 ks | ||
| XMMn | 10 53 | 57 29 | 0.5-10 kev | 0.2 | 190 ks | ||
| Chandrao | 10 53 | 57 29 | 0.5-8kev | 1.35 | 5 ks | ||
| ISOp,t | 10 52 | 57 21 | 7,15,90,175m | 0.1-0.5 | 3mJy2 | ||
| VLAq | 10 52 | 57 29 | 6,20cm | 0.35,0.09 | 11,30Jy | ||
| SIRTF/GTOk | 3.6-160m | 0.4 | 0.11mJy5 | ||||
| SCUBA 8mJyr | 10 52 | 57 22 | 450&850m | 130 | 8mJy | ||
| VLAs | 20cm | 100 | 5Jy | ||||
| SCUBA/SHADESf | 450&850m | 0.25 | 60,3mJy | ||||
| LH-Wt | ISO | 10 34 | 58 | 90,175m | 0.5 | 15mJy | |
| Chandrau | 10 34 | 57 40 | 0.5-8 kev | 0.4 | 40,70 ks | ||
| ELAIS-N1 | ELAISa | ISO | 16 10 | 15 31 | 15,90,175m | 2.6 | 1mJy2 |
| FIRBACKv | ISOPHOT | 16 11 | 54 25 | 170m | 1.98 | 50 mJy | |
| ELAIS Deep Xray Surveyw | Chandra | 16 10 | 54 33 | 0.5-8kev | 300 | 75ks | |
| XMM | 0.5-10 kev | 0.2 | 150 ks | ||||
| ELAIS-N2 | ELAISa | ISO | 16 37 | 41 16 | 7,15,90,175m | 2.6 | 1mJy2 |
| FIRBACKv | ISOPHOT | 16 36 | 41 05 | 170m | 0.96 | 50 mJy | |
| SCUBA 8mJyr | SCUBA | 16 37 | 41 02 | 450&850m | 130 | 8mJy | |
| VLAs | 20cm | 100 | 9Jy | ||||
| ELAIS Deep Xray Surveyw | Chandra | 16 36 | 41 01 | 0.5-8kev | 300 | 75ks | |
| XMM | 0.5-10 kev | 0.2 | 150ks |
1 ks for X-ray, limiting mag. for optical/NIR, 1 flux density for IR-radio; 2 15m; 3 R/r/r′ band; 4 24m; 5 3.6m; aOliver et al. (2000); bAlexander et al. (2001); cGruppioni et al. (1999); dhttp://xmm.vilspa.esa.es/ eMizumoto et al. (2003); fDunlop et al. (2003); gCohen et al. (2003); hGiacconi et al. (2001); Rosati et al. (2002); iSchreier et al. (2001); jhttp://www.stsci.edu/ftp/science/goods/abstract.html#; kDickinson et al. (2003); lFazio et al. (2003); Rieke et al. (2003); mHasinger et al. (1998); nHasinger et al. (2001); oKenter et al. (2002); pFadda et al. (2002); Rodighiero et al. (2003); qCiliegi et al. (2003); de Ruiter et al. (1997); rScott et al. (2002); Fox et al. (2002); sIvison et al. (2002); tKawara et al. (1998); uYang et al. (2003); vDole et al. (2001); wManners et al. (2003)
| Photometric Sensitivity / Noise Levels | |||||||
|---|---|---|---|---|---|---|---|
| Jy | Jy | Jy | Jy | Jy | mJy | mJy | |
| IRAC Wavelength (m) | 3.6 | 4.5 | 5.8 | 8.0 | |||
| MIPS Wavelength (m) | 24 | 70 | 160 | ||||
| Sensitivity 5 | 7.3 | 9.7 | 27.5 | 32.5 | 450 | 2.75 | 17.5 |
| Cirrus noise 5 | |||||||
| =0.5 MJy/sr (IRAS) | 2.8e-05 | 5.4e-05 | 1.3e-04 | 7.4e-04 | 3.1e-04 | 0.11 | 11 |
| =1.0 MJy/sr | 7.8e-05 | 1.5e-04 | 3.6e-04 | 2.1e-03 | 8.8e-04 | 0.32 | 30 |
| =2.0 MJy/sr | 2.2e-04 | 4.3e-04 | 1.0e-03 | 5.9e-03 | 2.5e-03 | 0.90 | 84 |
| Assumed SED | 1.3 | 2.0 | 3.4 | 6.4 | 5.8e-02 | 0.49 | 2.6 |
| Confusion limits1 | |||||||
| Beam FWHM, arcseconds | 2.05 | 2.05 | 2.08 | 2.50 | 5.6 | 16.7 | 35.2 |
| (10-6 sq. deg.) | 0.37 | 0.37 | 0.38 | 0.55 | 2.74 | 24.3 | 108 |
| Xu et al. (2003) model S3+E2 | 6.2 | 6.2 | 5.4 | 6.7 | 175 | 10.0 | 71 |
| Rowan-Robinson (2001) | 1.6 | 1.3 | 1.1 | 4.0 | 190 | 6.3 | 60 |
| Rodighiero et al. (2003); Franceschini et al. (2001) | 5.0 | 5.0 | 4.8 | 4.3 | 180 | 6.0 | 45 |
| Lagache et al. (2003); Dole et al. (2003) | 4.0 | 125 | 6.5 | 56 | |||
1 Using a source density criterion of 40 beams per source. The beam is assumed to be gaussian with the quoted FWHM values, which were derived from the pre-launch SIRTF beam profiles convolved with the band-dependant pixel sizes (MIPS: Dole et al. (2003); IRAC: this work).
2.1 Field Selection
We considered a number of factors in choosing our survey fields: cirrus contamination; existing or future multi-wavelength coverage; observability constraints; and avoidance constraints. A detailed discussion of these will appear in a future paper (Oliver et al., 2003). Here we discuss each constraint briefly.
Clouds within our own galaxy produces structured infrared emission, “cirrus”, which can be confused with extra-galactic sources, and which causes extinction in the soft X-ray and UV bands. To estimate the level of this cirrus noise we start from a scaling relationship derived by Helou & Beichman (1990), derived in turn from the power spectrum analysis of cirrus clouds performed by Gautier et al. (1992).
| (1) |
(we modify this slightly by replacing with the larger of and 5.8m). We have calculated the cirrus noise for regions of 0.5, 1 and 2 MJy/sr and compare these to our intended survey depth (Table 4). The cirrus noise is clearly not important for m, but if is above the cirrus noise exceeds our depth at 160m.
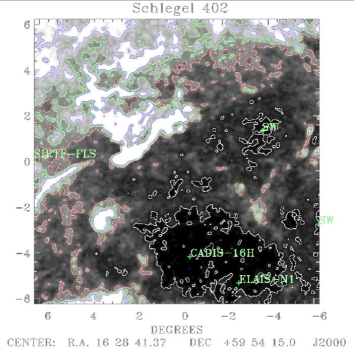
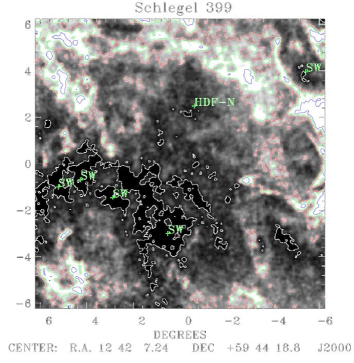
When choosing our survey fields we thus did not consider any field with a cirrus intensity much above 1MJy/sr. Since the structure of the cirrus is non-Gaussian and the source confusion limit is highly uncertain we adopted a more conservative limit of 0.5MJy/sr for most of our fields. We performed an exhaustive search over the whole sky considering all fields that met this latter criteria. The cirrus map for one of the fields that we finally selected is contrasted with one that we did not in Figure 2.
As a legacy project we felt it was important to select fields that already had a wealth of data. We assembled an extensive list of fields which have been extensively surveyed at a variety of wavelengths (Williams et al., 1996; Oliver et al., 2000). We examined the cirrus in all of these fields and rejected many where the cirrus was too high or where there were only small patches of low cirrus. One field, the XMM-LSS field, exceeded our cirrus threshold, but the wealth of survey data over a large area (in particular the XMM data) that this field provided was felt to outweight the risk of compromising the longer wavelength data. We only found it necessary to include one field that did not have extensive multi-wavelength data; this was a former WIRE field (Lonsdale).
We also considered the visibilty to SIRTF (and many other space missions) and thus excluded any fields below an ecliptic latitude of 30∘, with the exception of XMM-LSS.
To aid ground based follow-up we included a similar number of fields in the Northern and Southern Hemispheres and one equatorial field (XMM-LSS).
Images of all our fields area available on the SWIRE web site333http://www.ipac.caltech.edu/SWIRE/, and Table 3 details previously observed smaller fields that lie within the large SWIRE areas (excluding extensive ground-based optical and NIR imaging, which is extensive and complex).
2.2 SIRTF Observations
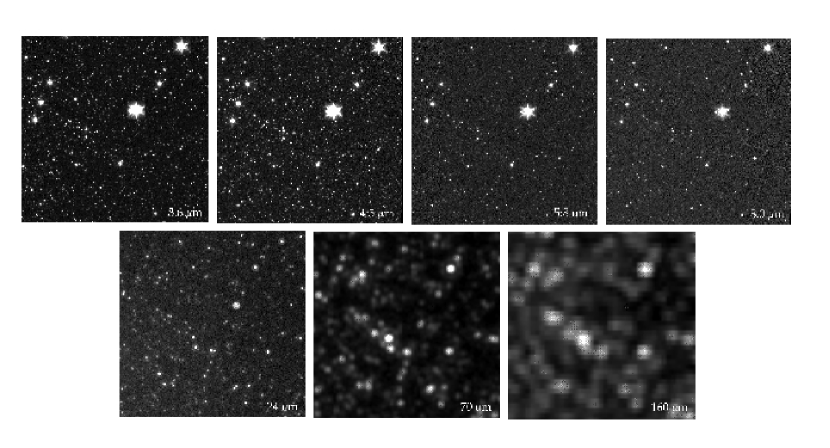
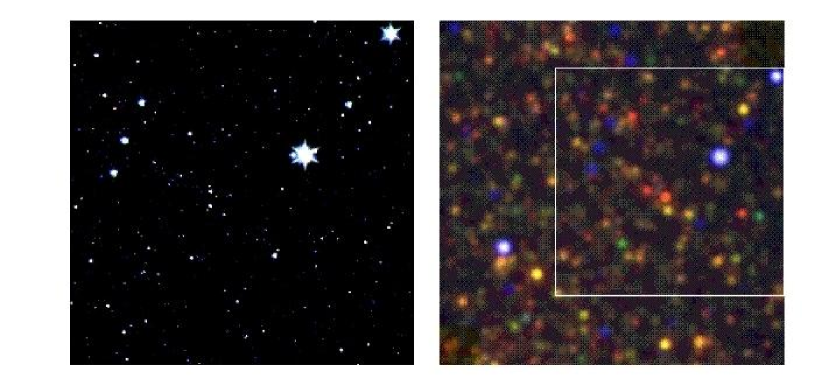
The SIRTF observations of the SWIRE fields are designed to return data with high sensitivity and a reasonable number of samples, while still covering large areas with both IRAC and MIPS. Since the longest SIRTF Astronomical Observing Requests (AORs) are limited to a few hours in duration, our observing strategy requires stitching together dozens of AORs to map each field. Visualizations of IRAC and MIPS AORs for the SWIRE ELAIS S1 field are shown in Figure 3.
2.2.1 IRAC
Our IRAC mapping strategy will result in four 30-sec exposures nominally covering each point. We chose the 30 second frame time as the best trade between sensitivity at the shorter wavelengths and obtaining enough overlapping images for reliable data–particularly because shorter IRAC exposures in the SWIRE regions are expected to be limited by read noise. The four exposures per point are divided between two coverages separated in time to allow discrimination against moving or transient objects.
Each coverage is made from several overlapping AORs. Each IRAC AOR will cover around a square degree. Within each AOR, the map grid spacing is 280 arcseconds, and two images are taken at each grid point. These exposures are offset slightly using the small-scale cycling dither in the Astronomical Observing Template (AOT). The AORs in each coverage overlap nominally by 120 arcsec when rotation is neglected.
The two coverages are spatially offset by 150 arcseconds along both map grid axes, to place the center of the grids of one coverage near the interstices of the other coverage grid.
Table 5 lists the sizes of each AOR, both in terms of grid cells and degrees, and the layout of these AORs into the IRAC map. The lower-coverage fringes have not been included in the angular extents.
| Field | Each AOR | Field layout | ||
|---|---|---|---|---|
| (grid of images) | (grid of AORs) | |||
| colsrows | degdeg | colsrows | degdeg | |
| ELAIS S1 | 1213 | 0.941.02 | 44 | 3.623.94 |
| XMM-LSS | 1313 | 1.021.02 | 33 | 2.952.95 |
| CDF-S | 1013 | 0.781.02 | 33 | 2.232.95 |
| Lockman | 1213 | 0.941.02 | 44 | 3.623.94 |
| Lonsdale | 1211 | 0.940.86 | 33 | 2.712.47 |
| ELAIS N1 | 1313 | 1.021.02 | 33 | 2.952.95 |
| ELAIS N2 | 1116 | 0.861.25 | 22 | 1.652.43 |
2.2.2 MIPS
Using the MIPS Scan Map AOT with the medium scanning rate, each scan leg of each AOR at 70m and 24m will yield ten overlapping 4-sec exposures at each point. The scan legs are spaced by 276 arcseconds for an overlap of about 40 arcsec (four 70m pixels) between scan legs.
Each sky position is covered by two AORs, separated by hours as for IRAC to allow detection of moving or transient sources. The second coverage is offset in the cross-scan direction by 150 arcseconds, to provide additional 160m Ge:Ga array redundancy and counteract the memory effects present in the 70m Ge:Ga array.
Several AORs are required in each of the two coverages. The adjacent AORs in each coverage overlap by 70 arcseconds. This will prevent gaps if adjacent AORs are rotated by less than about 0.5 degrees relative to each other (corresponding to about a day at our high ecliptic latitudes).
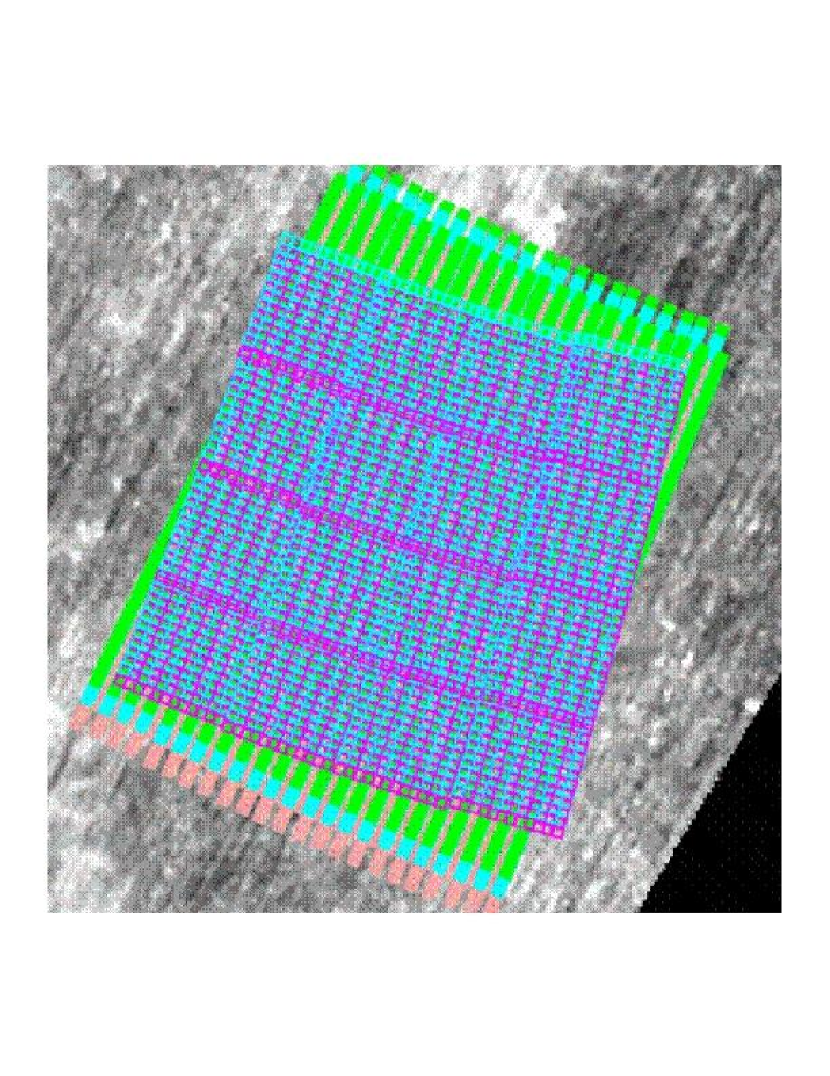
Table 6 gives details of the MIPS AORs.
| Field | #Legs | Cross-scan | #AORs | Cross-scan | Scan length |
|---|---|---|---|---|---|
| /AOR | size/AOR | /cvg | extent | ||
| deg. | deg. | deg. | |||
| ELAIS S1 | 4 | 0.32 | 12 | 3.58 | 4.0 |
| XMM-LSS | 5 | 0.39 | 8 | 3.00 | 3.0 |
| CDF-S | 4 | 0.32 | 8 | 2.38 | 3.0 |
| Lockman | 4 | 0.32 | 12 | 3.58 | 4.0 |
| Lonsdale | 6 | 0.47 | 6 | 2.68 | 2.5 |
| ELAIS N1 | 5 | 0.39 | 8 | 3.00 | 3.0 |
| ELAIS N2 | 6 | 0.47 | 4 | 1.78 | 2.5 |
2.2.3 Other considerations
Since SIRTF observes with only one instrument at a time, our IRAC and MIPS observations will be separated by several days, at least. This will result in a relative rotation of a few degrees overall between the MIPS and IRAC maps.
In the Lockman and CDF-S fields, the SWIRE observations overlap deeper GTO surveys. Our AORs will be “segmented” into smaller regions in the areas of overlap, and the resulting small AORs that overlap the GTO regions will be embargoed during the GTO proprietary period. Details of the embargoed areas are not yet available because they depend on the exactly when the SWIRE and GTO observations are made by SIRTF. When details become available, they will be provided on the SWIRE public web pages: http://www.ipac.caltech.edu/SWIRE/.
2.3 Supporting Observations and Data Sets
2.3.1 Optical & NIR Imaging
Ground-based optical/near-infrared imaging data for the SWIRE fields will be essential to:
-
1.
Obtain optical identifications for the roughly 2 million IR sources predicted to be detected by SWIRE; the present statistics on faint ISO sources in the HDFs indicates that of order of 90% of the SWIRE MIPS sources could be detected to ; at the same limits, and based on K-selected samples in the HDFN, 80% of the IRAC sources may be detected.
-
2.
Provide photometric redshifts for SWIRE sources. Three-color optical photometry will be esstential to supplement IRAC photometry for high-quality photometric redshift estimation (see Section 5.1). IRAC colors alone are powerful for stellar populations owing to the H- opacity feature at 1.6m (Simpson & Eisenhardt, 1999), however they suffer at z1.5 due to the degeneracy of the stellar population with age and confusion by the 2m CO bandheads (Sawicki, 2002). For star-forming galaxies MIPS colors are limited for photometric redshifts because there is great variation in the m SEDs of galaxies, where dust emission dominates. However three color optical, coupled with IRAC (m) photometry, yields good photometric redshift discrimination.
-
3.
Provide colors and rough morphologies for source classification and the study of the effects of environment on morphology.
-
4.
Optimize the discovery of rare sources – e.g. high z, high L, & oddball SEDs – which require good optical imaging for identification and follow-up; SWIRE has sensitivity to objects of as rare as 1 -in-106.
-
5.
Produce independent optical samples for comparison with IR-selected samples.
The original goal for optical/near-infrared ground-based imaging in the SWIRE survey fields was to obtain multi-color optical imaging (SDSS , , , or equivalent) down to the median optical magnitude () and galaxy redshift () for the entire SWIRE survey area with as much complementary near infrared () data as could be obtained. Despite extensive observational facilities available to the project at NOAO (KPNO/CTIO Mosaic Cameras, 2.1m FLAMINGOS), Palomar (LFC, WIRC), ESO (2.2m WFI, VLT VIMOS), INT (WFS), etc. as well as existing data for our ELAIS Survey fields, this goal has proven difficult to meet. Moderate depth data will be available for most of SWIRE’s 65 , with a variety of additional imaging available with other filters and to greater depths. The available and projected ground-based imaging data which will become accessible to the astronomical community is summarized by field in Table 7.
NOAO: KPNO & CTIO Mosaic Imaging
Time has been granted under the NOAO-SIRTF Observing Program through the original SWIRE Proposal for optical imaging in CDF-S, Lockman and Lonsdale using the CTIO/KPNO Mosaic Cameras. The Mosaic cameras image in a single filter with scale 0.26–0.27″/px. Imaging has been obtained to a range of depths, as summarized in Table 7.
Palomar LFC
Further imaging in Lockman and Lonsdale is being obtained at Palomar Observatory using the 5m Hale telescope and its Large Format Camera (Simcoe et al., 2000). The Palomar LFC has a field of 0.13 sq. deg. with 0.18 ″/px which may be binned to 0.36″/px for less-than-optimal seeing.
INT
A strong motivation for selecting fields from the ELAIS Survey regions was the availability of ground-based imaging data as well as the original ISO Survey observations. In particular, the ELAIS N1 and N2 fields have been imaged through the Isaac Newton Telescope’s Wide Field Survey444http://www.ast.cam.ac.uk/w̃fcsur/index.php covering nearly the entire SWIRE EN1 and EN2 fields. Details of the overlap between the INT WFS and SWIRE will depend upon SIRTF scheduling.
Further INT Wide Field Camera observations in have been undertaken by S. Oliver, E. Gonzalez, and M. Salaman at U. Sussex (ISLES program). The goal of ISLES is to ensure complete coverage of the SWIRE northern fields, with deeper imaging over smaller central fields.
ES1 - ESIS
In the ELAIS S1 field the ESIS555ESO-SIRTF wide-area Imaging Survey: (http://dipastro.pd.astro.it/esis/) program is being carried out by A. Franceschini and colleagues at the University of Padova. ESIS is an optical imaging survey over square degrees in 5 bands based on the ESO WFI 2.2m and VIMOS to mag. The total amount of observing time will be 27 nights with (2.2m WFI) and 8 nights with VIMOS.
XMM-LSS
The full XMM-Large Scale Structure Survey area is being imaged by CFHT’s MegaCam as part of the Canada-France-Hawaii Legacy Survey. Additionally, a large consortium of observatories and instruments are supporting further ground-based observations, including NOAO, Suburu, and ESO. These data will be available to the community via CFH Legacy Survey and the XMM-LSS Consortium. Their ground-based program is summarized at the XMM-LSS website 666http://vela.astro.ulg.ac.be/themes/spatial/xmm/LSS/opt_fu_e.html.
Also covering part of the SWIRE/XMM-LSS field is the NOAO Deep-Wide Survey in BRIJHK, reaching 26th magnitude in R and 21.4 in K (Jannuzi et al., 2002). Depending on orientation of the SWIRE field, the overlap will be about 2.
| Field | Telescope/Instrument | Filters & Magnitudes (Vega, 5, 3″) | Area Covered | |||||||
|---|---|---|---|---|---|---|---|---|---|---|
| J | K | [Projected]1 | ||||||||
| U∗ | B∗ | V∗ | R∗ | I∗ | Z∗ | H∗ | Ks∗ | (sq deg) | ||
| ELAIS S1 | ESO 2.2m/WFI | 26∗ | 25.5∗ | 25.5∗ | [6.25] | |||||
| ESO VLT/VIMOS | 25∗ | 24∗ | [6.25] | |||||||
| XMM-LSS | CFHT/Megacam2 | 25.5 | 26.5 | 25.7 | 25.5 | 24.0 | [64] | |||
| Palomar 5m/LFC | 25 | 0.5 | ||||||||
| UKIRT/WFCAM3 | 22.5 | 21 | [8.75] | |||||||
| CDF-S | CTIO 4m/Mosaic II | 24 | 25.7 | 25 | 24 | 23.5 | 1.6 | |||
| CTIO 4m/Mosaic II | 27∗ | 27 | 26.5 | 25.8 | 0.36 | |||||
| Las Campanas/WIRC | K′=20.5 | 0.6 [1.0] | ||||||||
| Lockman | KPNO 4m/Mosaic I | 25.7 | 25 | 24 | 2.0 | |||||
| KPNO 4m/Mosaic I | 26.7 | 26 | 25 | 0.36 | ||||||
| KPNO 2.5m/Flamingos | K′=19.5 | 0.09 | ||||||||
| Palomar 5m/LFC | 25.7 | 25 | 24 | 1.5 | ||||||
| INT/WFC (ISLES) | 23.8 | 9.2 | ||||||||
| Palomar 5m/WIRC | 21 | 20∗ | [1.0] | |||||||
| UKIRT/WFCAM3 | 22.5 | 21 | [8.75] | |||||||
| Lonsdale | KPNO 4m/Mosaic I | 25.7 | 25 | 24 | 0.7 | |||||
| INT/WFC (ISLES) | 23.8 | 6.5 | ||||||||
| ELAIS N1 | INT WFS | 23.3∗ | 24.7 | 23.8 | 23.0 | 21.7∗ | 9.04 | |||
| UKIRT/WFCAM3 | 22.5 | 21 | [8.75] | |||||||
| ELAIS N2 | INT WFS | 23.3∗ | 24.7 | 23.8 | 23.0 | 21.7∗ | 4.54 | |||
1 Based on time allocated or programs already approved
2 The CFH Legacy Survey, http://www.cfht.hawaii.edu/Science/CFHLS/
(AB magnitudes).
3 UKIDSS
4 Overlap between SWIRE area and INT fields depends on field orientation.
2.3.2 Near-Infrared Imaging
FLAMINGOS imaging of the SWIRE Lockman Field in using the KPNO 2.1m telescope was obtained in 2001 Dec and 2002 February. Poor weather restricted observations to a total of 8 pointings of 0.09 sq deg (0.6″pixels) to a limiting magnitude . Deeper near-infrared observations in the Lockman Field were carried out in February 2003 using the Cornell Wide-field InfraRed Camera on the 5m telescope at Palomar, by G. Stacey et al..
A survey is being conducted by A. Cimatti in ELAIS-S1 to J=22 and K=20 over 1 using the ESO 3.5m NTT/SOFI. Approximately half of the observations have been carried out with the remainder to be completed by the end of 2003.
The 2MASS survey covers the entire SWIRE survey area. In the SWIRE Lockman Hole field a unique 2MASS deep survey exists (Beichman et al., 2003). 1 magnitude deeper than the main 2MASS survey, the 24 area overlaps most of the planned SWIRE Lockman Hole field (dependent on the final orientation of the SWIRE/SIRTF observation), and includes 69,115 sources to 90-95% completeness levels of 17.8, 16.5 & 16.0 at J, H & Ks.
A UK Consortium — The UKIRT Infrared Deep Sky Survey777UKIDSS: http://www.ukidss.org/ is planning to observe 8.75 sq deg in each of three SWIRE Fields as part of their Deep Extragalactic Survey. Using UKIRT’s Wide Field Infrared Camera (WFCAM; 0.19 sq deg FOV, 0.4″/px), UKIDSS will begin by covering approximately 3 sq deg in each of Lockman, XMM-LSS and EN1 to J=22.5 and K=21 in the first 2 years. Subsequent observations will complete the J and K imaging over 8.75 sq deg and will image a smaller area to H22. WFCAM is due to be commissioned in late 2003 and the UKIDSS Deep Extragalactic Survey will require 118 nights over 7 years.
2.3.3 Optical & NIR Data Processing
The bulk of the new imaging data reduction has been or is being carried out at the Cambridge (UK) Astronomical Survey Unit via their image reduction pipeline, led by M. Irwin. The ELAIS N1 and N2 INT data have been fully processed at CASU. KPNO, CTIO and Palomar observations of SWIRE’s CDF-S, Lockman and Lonsdale Fields are also being carried out through the CASU pipeline under supervision of M. Rowan-Robinson and colleagues at Imperial College.
ESO observations by the Padova group and INT observations by the Sussex group are being reduced by the groups themselves.
Source extraction for all optical and & NIR imaging is being undertaken in a uniform manner at IPAC, using SExtractor (Bertin & Arnouts, 1996), and following the procedures described for SWIRE/IRAC data processing and validation. Details will be provided in a forthcoming publication.
2.3.4 ISO Mid-IR Surveys in the ELAIS Fields
Roughly 4 square degrees in each of the ELAIS N1, N2 and S1 fields have been observed with the Infrared Space Observatory at 15 and 90m (Oliver et al., 2000). Lari et al. (2001); Vaccari et al. (2003) report 2000 catalogued 15m sources in these areas. These samples appear to be complete for fluxes brighter than mJy and include sources down to 0.8mJy. Though much shallower than the planned SWIRE observations, these data may prove useful to complement the SWIRE photometry between 8 and 24m.
2.3.5 A Deep Radio Survey in the Lockman Hole
We have conducted an ultradeep A/C/D-array VLA imaging survey at 20cm, centered at 10h46m, +59d01m, and reaching 3Jy rms (Owen et al., 2003), which matches the deepest ever VLA imaging. This field was picked to be the best place in the entire 65 sq degree SIRTF SWIRE Legacy survey for such a deep survey, with respect to elevation, & brighter radio sources in the primary beam and sidelobes. The goal is to determine if and how the radio-FIR relation evolves with redshift (Compton losses might be expected to increase with z, for example), whether AGNs and star formation are more closely connected at higher z, and to identify populations of heavily obscured AGN. The radio image is extremely well matched in depth to SWIRE; we expect to detect 90% of the SWIRE population and to measure evolution of the star formation rate out to z=1-3 with a sensitivity equivalent to 10M⊙/yr at z1 and 200M⊙/yr at z3 (if the local radio/IR correlation holds). This radio survey is not in the same location as previous ROSAT, ISO, SCUBA, Chandra and XMM surveys in the Lockman Hole area because those fields are not as optimal for deep radio imaging (see Table 3).
2.3.6 Broader Radio Imaging
It would be highly desirable to image the SWIRE area deeply in the radio but impractical with current VLA capabilities to match SWIRE depth over an appreciable fraction of the VLA-accessible SWIRE areas, a total of about 43. However a VLA survey with FWHM resolution and Jy rms noise at 1.4 GHz could yield a complete catalog of radio sources stronger than Jy. This is substantially deeper than the FIRST survey and would detect of order 13% of the SWIRE MIPS sources, about 14,600 in total, according to the models of Xu et al. (2003). Most of these sources would be star-forming galaxies obeying the remarkably tight FIR/radio correlation, and the sample would also include many radio loud AGN. The FIRST survey itself overlaps 34 of the SWIRE area (Lockman, Lonsdale, ELAIS-N1 and ELAIS N2), and might be expected to detect 850 SWIRE sources. For comparison Ivezic et al. (2002) estimate about 1350 SDSS-FIRST sources within the boundaries of the SWIRE fields, about 200 of which are radio-loud quasars.
Gruppioni et al. (1999) have observed 4 of the ELAIS S1 field with the Australia Telescope Compact Array at 1.4GHz, to a sensitivity of 80Jy and with a resolution of 815 arcsec, detecting about 600 sources.
Cohen et al. (2003) present results of a VLA A-array 74MHz survey of the entire XMM/LSS field, including the subset to be observed by SWIRE, with a flux limits of 275mJy/beam, resolution of 30′′, and a source density of 2/. They also present 325MHz VLA A-array imaging of 5.6 to 4mJy/beam with a resolution of 6.3, and a source density of 46/ (see Table 3).
2.3.7 X-ray Imaging
The XMM-LSS survey will have a sensitivity of 3 for point sources, and for extended sources, in the [0.5-2] keV band. The SWIRE area will be covered by 99 10ks XMM/EPIC pointings separated by 20. Also within the SWIRE/XMM-LSS field are (a) the Subaru/XMM-Newton Deep Survey (see Table 3), which covers 1 with 750ks pointings and one 100ks pointing (Mizumoto et al., 2003), and (b) most of two XMM medium depth surveys (P.I.s K. Mason and M. Watson), which cover a total of 2 with a mean exposure time of 20ks.
A mosaic of 4 deep (100 ksec) integrations with XMM-Newton (P.I. Fabrizio Fiore) has been approved in AO2 to cover 1 in ELAIS-S1. With this survey, flux limits of 210-15, 310-15, and 310-16 will be reached in the 2-10, 5-10, and 0.5-2 keV bands, respectively.
3 Sky Simulations
Simulations are used extensively by SWIRE, both for predicting the SWIRE source populations and thereby constraining the cosmological models once the data are available, and to validate the SWIRE pipeline data reduction and source extraction process, which is complex and involves numerous non-linear components. Understanding the behavior of this pipeline can only be accomplished by generating simulated datasets with known inputs, and examining the resulting output. Metrics examined include the completeness and reliability of extracted sources, accuracy of bandmerging of multiple wavelengths, effective beamshape, and accuracy of derived positions.
The sky simulations have three ingredients: model source populations, truth images reflecting the expected band-dependent instrumental PSFs, and full image reconstructions taking into account the observing parameters of the SWIRE survey and the expected instrumental effects. We describe each step in turn below.
The SWIRE sky simulator can generate images with a range of tunable parameters. Here we describe a simulation which is tuned to a specific 0.50.5 SWIRE field in the Lockman Hole. It has three model components, galaxies, stars and cirrus, which are described in turn below The model star and galaxy source populations were derived from the actual positions of real stars and galaxies detected within this field in an 26.7 image. Source extractions were done using SExtractor, and stars were separated from galaxies using a stellarity index (a measure of difference in FWHM from the PSF) of 0.7. A model star or galaxy was matched to each real source by magnitude, and model sources predicted to have an r′ magnitude too faint to be visible on the image were assigned a random position within the image.
3.1 Source Populations
Both dusty galaxies and E/S0s, the latter to be detected presumably only in the IRAC bands, have been simulated using the models of Xu et al. (2003). Models S1, S2 & S3 for dusty galaxies exploit a large library of Spectral Energy Distributions (SEDs) of 837 local IR galaxies (IRAS 25 selected) from the UV (700Å) to the radio (20cm), including ISO-measured 3–13 unidentified broad-band features (UIBs). The basic assumption is that the local correlation between SEDs and Mid-Infrared (MIR) luminosities can be applied to earlier epochs of the Universe. By attaching an SED appropriately drawn from the SED library to every source predicted according to the evolved luminosity functions, the algorithm enables the comparisons with surveys in a wide range of wavebands simultaneously. Therefore the model parameters are tightly constrained by available surveys in the literature. Three populations of dusty galaxies are considered in the model: (1) normal late-type galaxies, (2) starburst galaxies, and (3) AGNs, each with a different evolutionary function. In models S1 & S3 most of the increase in IR luminosity density to early times is attributed to starbursts, while in S2 a large fraction is attributed instead to quiescent star formation in galaxy disks, or “cirrus” emission. The predictions of these models for the global star formation rate as a function of redshift are compared with observations in Figure 9 of Xu et al. (2003). All models adequately fit all available optical, near- mid- & far-IR, submm and radio number counts, redshift distributions and the CIB, though each has its shortcomings (Xu et al., 2003). We have chosen model S3 as the best overall representation of the IR Universe for most of our predictions discussed in Section 6, but we used model S1, which has the highest FIR count rates of the three models, for constructing the simulated images in order to provide a conservative upper limit to the confusion noise we will likely encounter on the sky.
Model E2, for E/S0 galaxies, follows a simple passive evolution approach. The basic assumption is that there has been no star formation in an E/S0 galaxy since its initial formation. Consequently, its radiation in different bands (i.e. the SED and the L/M ratio) evolves passively with the ever-aging stellar population. Instead of assuming that all E/S0’s formed at once together (as in the classical monolithic galaxy formation scenario), the E/S0 galaxies are assumed to form in a broad redshift range. The dependence of the formation rate of E/S0 galaxies to the cosmic time is assumed to be a truncated Gaussian function, specified by a peak formation redshift , an e-folding formation time scale Gyr, and a starting redshift . SEDs of E/S0s of different ages are calculated using the code GRASIL (Silva et al., 1998). Note that this model is intended to roughly approximate the hierarchical merging of systems in a CDM prescription but should not be considered a full CDM treatment; an independent modeling effort addresses SWIRE predictions in a CDM-based scenario (Fang et al., 2003).
In Figure 8 predicted redshift distributions in 6 SWIRE/SIRTF bands models are presented. Color-color distributions are shown in Figure 9. For these figures we use the SWIRE 5 photometric sensitivity limits for 3.6-24m, and the confusion limits of the Rowan-Robinson (2001) model at 70 and 160m (see Table 4).
The stars in the SWIRE simulation are based on point sources (stellarity0.7) identified in the Lockman -band image. The distribution of spectral types and luminosities for the simulated stars was generated using a 2MASS stellar population model developed by T. Jarrett (Jarrett, Dickman & Herbst, 1994; Cambresy et al., 2002). Once assignments of spectral class were made, the K-band brightness of the star was calculated using the -K vs. spectral and luminosity class from the model. Finally, stellar fluxes in the IRAC and MIPS filters were predicted using a blackbody extrapolation from K-band to the mid- and-far-IR bands.
To properly assess the impact of cirrus on our observations we have simulated the cirrus in each of the SWIRE fields. To do this we add synthetic cirrus at a higher resolution to the real low-resolution cirrus maps that we have from IRAS. The synthetic cirrus is cloned from real low-resolution maps of a larger area of sky and “shrunk” to our field size and resolution requirement. The cloning, shrinking and adding the synthetic data to the real data is done to produce a map whose power spectrum matches an extrapolation of the real power spectrum. This method is described in more detail by Oliver et al. (2003).
3.2 Truth & Simulated Images
The truth-image generator uses the instrument point spread function (PSF), provided by the SIRTF Science Center, to place sources from a model, such as that described above, onto a “truth” image. The PSFs are theoretical PSFs based on the measured, as-built SIRTF optical train, including all expected optical aberrations, and are expected to be very similar to the in-flight performance. They are quantized with pixels typically 4-8x smaller than the actual instrument pixels and extend to many 10s of beamwidths. There is no time-dependence, but unlike HST (which has sun-induced ”breathing” modes) there is no a priori expected time variance to the SIRTF PSF. The truth-image generator can create random positions when they are missing in the source list, as is the case for model sources faiter than the r′ limit of the Lockman field image. For galaxies correlated positions can also be made based on a predicted 2-point angular correlation function.
In the simulation of the Lockman field illustrated in Figures 4 and 5, the optical detections of stars and galaxies in a 0.25 square deg area were matched in r-band flux with model sources to yield 36,271 galaxies and 1356 stars with positions and IRAC and MIPS fluxes. The truth-image generator also generated 292,746 random positions for fainter “un-matched” galaxies from the model. The truth image pixels are upsampled by a factor of 4 in each dimension, giving pixel sizes of 0.30 for IRAC, and 0.64, 2.46, and 4.00 for MIPS 24, 70, and 160m truth images, respectively. The instrument PSF was further upsampled so that a source is placeable to 1/8 of the truth image pixel, or 1/32 of the instrument pixel in both dimensions. For computing efficiency the central 1/8 of the PSF image is used for sources fainter than 1mJy. The separate cirrus frames are then combined to yield the final truth images. The total number of model sources in the simulation that we would expect to detect in one or more SWIRE bands is 24,500 (5 photometric sensitivity at 3.6-24m; confusion limits at 70 and 160m).
The IRAC simulated images, calibrated in units of surface brightness, were generated from the truth images using the IRAC Science Data Simulator (Ashby et al., 2003). The command files produced by SPOT, the SIRTF observation planning tool, were used to produce a simulation of the IRAC data-taking process, including simulated slews using the commanded pointing and all detector effects such as the flat-field response, non-linearity, etc. Generally, most simulations are generated to mimic the form of the reduced, calibrated data that will be provided by the SIRTF Science Center. In this form the simulations are individual IRAC images with the expected sensitivity and noise properties of IRAC.
The MIPS simulations were made with a modified version of the WIRE science image simulator (Shupe et al., 1996). Owing to the complex behavior of the Ge detectors and the onboard data-taking procedures, our simulation efforts have focused on producing the basic calibrated images, in units of surface brightness. Read noise and photon noise are simulated, and the simulated pixels are scanned across the truth images in the manner planned for MIPS scan maps.
4 Data Processing and Products
4.1 Data Processing
SWIRE data processing consists primarily of five steps: organizing and tracking the data, mosaicing/coaddition, source extraction, bandmerging, and catalog building. The SWIRE data system is designed under a Sun UNIX environment. As much as possible, existing off-the-shelf software has been used to reduce development time and costs and take advantage of well-understood software properties and community support. Architecturally, the software consists of individual modules executable from a UNIX command line and connected via PERL wrapper scripts. Additional PERL modules perform various housekeeping functions such as file transfer and reformatting. Commercial database software administrated by the Infrared Science Archive (IRSA) at IPAC is used for tracking each individual observation. Furthermore, the generated data products such as source catalogs are loaded into a database which is accessible from the IRSA data system, allowing use of their advanced search and data mining tools. A web-based interface is used for most functions that require interaction with the SWIRE science team.
After receipt from the Deep Space Network, the SIRTF Science Center (SSC) performs an initial processing of the data. Automated pipelines remove nearly all known instrumental signatures from the data. These include but are not limited to: dark current subtraction, flat-fielding, bias removal, cosmic ray detection, and image latent tracking. Additionally, the SSC performs basic calibration tasks, notably flux calibration (in units of surface brightness) and pointing reconstruction. The result of this processing is known as “Basic Calibrated Data”, or BCD. It is with this data that the SWIRE pipelines normally begin their processing.
Data (both raw instrumental data and calibrated data) are initially received in the SWIRE data system in a tar bundle sent by the SIRTF Science Center. A daemon process running within the data system automatically unpacks this data upon its arrival and stores it in a terabyte disk array. The data is registered by the daemon into a science operations database (SODB), which stores its location within the system, its header contents, its current processing status, and various statistics about the pixel contents. If needed, frame-level reprocessing of the raw data into calibrated data, using the SSC pipeline within the SWIRE system, is performed. This reprocessing is likely to be needed during the early mission when the instrument calibration is changing rapidly. Later in the mission when the calibration and data reduction have stabilized this will become unnecessary. Web pages are automatically generated which present thumbnail images and statistics for every image received, along with direct access to the original images and on-line analysis tools. Team members are then contacted via an automated system to perform quality analysis checking from their remote institutions. The team members connect to the SWIRE server, examine the data, and submit an evaluation of the data quality. Data quality is assessed by both qualitative and quantitative guidelines. A set of basic quantitative statistics are used to provide a lower level of basic data rejection. In addition to these quantitative pass/fail criteria, all the data is examined by eye for unknown or unanticipated defects (for example, unexpected time-variability). When such a defect is found it is handled on a case-by-case basis. When sufficient data graded of high quality has accumulated for a given SWIRE field, SWIRE pipeline processing is initiated.
The individual frames are then processed in groups, with corrections made to individual frames based on the behavior of the data group. This allows for correction of time-dependent effects, such as drifts in the background bias level, which is a known effect in IRAC data. This is also expected to be a major step in the processing of MIPS data, as the MIPS germanium detectors exhibit numerous transient effects. In essence, this step will result in destriping of the data and elimination of large-scale detector-based variability.
At this point the data are still in the form of individual images, one per telescope pointing. The data will be reprojected onto a common TAN-TAN spatial projection (one per each of the seven SWIRE fields). At the same time detector distortion is corrected. Reprojection is done via the Montage software888Montage (http://montage.ipac.caltech.edu) is an image mosaic service under development by the Center for Advanced Computing Research, California Institute of Technology, the Infrared Processing and Analysis Center, California Institute of Technology and the Jet Propulsion Laboratory. The images presented here were derived with an evaluation version of Montage..
Pre-defined tiles one-half degree on a side are then generated by coadding all of the reprojected data lying within the specified tile. Outlier detection (e.g. cosmic rays) is performed by examining the contribution from each input pixel to a given output pixel and identifying high sigma outliers. The data are then coadded using Montage onto a reprojected grid finer than the original data scale to minimize aliasing with the large detector pixels. Coverage maps for 1 sq. deg. IRAC and MIPS mosaics are shown in Figure 6.
After coaddition, sources are detected in the coadded and mosaicked tiles. Source densities are expected to be of the order 100 sources per 5 arcminutes frame in our densest IRAC filter (3.6 m). This source density is similar to or less than the confusion limit. For this data we are using the SExtractor software written by Emmanuel Bertin. This reads the coadded data and weight images generated during the mosaicing process, detects sources, and performs aperture and isophotal photometry. For objects identified as point sources, extracted circular aperture photometry is used, to which is applied an aperture correction based on the accurately known point response function for the instrument. For sources identified as extended, isophotal magnitudes are used. IRAC data is expected to have a spatial resolution of 1–2˝, sufficient that many SWIRE galaxies will be slightly extended. In the case of MIPS, the large SIRTF beam (45″at 160m) ensures that all extragalactic targets will be point sources. Additionally, because of the large beam and SIRTF’s great sensitivity, nearly all of the MIPS data will suffer significantly from source confusion. In this case point source fitting is a more optimal extraction approach than aperture photometry, and so either DAOPHOT and the SSC’s APEX extraction software are under investigation.
Moving targets will be identified by multi-epoch iteration of the SWIRE coaddition and source extraction pipeline. The data itself are taken in multiple passes separated by a time period optimized for asteroid detection. A post-processor will sort out all non-repeating targets by location, and then locate probable matches based on magnitudes and assumptions about target velocities. Lists will be compiled both of non-repeating (transient) targets as well as moving targets.
The resulting lists of source fluxes and positions are then bandmerged into catalogs which consist of a single source position and fluxes (or upper limits) in each of the SIRTF bands, based on source positions and their associated uncertainties, using the SSC pipeline bandmerge module, which is based on that by the 2MASS project. For all sources in a given wavelength source list a most likely counterpart is identified in adjacent wavelengths. Chains of associations are then generated and resolved. Bandmerging of IRAC data is expected to be relatively straightforward due to the accurate SIRTF positions and the relatively small IRAC beam. Bandmerging of MIPS data will be more problematic because this data suffers from a large beamsize, resulting in significant source confusion, and also spans a much larger range in wavelength and therefore a wider range in possible spectral energy distributions. The process is being optimized using extensive simulations with a wide range of known SED shapes. Initially, only the data taken with a given instrument will be bandmerged, with bandmerging between the instruments to follow later. We are also investigating more sophisticated bandmerging techniques based on the coaddition of multi-wavelength images (eg. Szalay, Connolly & Szokoly (1999)).
Details of this data processing, along with expected performance including an analysis of the completeness and reliability of extracted sources, will follow in an additional paper.
4.2 Data Products and Delivery Schedule
The SWIRE SIRTF data will be archived and served to the community by the SIRTF Science Center, and the SWIRE ancillary data will be archived and served to the community by the InfraRed Science Archive, IRSA, at IPAC. Access to the two different data sets via these different archives will be seamless from the perspective of the user. In addition to the ancillary data described in Section 2.3, the SWIRE/IRSA data archive will provide cross-links to data in the major large area catalogs and data holdings, including 2MASS, ROSAT, SDSS, FIRST, NVSS, NED & SIMBAD.
The SIRTF data products will include both processed images, subdivided into 0.5 tiles, and source catalogs. Anticipated image data volumes range from 3.3 Gbytes for ELAIS N2 to 10.6 Gbytes for Lockman and ELAIS S1, including 4 images per tile: flux image, noise image, artifact map and coverage map. The predicted catalog sizes range from about 130,000 sources in ELAIS N2, to as many 450,000 sources in Lockman & ELAIS S1. A prototype catalog data record is shown in Table 8 (subject to change).
| Parameter | # Columns | Description |
|---|---|---|
| RA, Dec & uncs. | 4 | final bandmerged position |
| flux (PSF-fit) & uncs, or limit | 14 | one per band |
| flux (aperture) & uncs, or limit | 14 | one per band |
| SNR | 7 | one per band |
| source reliability | 7 | one per band |
| bandmerge flags | 6 | one per neighboring band pair |
| confusion flags | 7 | one per band |
| cross-id links | 10 | one per catalog |
| extent flag | 7 | one per band |
| major axis | 1 | from multi-band coadd |
| minor axis | 1 | from multi-band coadd |
| position angle | 1 | from multi-band coadd |
| SED fit; best model SED | 1 | one per source |
| photometric redshift & unc. | 2 | one per source |
| coverage depth | 7 | one per band |
| Total | 96 |
Documentation describing the SWIRE data products will include an Ap. J Supplement-style paper describing the methods and results in full, metadata released with the data products, and archive help files for each catalog and each parameter.
| Product | Date |
|---|---|
| V1.0 Sky simulations | April 2003 |
| V1.0 Products: SIRTF image tiles & catalog; ancillary & pre-exisiting images & catalogs; XIDs 2 | March 2004 |
| V 2.0 Sky simulations | |
| V1.0 Data analysis tools | Sept 2004 |
| V1.0 Products: SIRTF image tiles & catalog; ancillary & pre-exisiting images & catalogs; XIDs 3 | |
| V2.0 Products: SIRTF image tiles & catalog; ancillary & pre-exisiting images & catalogs; XIDs 2 | |
| V3.0 Products: SIRTF image tiles & catalog; ancillary images & catalogs; XIDs | March 2005 |
| V1.0 Bandmerged catalog, IRAC-only and MIPS-only | |
| V4.0 Products: SIRTF image tiles & catalog; ancillary images & catalogs; XIDs | Sept 2005 |
| V2.0 Bandmerged catalog, including IRAC-MIPS | |
| V1.0 Lower SNR source release with validation analysis & flags | |
| V1.0 Moving object catalog, pending resources | |
| V1.0 Selection function (coverage maps convolved with final noise maps) | |
| V3.0 Sky simulations | |
| V5.0 Data products: final astrometry, bandmerging, confusion processing using cross-band information | Sept 2006 |
| V5.0 XIDs between all V5.0 data products | |
| V4.0 Science simulations for fully developed science models |
1 Subject to revision due to launch date or unanticipated on-orbit variances. 2 SWIRE fields delivered to team by Oct 2003. Best efforts only on MIPS Ge. 3 Remaining SWIRE fields.
The SWIRE data product delivery schedule is detailed in Table 9. The releases occur at bi-yearly intervals, beginning about 11 months after SIRTF launch. Successive deliveries will steadily expand the products with respect to increased area coverage, refinement of data processing techniques and improvement of the ensuing data products, decreasing SNR levels while maintaining high levels of completeness and reliability of the source extractions (C&R), validation to increasing levels of accuracy, and cross-matching to increasing numbers of bands and other catalogs.
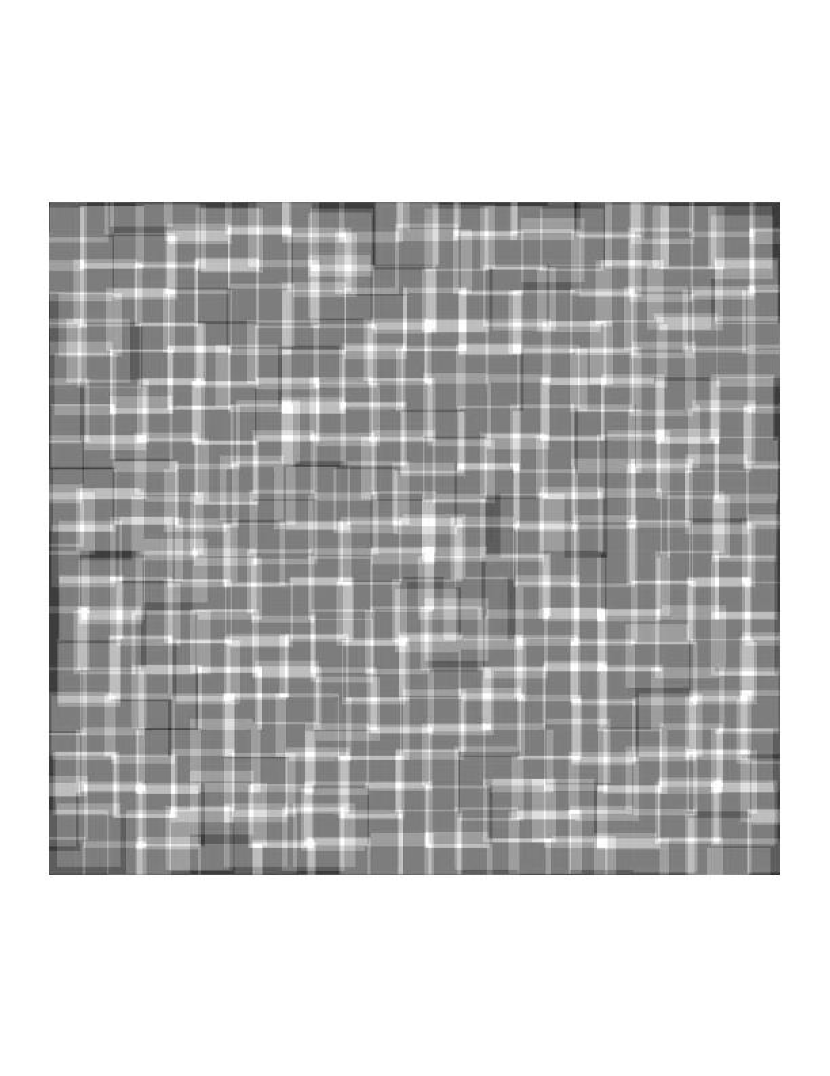
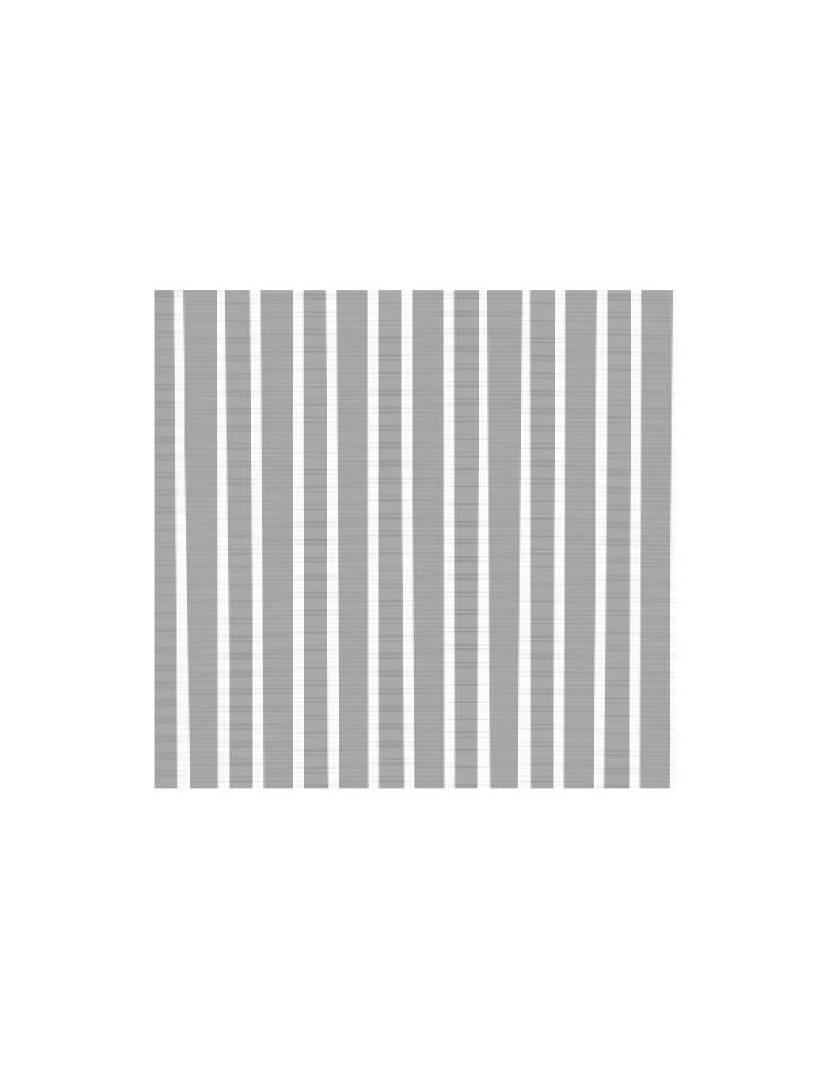
5 Photometric Redshifts and Source Characterization
SWIRE science goals depend strongly on accurate redshift estimates and source classification from our Optical-IRAC-MIPS photometry. To complement SIRTF observations in the IR (3.6–160m), it is our goal to have optical (-band) observations for the whole sample; additional optical, near-IR, radio and X-ray observations will be accessible for a sub-sample to allow detailed source characterization for representative populations.
5.1 Photometric Redshifts
By combining optical ground-based data with SIRTF data we will be able to determine photometric redshifts for large samples of SWIRE sources, as well as to determine key parameters characterizing their infrared emission. The approach is based on the photometric codes of Rowan-Robinson (2002), which fit a set of 6 optical sed templates for normal galaxies, with the option to determine the extinction . This code has been tested on available photometric catalogues in HDF-N and HDF-S and gives robust estimates of redshift accurate to 10 in (1+z). The incidence of aliasing has been shown to be smaller than most other photometric redshift estimation codes. For application to SIRTF data additional cirrus, starburst, and AGN dust torus components have been incorporated. An optical AGN accretion disk SED is also an option and this is being tested against SLOAN quasar catalogues.
The code has been run on pre-launch optical data prepared for SWIRE. Where 4 or more optical bands are available, redshifts are demonstrated to be reliable at the 98 level (i.e. no significant alias). Where only 3 optical bands are available the reliability drops to 70. Where UV data are available, an important bi-product is the star-formation rate in the galaxy. An optical SED-type is also determined. Provided at least 4 bands are available an estimate of is made. [An intercomparison of photometric redshift codes is being carried out by members of the SWIRE team and will be reported in a future publication.
The majority of SWIRE galaxies are expected to be detected in the IRAC bands, especially the 3.6 and 4.5 m bands. Since little contribution from dust emission is expected at the shorter IRAC wavelengths, IRAC photometry can be used to improve photometric redshift estimates for systems with multi-band optical data. For systems with only imaging, approximate photometric redshifts may be obtained from R-IRAC photometry alone. A bonus is that an estimate of the total stellar mass in the galaxy can then be made for galaxies with IRAC detection, at least at low redshifts. Where galaxies are detected at 4.5, 5.8 and 8 m an estimate can also be made of the luminosity in the cirrus component, after subtraction of the predicted stellar contribution. The ratio of to, say, should be related to the value.
If there are also detections at 24m and beyond, estimates can be made of the luminosity in the starburst and AGN dust torus components. We describe the procedures we are further developing to address these questions in more detail in the next section. There are insufficient SIRTF bands for accurate photometric estimates of redshifts to be made from SIRTF data alone, given the presence of several components with distinct spectral signatures in the mid- and fir-IR, and the large observed dispersion of dust temperatures found in ULIRGs (Blain et al., 2003; Farrah et al., 2003).
The above procedure has been prototyped against (1) IRAS galaxy samples, and (2) simulated SWIRE data generated by C.K.Xu. The IRAS data is at different wavelengths from SIRTF and the galaxies tend to be at low redshift ( 0.3), but the code does succesfully recover both the redshifts and the different SED components. The simulated data is, of course, highly dependent on the model assumptions, which are slightly different from those used in the deconvolution. The results of the simulations are again satisfactory.
In conclusion, depending on the number of detected bands, we expect to be able to output z, , , , , , , , for large samples of SWIRE galaxies, which will be powerful diagnostics of galaxy evolution.
5.2 SEDs and Source Characterization
In addition to photometric redshift determination we are developing methods to classify SWIRE sources based on the optical-radio spectral energy distributions (SED) in order to distinguish the main emitting components (starburst, AGN) and the contribution of the stellar population. Our method is similar to the template fitting technique applied to estimate photometric redshifts, (Bolzonella, Miralles & Pelló, 2000). This methods relies on the identification of spectral features strong enough to be preserved after the integration of the spectrum through the filter transmission curves. Emission lines can be useful if they are strong enough relative to the continuum flux to be detectable within the broad-band photometry. For objects with featureless spectra, the success of template fitting depends on the extent to which there exist unique continuum spectral shapes for source populations.
The far- (60-1000 m), mid- (6-60 m) and near- (1-6 m) IR spectra of galaxies are characterized by different complexity and show distinct emitting components. The far-IR spectrum is featureless thermal radiation emitted by dust associated to an AGN or a starburst or the galaxy disc with temperatures ranging from a few tens to a few hundreds degrees Kelvin. The mid-IR spectrum is significantly more complex because of the variety of the emitting components: photo-dissociation regions (PDRs), HII regions (Tran, 1998) and AGN-heated dust. Star-forming systems are dominated by the unidentified infrared bands (UIB), which are produced in the PDRs at the interface between HII regions and molecular clouds. Very small grains associated to HII regions produce a more intense and steeper continuum at 12m (Cesarsky et al., 1996; Verstraete et al., 1996; Roelfsema et al., 1996). The prominence of this component depends largely on the relative intensity of the UV radiation field of the galaxy. The spectrum of an AGN may show UIB features from star-forming regions or from the host galaxy disc (Mirabel et al., 1999; Clavel et al., 2000; Moorwood, 1999; Alexander et al., 1999), but they are usually weaker than in starburst galaxies because of dilution from the strong continuum emitted by AGN-heated dust. The near-IR spectra of galaxies are dominated by stellar photospheric radiation. The stellar contribution can vary in galaxies with different star formation rates and stellar populations. The warm dust continuum is very faint at 7m (Cesarsky et al., 1996; Verstraete et al., 1996; Tran, 1998), and is not generally detected in starbursts where the PDR emission (i.e., the UIB features) dominates (Sturm et al., 2000). Emission from AGN-heated dust can also contribute to flattening of the spectrum. If an AGN component or an extremely young (1 Myr) stellar population does not dominate in the near-IR, a prominent feature at 1.6m appears in the near-IR spectrum of galaxies, caused by the minimum in the opacity of the H- ion present in the atmosphere of cool stars (John, 1988).
In general, a starburst can be identified by strong PAHs, faint emission in the NIR and cool MIR colors (F(60m)/F(25m)5) and an AGN by weak PAHs, strong NIR continuum and warm MIR colors (F(60m)/F(25m)5). However, these spectral differences between an AGN and a starburst are not always so distinctive. A significant continuum at short wavelengths (5-8 m) is not necessarily a tracer of an AGN, but could reveal a higher emission from H II regions in the ISM with respect to PDRs (see e.g. some dwarf metal-deficient starburst galaxies like NGC 5253 and IIZw40 (Rigopoulou et al., 1999)). Moreover, strong PAHs can also be observed in type-2 AGNs where the hot dust continuum is absorbed by material along the line of sight (Clavel et al., 2000).
This variety of IR spectra makes any source characterization based on colors alone problematic. Our method is based on matching all observed data of SWIRE sources with templates representative of the known galaxy population. Existing template libraries derived from observed SED (Coleman, Wu & Weedman, 1980) or from models (Bruzual & Charlot, 1993; Fioc & Rocca-Volmerange, 1997; Leitherer et al., 1999; Silva et al., 1998; Devriendt, Guiderdoni & Sadat, 1999) either do not contain templates for AGN, do not include dust emission, or do not extend behind NIR wavelengths. Regrouping the available models of a few galaxies obtained using different methods (Papovich & Bell, 2002) produces a heterogeneous sample which will not be representative of the full observed palette of IR spectra in SWIRE.
In order to create a complete, representative library of galaxy templates, we characterized the dispersion of galaxy IR spectra and then selected objects with well sampled SED that could describe the observed variety of IR spectra. The optical-radio SEDs of 837 objects from the IRAS 25m sample (Xu et al., 2001) and the ISO PHT-S and -L (Kessler et al., 1996) NIR SEDs of a sample of 175 normal and active galaxies (N Lu, private communication) were analyzed in order to select SEDs which span the full range of galaxy characteristics. The final catalogue contains 37 SEDs with redshift from 0.0007 to 0.08 and two objects at redshift 1.06 and 1.44. In the optical and NIR, each SED was modeled using a spectrophotometric synthesis code (Berta et al., 2003a, b; Fritz, J., et al., 2003) derived from the spectral synthesis program by Poggianti et al. (2001). In the MIR we adopted the observed spectrum between 2.4 and 11 m observed with ISO PHT-S and -L and the SEDs as modeled by Xu et al. (2001) at longer wavelengths. Templates for quasars were derived by combining composite optical spectra from the FIRST Bright Quasar Survey999http://sundog.stsci.edu/first/QSO/Composites/ (Brotherton et al., 2001) and the observed spectrum of a red quasar (Gregg et al., 2002) with ISO PHT-S and PHT-L NIR SEDs and photometric data in the IR of quasars with optical SEDs well-fitted by the composite spectra. The library contains templates for ellipticals, spirals, irregulars, starburst, ULIRGs and active galaxies covering the wavelength range between 300Å and 20. All the current templates are shown in Figure 7.
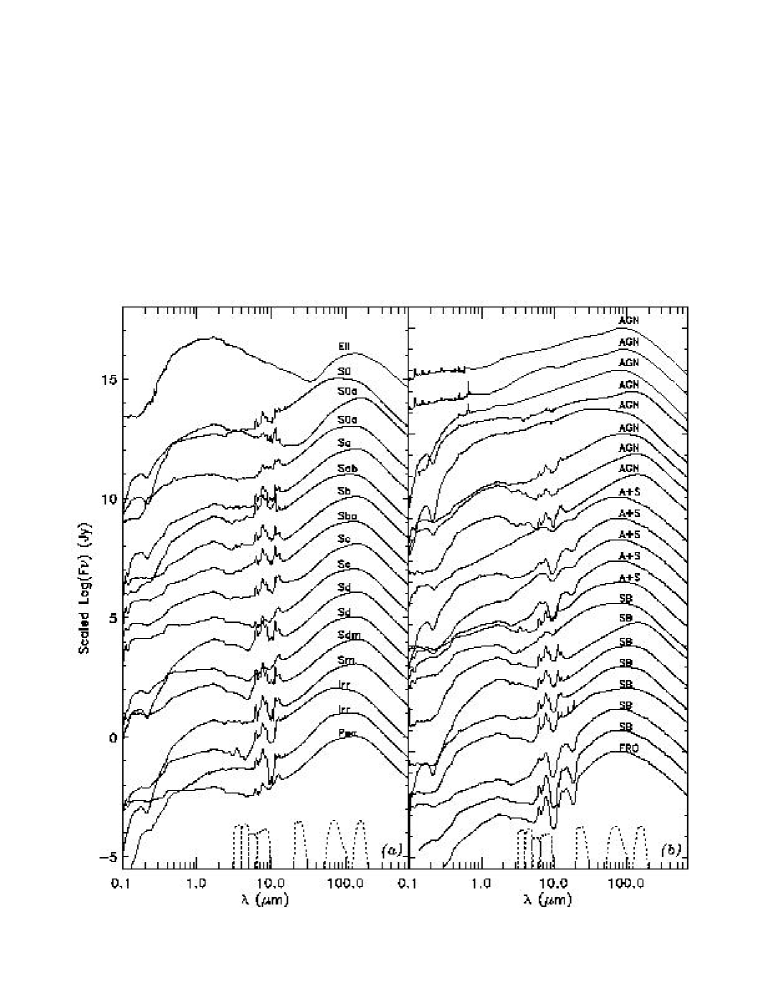
The completeness of the current library is being tested using multicolor photometric catalogues of galaxies at low and high redshifts with different sets of filters and selection effects, like the catalogues of the HDFN (Fernández-Soto et al., 2001) and of CDF-S (Barger et al., 2002), the quasars observed with ISO (Polletta et al., 2000; Haas et al., 2000; Andreani et al., 2003; Kuraszkiewicz et al., 2003), the CfA Seyfert sample (Pérez García & Rodríguez Espinosa, 2001), ULIRG samples (Klaas et al., 2001; Farrah et al., 2003), and the IRAS 25m sample (Shupe et al., 1998; Xu et al., 2001). New templates will be added to represent observed SEDs that are not fitted by the current templates. Our library contains mostly SED of local galaxies and only two high- objects. Distant galaxies likely differ from local galaxies in their IR SED (Xu et al., 2001; Dole et al., 2003) and therefore new templates may be added to the existing library to represent the high redshift galaxy population when more knowledge about this population is available.
The bulk of SWIRE sources will be detected only at shorter wavelengths (IRAC). Thus, full coverage of galaxies IR SEDs with accurate photometry may only be possible for relatively nearby or bright objects. Therefore, the limitations of our method are being investigated on simulated catalogues with solely IRAC data or IRAC plus one optical band. In particular the degeneracy between redshift, dust temperature, age, and extinction are under study.
Our galaxy template library provides a tool to investigate which colors can be used to distinguish different types of objects. Sawicki (2002) claims that SIRTF NIR data alone should be sufficient to identify most galaxies at 1.5 that are dominated by stellar populations older than 20 Myr through the 1.6m bump. Galaxies at lower redshifts or those dominated by very young stellar populations suffer from severe degeneracies and their SEDs can be fitted if either IR observations at shorter wavelengths or optical data are included. The color analysis cannot provide an accurate source classification for the entire SWIRE sample because of the degeneracies among different objects. However, some objects have unique colors and can be easily identified: (1) ULIRGs can often be identified through the 70/8m ratio; (2) type-1 AGN with 0.11.6 using the IRAC 5.8m/IRAC 3.8m ratio; and (3) and objects like Mrk231, a type-1 AGN and ULIRG using the blueness of the IRAC or optical-IRAC colors. The FIR color F(70m)/F(160m) can provide estimates of the FIR luminosity (L), depending on how well the correlation observed for local galaxies holds for galaxies up to redshift 3 (Chapman et al., 2003a; Blain et al., 2003). The optical/IR flux ratio may also work well as a luminoisty estimator; see Figure 10b.
Additional tools to characterize SWIRE sources will be provided by the morphological analysis in optical images and by X-ray data. Optical imaging will provide morphological information about the objects that can be used to distinguish spheroids from disk galaxies and identify mergers. X-ray emission is a good tracer of AGN even if starforming galaxies can also emit X-rays through X-ray binaries, supernovæ and hot diffuse gas. However, the X-ray emission of starburst galaxies is fainter and softer than the AGN X-ray emission.
The final library of galaxy templates with data and spectral models, the method for SWIRE source classification and the tests on existing photometric catalogue will be published in a separate paper.
6 Early Science with SWIRE
Since SWIRE is a homogenous, multi-wavelength survey covering a large area of sky and producing several million sources, the science possibilities with it are enormous. In this section we very briefly outline the main science topics that the SWIRE team plans to address initially.
6.1 Modes and Rates of Star Formation
As described in Section 1, a fundamental question for galaxy evolution is the relative importance of quiescent star formation vs. starbursts as a function of epoch and matter density/environment. SWIRE will directly measure the mid- to far-IR SEDs of 100,000 IR-luminous galaxies. The expected SWIRE source detection statistics are summarised in Figure 8, which shows results for two contrasting phenomenological models from Xu et al. (2003) and Rowan-Robinson (2001), (see Section 4.1.1). Model S3 of Xu et al. (2003) is dominated by starbursts at high redshift, while Rowan-Robinson (2001) attributes more sources to cooler, disk-dominated galaxies.
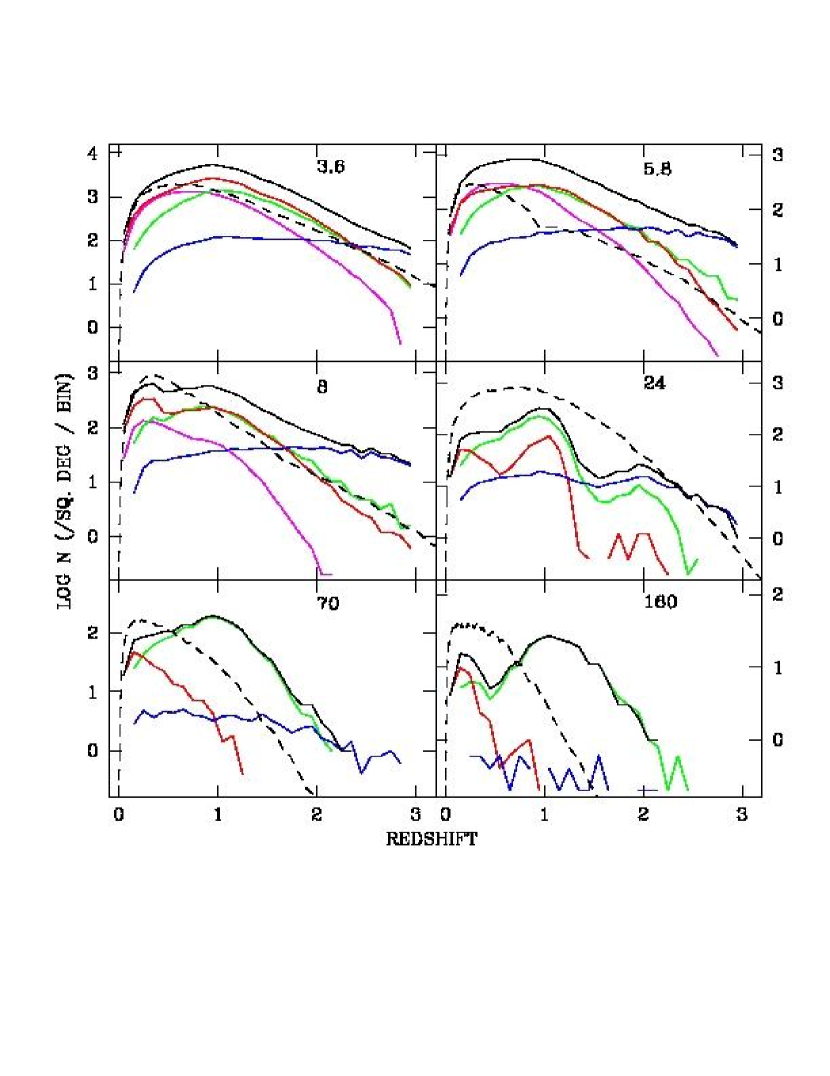
The 70m band will sample the broad peak of typical dust temperature components (35K) out to redshifts of about 0.5, and warmer ones (70K) to redshifts about 1, while the less sensitive 160m band can sample the most luminous sources in these temperature ranges to redshifts above 1 and 3 respectively. Over these redshift and temperature ranges the SWIRE multiwavelength SEDs will provide an accurate measurement of the bolometric luminosity of the galaxy and the dust temperature range present. Using photometric redshifts (see Section 5.1) derived from the optical/IRAC data, we will construct luminosity functions in many separate volume cells and for different dust temperature ranges. Prior to the availability of photometric redshifts, the same questions can be addressed to lesser accuracy using number/color/flux data, eg. Figure 9 to 10b.
Many systems will be detectable in the 8 and 24m bands to redshifts, z3, or higher, although SWIRE will not sample their IR SEDs at peak, and so will not directly determine their IR luminosities.
A primary goal of SWIRE is to determine the cause for the strong increase in the global star formation rate between z to z as measured by the IR energy density. SWIRE will focus on the nature of the most luminous sources, which seem to be much more numerous at high redshift, and which provide the most critical challenges to hierarchical models in terms of the extreme star-formation rates required at high redshift. We will address this by finding these systems (with MIPS), studying their old stellar populations (with IRAC), observing their morphologies (with the optical imaging) and determining their environments (all data). We can investigate the relative importance of quiescent star formation vs starbursts from 160/70m colors (Figure 9) and morphology, looking, for example, for large disks rather than the major mergers which dominate local ULIRGs. Quiescent, distributed star formation ocurring over galaxy disks should be cooler than nuclear starbursts, thus we can directly track these modes, and test models which attribute the high fluxes of high redshift ISO 170m and submillimeter sources to distributed “cirrus” emission (Rowan-Robinson, 2001; Efstathiou & Rowan-Robinson, 2003; Xu et al., 2003; Kaviani et al., 2003) eg. compare the models of Xu et al. (2003) and Rowan-Robinson (2001) in Figure 8, and Xu et al. (2003) model S2 in Figure 9.
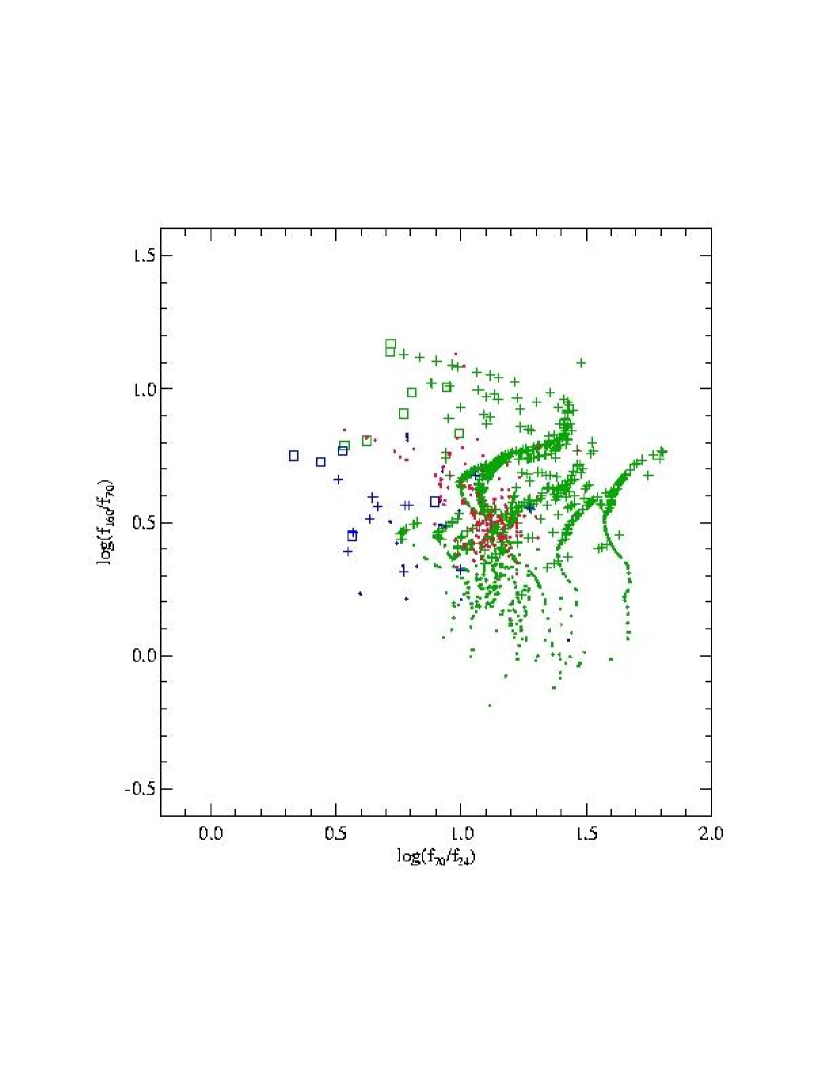
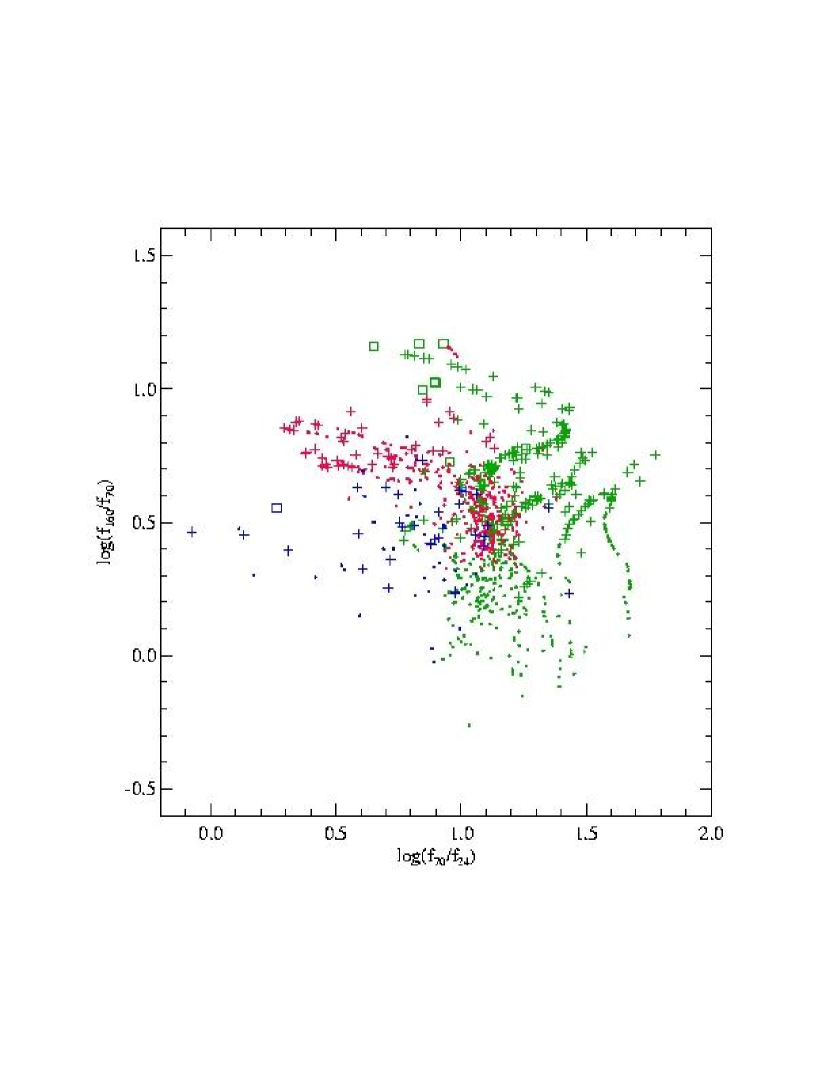
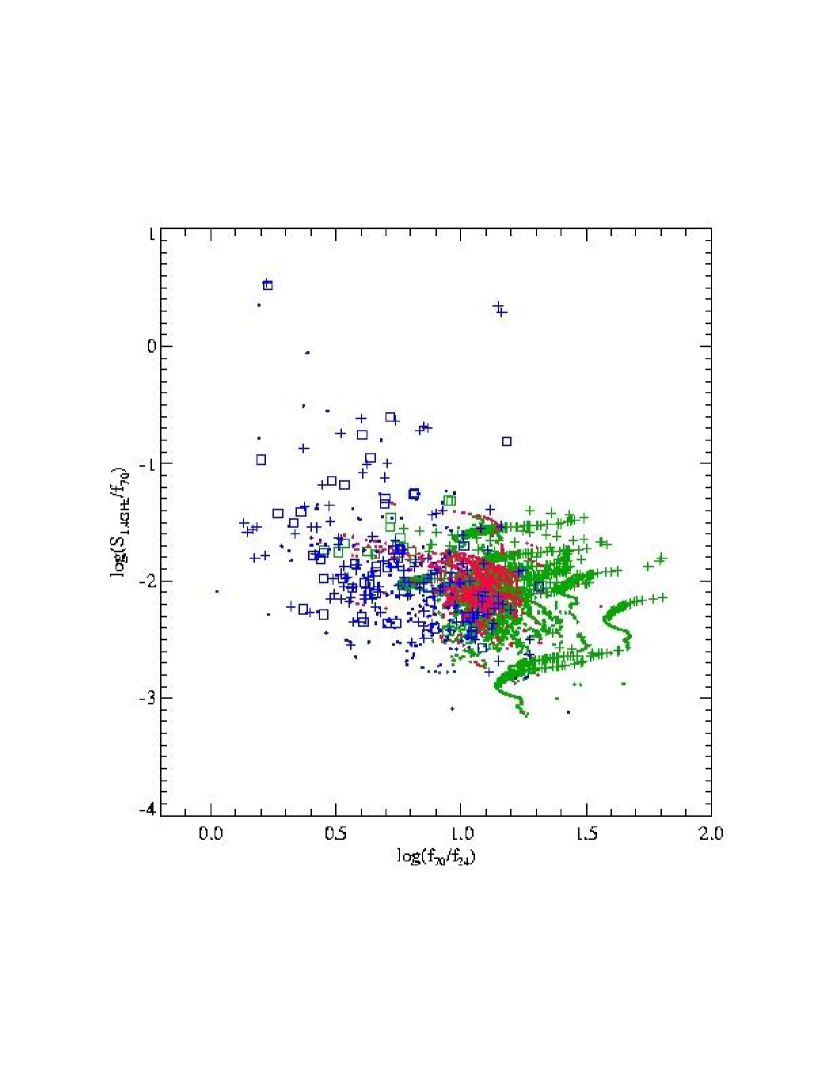
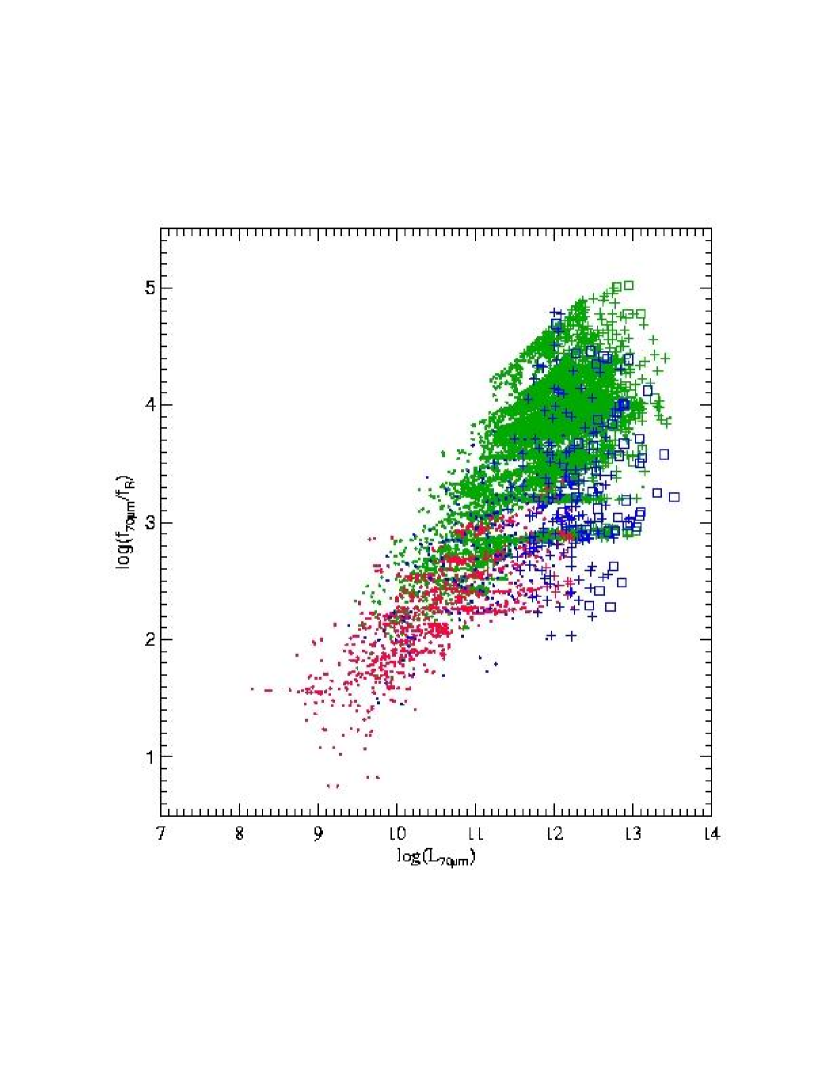
In Figure 10a we show the anticipated color distribution in the 70/24 vs. 1.4GHz/70m color-color plane for model S3 for our deep VLA field (Section 2.3.5). In this model, 90% of the SWIRE MIPS population is detected at 20cm, which will allow an interesting investigation of the radio/IR correlation at high redshifts (the model assumes no ratio evolution). Note that the very large dispersion in observed 1.4GHz/70m color is dominated by the dispersion in redshift, but also incorporates the intrinsic dispersion in the template SEDs (see Xu et al. (2003) for full details). It remains to be seen whether the local radio/IR correlation holds up at high redshifts.
Figure 10b shows the well known infrared/optical vs Lir relation from the local Universe (Soifer et al., 1989). The apparent horizontal tracks in this figure are due to individual template SEDs, which are fixed in luminosity, sampled by the model galaxy population over a range of redshifts. Whilst this “k-correction” dispersion degrades the use of this relation as a luminosity indicator at the higher luminosities, we can use it to estimate minimum luminosities, and hence a lower limit to luminosity distance using the measured flux. This technique of course assumes that the high redshift SEDs have been well represented by the model, which may not turn out to be the case.
6.2 The Mass Function of Spheroids
SWIRE will detect 1 million spheroids by the emission of evolved stars in the shorter IRAC bands, reaching z2.5 (Figure 8). The stellar mass of these systems can be estimated by SED fitting using a library of stellar population synthesis models (eg. Dickinson et al. (2003)). This method has been prototyped for SWIRE using the models of Poggianti et al. (2001) by Franceschini et al. (2003), who found fairly large uncertainties in estimated stellar masses for ISO-detected HDF galaxies when using only optical/NIR data, especially if a there exists a substantial stellar population with significant extinction. The addition of photometry in the IRAC bands will provide much greater accuracy because older populations dominate these longer wavelength bands, rendering the SEDs very uniform (Simpson & Eisenhardt, 1999; Sawicki, 2002). The longer wavelength IRAC bands also enable robust mass estimation over a much larger redshift window.
Using the SWIRE m SEDs we will assess the build-up rate of stellar mass in massive stellar systems since z2.5 and compare it directly to the global star formation rates in IR-luminous systems, for both quiescent and starburst modes, over the same redshift range. Again, the dependence of the results on the matter density field and the nearby galaxy environment will be of primary importance to constraining galaxy formation models and the cosmological model.
6.3 Active Galactic Nuclei
As described in Section 1, a major SWIRE goal is to determine the evolving number density of AGN, particularly heavily obscured ones. The difficult aspect of this goal lies in identifying the AGN, because the most heavily obscured ones can be very optically thick even in the near- and mid-IR where we expect the unique AGN identification signatures, specifically warm dust associated with the torus in the 3m range, and very red colors due to extinction in the near-IR, such as being found for moderately obscured 2MASS AGN (Lacy et al., 2001; Cutri, 2001). Our initial studies of SWIRE AGN populations will be based on identifying candidates with indicators of heavy extinction from red optical-IRAC colors, and warm dust from 3-70m colors.
The blue curves in Figure 8 illustrate the detectabilty of optically-selected AGN by SWIRE. If obscured populations such as those required to explain the slope of the XRB, increase with redshifts and are actually more numerous than low obscuration AGN by factors of up to 4, observed in the Deep Chandra Surveys (Gilli, 2002), then a substantial fraction of the SWIRE “starburst” sources (green curves) will harbor such AGN. Moreover these AGN may possibly warm the MIPS colors above those assumed in our models, which would boost the relative 24 and 8m counts still further.
Statistical studies of the starburst/AGN connection as a function of luminosity will provide major insights into how starbursts and AGN coexist and to possible evolutionary relationships. Furthermore, we can examine starburst-AGN connections as a function of redshift (thus increasing gas mass, decreasing dust content and decreasing metallicity), environment and Hubble type.
6.4 Large Scale Structure
Our first large-scale structure goal will be to provide an estimate of the clustering of both active and passive galaxies with mean redshifts higher than any substantial surveys to date, using 2-D Auto-correlation functions. Such measurements are expected to provide powerful constraints on models of galaxy formation.
We will measure the angular-autocorrelation functions of the SWIRE galaxies selected in each of the seven SIRTF bands, comparing each of these seven auto-correlation functions with predictions from existing numerical and semi-analytic models of galaxy formation and with extrapolations from existing surveys at other wavelengths and lower redshifts. Inversion techniques will provide an estimate of three dimensional clustering, against which future models can be directly compared. This will require model redshift distributions or real redshift distributions as they become available.
Other two-dimensional two-point statistics including the power spectrum and variance of counts-in-cells may also be investigated.
2-D cross-correlations can provide a better handle on the issue of galaxy bias, by allowing us to investigate the relative clustering of different sub-samples of the SWIRE populations. We will measure the angular cross-correlation between galaxy catalogues selected at different SIRTF wavelengths. Initially we will focus on comparing the IRAC and MIPS catalogues as these probe passive and active star-formation systems respectively. As our classification of galaxies on the basis of their multi-wavelength colors improves we will compare distinct populations e.g. star-burst galaxies, spheroids and AGN. Measurements of cross-clustering statistics will be compared with predictions from existing models and inversion techniques will provide estimates of three dimensional cross-clustering.
Once we have established a reasonable photometric redshift system we will be able to provide an estimation of the evolution of the clustering, independently of other low-redshift surveys, by repeating the above analyses in photometric redshift slices. We can also use these photometric redshifts to provide better estimates of three dimensional clustering without resorting to inversion techniques.
As a more subtle test of galaxy formation models we also intend to use counts-in-cells techniques to investigate the higher order statistics of galaxy clustering. We will perform two-dimensional counts-in-cells analyses on individual populations and on joint populations. We will also use photometric redshifts to take these analyses into three dimensions.
Ultimately, in collaboration with the wider astronomical community, we hope to obtain sparse redshift surveys to provide a better precision and check on our photometric redshift based studies.
6.5 Clusters in the XMM-LSS Field
A major goal for the XMM-LSS field is comparative cluster detection in terms of galaxy and cluster properties. In parallel to optical multi-color and X-ray cluster detection techniques, we shall investigate clustering methods in the SIRTF wavebands; this is a totally new approach with the potential to yield distant clusters of AGN as well. Clusters will principally be detected by late-type stellar emission of individual cluster members in the shortest IRAC bands, but at the higher redshifts star formation and AGN activity is expected to increase, detectable by dust emission in the longer SIRTF bands. We will compare cluster existence/richness/morphology derived in the different wavebands. Although these techniques provide comparable results in the local Universe, there are strong hints that the overlap between optically and X-ray selected clusters beyond z0.5 is only (Donahue et al. 2001, 2002). It is most interesting to understand this discrepancy. One possibility is that optical cluster selection is very sensitive to the star-formation rate owing to the effect on galaxy color by active star formation.
A further goal is to determine the location of the SWIRE sources within the cosmic network. Environmental studies of the XMM-LSS data (X-ray and optical) will provide a unique view of the LLS out to z1. Redshift measurements of the SWIRE sources will allow us to subsequently locate them within the cosmic network (field, filaments, groups, clusters). This will provide decisive clues as to the effect of environment on star, galaxy and AGN formation. Ultimately, one can relate environmental conditions to the initial density fluctuations from which the clusters originated. Conversely, we shall be in a position to investigate how galaxy activity affects the global properties of clusters like metallicity, temperature etc. and thus quantitatively address such questions as the effect of preheating by star formation and AGN on the intra-cluster medium. Another point will be to investigate whether star forming and nuclear activity are, as expected, most efficient in medium dense environments (i.e. groups), since in these regions, galaxy velocities are moderate, thus optimal for efficient interactions.
A third study will use clusters as gravitational telescopes to flag and study very distant SWIRE sources. Weak lensing studies using the Canada-France-Hawaii Legacy Survey data on the most massive X-ray detected clusters will offer a truly new window to the distant Universe and we expect as well several SWIRE sources per cluster to be the magnified images of very distant (obscured?) objects. We shall thus gather a sample of several tens of pencil beam surveys, providing a statistical complement to the study undertaken by GOODS and, in addition, less affected by possible instrumental confusion effects.
6.6 Mergers, Environment & Morphological Evolution
SWIRE will provide a unique window into the development of the Hubble sequence by providing true AGN and starburst luminosities associated with merger-driven events and other environmental factors such as cluster-cluster mergers, over large co-moving size scales at z1-2. Moreover, the depth and angular resolution (particularly at IRAC wavelengths) of the SIRTF observations will be very high for local objects. For these we can address the detailed structural relationships between the optical/near-IR/submm structure and the mid-IR structure in a wide variety of galaxies.
A few of the planned follow-up projects for the SWIRE data include pointed high resolution optical imaging of ULIRGs at medium and high redshift, adaptive optics surveys of galaxies lying in the SWIRE fields, a study of optically identified interacting galaxies using the SWIRE optical and infrared data, a high resolution submm study of SWIRE interacting, infrared luminous galaxies, optical asymmetries in UV vs. IR-selected galaxies, the star formation rate as a function of environmental richness, and an unbiased high spatial resolution optical survey of a large fraction of a SWIRE field.
6.7 Rare Objects
A major strength of SWIRE is the large cosmological volume available to it, therefore the sample will contain unusual objects of up to 1-in-106 rarity, to redshifts 3. These will include both object types we already know about such as Extremely Red Objects (EROs), Lyman Break Galaxies (LBGs), distant ULIRGs such as discovered by SCUBA, powerful QSOs & radio galaxies, and brown dwarfs. We may also anticipate previously unknown categories of objects that SWIRE may select in favor of, such as galaxies with unusually warm mid-IR colors. The individual objects will be extremely interesting in their own right, and also as elements in the major science themes discussed in previous sections. For example, very distant and luminous ULIRGs and AGN detected at 8 &/or 24m will be used as potential tracers of massive halos. A major goal is to measure the mid- and far-IR luminosity distributions of LBG candidates (Siana et al., 2002).
Rare object candidates will be selected by their flux-color signatures in the multi-wavelength SWIRE databases and followed-up extensively, both on the ground and with SIRTF deeper imaging and IRS spectroscopy (beginning with a small GTO IRS program to follow up 6 SWIRE sources in CDF-S; M. Werner, PI).
6.8 Nearby Galaxies
The large area of the SWIRE survey, together with SIRTF higher sensitivity and better angular resolution than previous IR space telescopes allow us and the community to undertake a number of investigations of galaxies in the local Universe. Galaxies with diameters larger than 10″ will be spatially resolved by SIRTF in the IRAC bands, and those larger than 15″ also in the 24m MIPS band. The largest of the nearby galaxies present in the survey area could also be resolved at 70 and 160m. The SIRTF Legacy project SINGS, (SIRTF Nearby Galaxy Survey, Kennicutt et al. (2003)) is designed to study the physics of the star-forming ISM and galaxy evolution by a comprehensive imaging and spectroscopic study of 75 nearby galaxies (D30 Mpc). SWIRE will extend some of these investigations to a larger sample of galaxies at larger redshifts and in very different galaxy environments, including isolated galaxies, interacting galaxies, groups and clusters.
We have defined a protoype SWIRE nearby galaxy sample from the 2MASS final-reduced database, searching in the SWIRE areas for objects with isophotal diameter at 2.2m (the 2MASS band closest in wavelength to the IRAC spectral range) greater than 10″. The sample consists of several hundred galaxies with angular diameters up to 100″. A small number of galaxies are contained in the 2MASS Large Galaxy Atlas (Jarrett et al., 2003). One of the largest is NGC 5777 in the Lonsdale field, which is illustrated in Figure 11. Most of the galaxies with a published redshift are at z0.1.
The SIRTF broad-band images, combined with data at other wavelengths (eg. UV imaging from GALEX) will allow us to study in detail the physics of star formation as a function of location on the galaxy, ISM properties, galaxy morphological and spectral type and galaxy environment, particularly for objects of relatively low IR luminosities, which will not be detectable at higher redshift. The sample will also be used to construct composite SEDs for different galaxy types which will be useful to interpret the SEDs of more distant objects.
6.9 Brown Dwarfs
During the past few years, a large number of very low mass stars and substellar objects (”L” dwarfs) have been discovered, primarily in the near-infrared 2MASS and DENIS surveys (Oppenheimer et al., 2000) and more recently in the SDSS (Geballe et al., 2002). These objects lie below the M dwarfs in effective temperature and are primarily distinguished by their very red JHK colors. However, even cooler objects, designated ”methane or T dwarfs” (Burgasser et al., 2002), are more difficult to find in these near-IR surveys, since their methane bands give them a blue color shared by many ordinary disk stars. The IRAC 3.6/4.5 micron bands are ideal for identification of T dwarfs. The 3.6 micron channel encompasses a major methane band, while the 4.5 micron channel samples the SED peak for these cool sources. Thus, the F4.5-F3.6 color should easily pick out nearby T dwarf candidates in our source list. SWIRE will provide the best SIRTF Legacy database for serendipitous brown dwarf discoveries due to its wide area coverage and high sensitivity. SWIRE will have sufficient 4.5 µm sensitivity and areal coverage to potentially detect very low mass old brown dwarfs in the field. Comparing the SWIRE sensitivities (Table 4) to the predicted fluxes for old BD from Burrows et al. (1997), we find that SWIRE could detect a 5 Gyr old, 275 K brown dwarf at a distance of 10 pc at 4.5 µm.
We simulated the detectability of field brown dwarfs in the SWIRE legacy survey using a Monte Carlo model similar to Martín et al. (2001), who estimated brown dwarf number counts for a range of IRAC survey sizes and sensitivities. Fluxes in the four IRAC bandpasses were tabulated vs. effective temperatures using the online models of Marley. Teff vs. mass and age was taken from evolutionary models by A. Burrows. Brown dwarf initial mass functions with various power law indices were simulated, with total counts normalized to the adopted stellar space density of 0.057 pc-3 (Reid et al., 1999). A star formation rate proportional to [1-exp(-t/)exp(-t/)] was used, with and Gyrs. Random masses, ages, and X, Y, Z coordinates within a sun-centered cubical volume were then used as inputs to the evolution and mid-IR flux models, which were interpolated to give the observables. For 1.5, 1.0, and 0.5, the model predicts SWIRE detection of 23, 8, and 1 objects respectively in IRAC channel 2 (4.5 m).
6.10 Circumstellar Debris Disks
Among the most important questions in astronomy today are the frequency of extrasolar planetary systems and their similarity to our own solar system. SIRTF’s extremely high sensitivity at long wavelengths enables investigation of circumstellar disks which are plausible signposts of debris from planet formation. Disks similar to the one observed around HR 4796A (Koerner et al., 1998) show excess emission from dust at wavelengths beyond 8m with a steep rise between 24 and 70m, ideal for study with MIPS. IRAS detected debris disks around massive stars at distances of tens of parsecs. SIRTF will be able to detect much more tenuous disks around solar-type stars out to 100 pc and analogs of HR4796A (A0 star) at a kiloparsec. Even considering the high galactic latitudes of our survey fields, we expect to detect the photospheres of at least 1000 A - K spectral type stars at 24m. The frequency of dust excess among stars in the solar neighborhood is at least 15% (Lagrange et al. (2000), PPIV), so we would plausibly expect to discover of order 150 new debris disk systems during our MIPS surveys. Unlike the other SIRTF legacy debris disk searches, SWIRE will have no age or spectral type bias in its survey of debris disks.
6.11 Small Asteroids
Current knowledge of the asteroid size-frequency distribution is limited to sizes larger than about 10 km. The population of small asteroids is almost completely uncharacterized, but is critical for understanding the parent population of the Earth-crossing asteroids (Evans et al., 1998). SIRTF will be sensitive to thermal emission at 8 and 24m from main belt asteroids as small as 1 km. Estimates of the number of asteroids in SIRTF 5’ x 5’ images at ecliptic latitude 0∘ range over at least an order of magnitude. Although most of our survey fields are located at high ecliptic latitude, the XMM-LSS (10 sq. deg.) field is at 17∘ latitude. We will repeat the MIPS scans across this field at an interval of several hours, allowing us to identify asteroids and to estimate their mean motion.
References
- Alexander et al. (1999) Alexander, D. M., et al. 1999, MNRAS, 310, 78
- Alexander et al. (2001) Alexander, D. M., et al. 2001, ApJ, 554, 18
- Almaini et al. (2003) Almaini, O., et al. 2003, MNRAS, 338, 303
- Andreani et al. (2003) Andreani, P., Cristiani, S., Grazian, A., LaFranca, F., & Goldschmidt, P. 2003, AJ, 125, 444
- Archibald et al. (2002) Archibald, E., Dunlop, J., Jiminez, R., Friaca, A., McClure, R., Hughes, D. 2002, MNRAS, 336, 353
- Ashby et al. (2003) Ashby, M., Surace, J., & Hora, J. 2003, in Infrared Telescopes and Instruments, SPIE, in press
- Babul & Postman (1990) Babul, A. & Postman, M. 1990, ApJ, 359, 280
- Barger et al. (2002) Barger, A. J., et al. 2002, AJ, 124, 1839
- Beichman et al. (2003) Beichman, C.A., Cutri, R., Jarrett, T.J., Steining, R. & Skrutskie, M. 2003, ApJ, in press
- Benson et al. (2001) Benson, A. J., Frenk C. S., Baugh C. M., Cole S., & Lacey C. G., 2001, MNRAS, 327, 1041
- Berta et al. (2003a) Berta, S., et al. 2003a, A&A, submitted
- Berta et al. (2003b) Berta, S., et al. 2003b, in preparation
- Bertin & Arnouts (1996) Bertin, E. & Arnouts, S. 1996, A&A Suppl., 117, 393
- Blain et al. (1999) Blain, A., et al. 1999, MNRAS, 309, 715
- Blain et al. (2002) Blain, A. W., Smail, I., Ivison, R.I., Kneib, J.-P., & Frayer, D.T. 2002, Physics Reports, 369, 111
- Blain et al. (2003) Blain, A.W., Barnard, V.E. & Chapman, S. C. 2003, MNRAS, 338, 733
- Blanton et al. (2000) Blanton, M., Cen, R., Ostriker, J. P., Strauss, M. A., & Tegmark, M. 2000, ApJ, 531, 1
- Bolzonella, Miralles & Pelló (2000) Bolzonella, M., Miralles J.-M. & Pelló R. 2000, A&A, 363, 476
- Brotherton et al. (2001) Brotherton, M., Tran, H., Gregg, M., Becker, R., Laurent-Meuhleisen, S. & White, R. 2001, ApJ, 546, 775
- Bruzual & Charlot (1993) Bruzual, G. A. & Charlot S. 1993, ApJ, 405, 538
- Burgasser et al. (2002) Burgasser, A., et al. 2002, ApJ, 564, 421
- Burrows et al. (1997) Burrows, A., et al. 1997, ApJ, 491, 856
- Cambresy et al. (2002) Cambresy, L., Beichman, C., Jarrett, T., & Cutri, R. M. 2002, AJ, 123, 2559
- Cesarsky et al. (1996) Cesarsky, D., et al. 1996, A&A, 315, L309
- Chapman et al. (2003a) Chapman, S., Helou, G., Lewis, G., & Dale, D. 2003a, ApJ, in press (astro-ph/0301233)
- Chapman et al. (2003b) Chapman, S., Blain, A., Ivison, R., & Smail, I. 2003b, Nature, 422, 1540
- Chary & Elbaz (2001) Chary, R. & Elbaz D. 2001, ApJ, 556, 562
- Ciliegi et al. (2003) Ciliegi, P., Zamorani, G., Hasinger, G., Lehmann, I, Szokoly. G & Wilson, G. 2003, A&A, 398, 901
- Clavel et al. (2000) Clavel, J. , et al. 2000, A&A, 357, 839
- Cohen et al. (2003) Cohen, A. S., et al. 2003, ApJ, in press (astro-ph/0303419)
- Cole et al. (2000) Cole, S., Lacey, C. Baugh, C., & Frenk, C. 2000, MNRAS, 319, 168
- Coleman, Wu & Weedman (1980) Coleman, G. D., Wu C.-C. & Weedman D. W. 1980, ApJS, 43, 393
- Colless et al. (2001) Colless, M., et al. 2001, MNRAS, 328 1039
- Comastri et al. (2001) Comastri, A., Fiore, F., Vignali, C., Matt, G., Perola, G., & La Franca, F. 2001, MNRAS, 327, 781
- Condon et al. (1998) Condon, J. J., et al. 1998, in Observational Cosmology with the New Radio Surveys, ed. M. N. Bremer et al. (Kluwer: Dordrecht), p37
- Conselice (2003) Conselice, C. 2003, in Galaxy Dynamics, ed. C. Boily, P. Patsis, C. Theis, S. PortegiesZwart, R. Spurzem, (EDP Sciences), in press (astro-ph/0212468)
- Cutri (2001) Cutri, R. 2001, in AGN Surveys, ed. R. Green, E Kachikian, & D. Sanders, (ASP:San Francisco), p5.
- Dekel (1994) Dekel, A. 1994, ARA&A, 32, 371
- de Ruiter et al. (1997) de Ruiter, H. R., et al. 1997, A&A, 319. 7
- Devriendt, Guiderdoni & Sadat (1999) Devriendt, J.E.G., Guiderdoni, B., & Sadat R. 1999, A&A, 350, 381
- Devriendt & Guiderdoni (2000) Devriendt, J.E.G. & Guiderdoni, B. 2000, A&A, 363, 851
- Dickinson et al. (2003) Dickinson, M., et al., 2003, PASP, this volume
- Dickinson et al. (2003) Dickinson, M., Papovich, C., Ferguson, H., Budavari, T. 2002, ApJ, 587, 25
- Dole et al. (2003) Dole, H., Lagache, G., & Puget, J.-L. 2003, ApJ, 585, 617
- Dole et al. (2001) Dole, H., et al. 2001, A&A, 372, 364
- Donahue et al. (2001) Donahue, M., et al. 2001, ApJ, 552, 93
- Donahue et al. (2002) Donahue, M., et al. 2002, ApJ, 569, 689
- Dunlop et al. (2003) Dunlop, J., et al 2003, http://www.roe.ac.uk/shades/index.html
- Elbaz et al. (1999) Elbaz, D., et al. 1999, A&A, 351, L37
- Ellis et al. (1997) Ellis, R., et al. 1997, ApJ, 483, 582
- Efstathiou & Rowan-Robinson (2003) Efstathiou, A. & Rowan-Robinson, M. 2003, MNRAS, in press (astro-ph/0304555)
- Efstathiou et al. (1990) Efstathiou, A. et al. 1990, MNRAS, 247, 10
- Evans et al. (1998) Evans, R. W., et al. 1998, Icarus, 131, 261
- Fadda et al. (2002) Fadda, D., et al. 2002, A&A, 383, 838
- Fan et al. (2003) Fan, X., et al. 2003, AJ, 125, 1649
- Fang et al. (2003) Fang, F., et al. 2003, in preparation
- Fardal et al. (2001) Fardal, M. A., Katz, N., Gardner, J., Hernquist, L., Weinberg, D., & Dave, R. 2001, ApJ, 562, 605
- Farrah et al. (2001) Farrah, D., et al. 2001, MNRAS, 326, 1333
- Farrah et al. (2002a) Farrah, D., Verma, A., Oliver, S., Rowan-Robinson, M., & McMahon, R. 2002a, MNRAS, 329, 605
- Farrah et al. (2002b) Farrah, D., Serjeant, S., Efstathiou, A., Rowan-Robinson, M., & Verma, A. 2002b, MNRAS, 335, 1163
- Farrah et al. (2003) Farrah, D., Afonso, J., Efstathiou A., Rowan-Robinson, M., Fox, M. & Clements, D. 2003, MNRAS, in press (astro-ph/0304154)
-
Fazio et al. (2003)
Fazio, G., et al. 2003, SIRTF Guaranteed Time Observation Program,
http://sirtf.caltech.edu/SSC/geninfo/gto/absabs/pid8 - Fernández-Soto et al. (2001) Fernández-Soto A., Lanzetta K., Chen H.-W., Pascarelle S., & Yahata N. 2001, ApJS, 135, 41
- Fioc & Rocca-Volmerange (1997) Fioc, M. & Rocca-Volmerange, B. 1997, A&A, 326, 950
- Fox et al. (2002) Fox, M. J., et al. 2002, MNRAS, 331, 839
- Franceschini et al. (2003) Franceschini, A., Lonsdale, C., & the SWIRE Co-Investigator Team, 2003, in The Mass of Galaxies at Low and High Redshift, p. 338
- Franceschini et al. (2003) Franceschini, A., Braito, V., & Fadda, D. 2002, MNRAS, 335, L51
- Franceschini et al. (2001) Franceschini, A., et al. 2001, A&A, 378, 1
- Fritz, J., et al. (2003) Fritz, J., et al. 2003, in preparation
- Gautier et al. (1992) Gautier, T. N., Boulanger, F., Perault, M., & Puget, J. L. 1992, AJ, 103, 1313
- Geballe et al. (2002) Geballe, T. R., et al. 2002, ApJ, 564, 466
- Giacconi et al. (2001) Giacconi, R., et al. 2001, ApJ, 551, 624
- Gilli (2002) Gilli, R. 2002 in New X-ray Results from Clusters of Galaxies & Black Holes, ed. C. Done, E.M. Puchnarewicz, & M.J. Ward, Adv. Sp. Res., in press (astro-ph/0303115)
- Gilli (2001) Gilli, R., Salvati, M., & Hasinger, G. 2001, A&A, 366, 407
- Gladders & Yee (2003) Gladders, M. & Yee, H. 2003, in preparation
- Granato et al. (2001) Granato, G., et al. 2001, MNRAS, 324, 757
- Gregg et al. (2002) Gregg, M. D., et al. 2002, ApJ, 564, 133
- Gruppioni et al. (1999) Gruppioni, C., et al. 1999, MNRAS, 305, 297
- Guiderdoni et al. (1998) Guiderdoni, B., Hivon, E., Bouchet, F. R., & Maffei, B. 1998, MNRAS, 295,877
- Haas et al. (2000) Haas, M., et al. 2000, A&A, 354, 453
- Hasinger et al. (1998) Hasinger, G., Burg, R., Giacconi, R., Schmidt, M., Trumper, J., & Zamorani, G. 1998, A&A, 329, 482
- Hasinger et al. (2001) Hasinger, G., et al. 2001, A&A, 365, 45
- Hauser & Dwek (2001) Hauser, M. G. & Dwek E. 2001, ARA&A, 39, 249
- Helou & Beichman (1990) Helou, G. & Beichman, C. 1990, in From Ground-Based to Space-Borne Sub-mm Astronomy, ESA SP-314, (Noordwijk: ESA), p 117
- Ivezic et al. (2002) Ivezic, Z., et al. 2002, AJ, 124, 2364
- Ivison et al. (2002) Ivison, R. J., et al. 2002, MNRAS, 337, 1
- Jannuzi et al. (2002) Jannuzi, B. T., Dey, A., Brown, M. J. I., Tiede, G. P., & NDWFS Team 2002, BAAS, 34, 104.01
- Jarrett, Dickman & Herbst (1994) Jarrett, T. H., Dickman, R. L. & Herbst, W. 1994, ApJ, 424, 852
- Jarrett et al. (2003) Jarrett, T. H., Chester, T., Cutri, R., Schneider, S., & Huchra, J. P. 2003, AJ, in press
- John (1988) John, T. L. 1988, A&A, 193, 189
- Kaiser (1984) Kaiser, N. 1984, ApJ, 284, L9
- Kajisawa & Yamada (2001) Kajisawa, M. & Yamada T. 2001, PASJ, 53, 833
- Kaviani et al. (2003) Kaviani, A., Haehnelt, M. & Kauffmann, G. 2003, MNRAS, 340, 739
- Kawara et al. (1998) Kawara, K., et al. 1998, A&A, 336, 9
- Kennicutt et al. (2003) Kennicutt, R. J., et al. 2003, PASP, this volume
- Kenter et al. (2002) Kenter, A., Murray, S. & Meehan, G. 2002, APRB, 17, 108
- Kepner et al. (1999) Kepner, J., Fan, X., Bahcall, N., Gunn, J., Lupton, R., & Xu, G. 1999, ApJ, 517, 78
- Kessler et al. (1996) Kessler, M. F., et al. 1996, A&A, 315, L27
- Klaas et al. (2001) Klaas, U., et al. 2001, A&A, 379, 823
- Kodama et al. (1999) Kodama, T., Bell, E. & Bower, R. 1999, MNRAS, 302, 152
- Koerner et al. (1998) Koerner, D. W., Ressler, M. E., Werner, M. W., & Backman, D. E. 1998, ApJ, 503, L83
- Kuraszkiewicz et al. (2003) Kuraszkiewicz, J. K., et al. 2003, ApJ, 590, in press (astro-ph/0302572)
- Labbe et al. (2003) Labbe, I., et al. 2003, AJ, 125, 1107
- Lacy et al. (2001) Lacy, M., Laurent-Muehleisen, S., Ridgway, S., Becker, R., & White, R. L. 2001, ApJ, 551, L17
- Lagache et al. (2003) Lagache, G., Dole, H., & Puget, J-L. 2003, MNRAS, 338, 555
- Lagrange et al. (2000) Lagrange, A-M., Backman, D., Artymowicz, P. 2000, in Protostars and Planets IV, ed. V. Mannings, A. Boss, S., Russell, (Tucson:U. Arizona Space Science Series), p639
- Lahav et al. (1990) Lahav O., Nemiroff, R. J. & Piran T. 1990, ApJ, 350, 11
- Lahav et al. (2002) Lahav, O. et al. 2002, MNRAS, 333, 961
- Lari et al. (2001) Lari, C., et al. 2001, MNRAS, 325, 1173
- Leitherer et al. (1999) Leitherer, C., et al. 1999, ApJS, 123, 3
- Magorrian et al. (1998) Magorrian, J., et al. 1998, AJ, 115, 2285
- Maiolino et al. (2000) Maiolino, R., et al. 2000, Adv. Sp. Res., 25, 809
- Maiolino et al. (1998) Maiolino, R., et al. 1998, A&A, 338, 781
- Manners et al. (2003) Manners, J. C., et al. 2003, MNRAS, in press (astro-ph/0207622)
- Martín et al. (2001) Martín, E. L., et al. 2001, PASP, 113, 529
- Menanteau et al. (1999) Menanteau, F., et al. 1999, MNRAS, 309, 208
- Mirabel et al. (1999) Mirabel, I. F., et al. 1999, A&A, 341, 667
- Mizumoto et al. (2003) Mizumoto, Y., et al. 2003, http://www.naoj.org/staff/chris/SXDS/
- Moorwood (1999) Moorwood, A. F. M. 1999, in The Universe as seen by ISO, ed. P. Cox & M. Kessler, ESA SP-427 (Noordwijk: ESA), p825
- Norberg et al. (2002) Norberg, P., et al. 2002, MNRAS, 332, 827
- Oliver et al. (1996) Oliver, S., et al. 1996, MNRAS, 280, 673
- Oliver et al. (2000) Oliver, S., et al. 2000, MNRAS, 316, 749
- Oliver et al. (2003) Oliver, S., et al. 2003, in preparation
- Owen et al. (2003) Owen, F., et al. 2003, in preparation
- Oppenheimer et al. (2000) Oppenheimer, B. R., Kulkarni, S. R., & Stauffer, J. R. 2000, in Protostars and Planets IV, ed. V. Mannings, A. Boss, S., Russell, (Tucson:U. Arizona Space Science Series), p639
- Papovich & Bell (2002) Papovich, C. & Bell E. F. 2002, ApJ, 579, 1
- Pearce et al. (2001) Pearce et al. 2001, MNRAS, 326, 649
- Pérez García & Rodríguez Espinosa (2001) Pérez García, A. M. & Rodríguez Espinosa, J. M. 2001, ApJ, 557, 39
- Phillips et al. (2001) Phillips, J., et al. 2001, ApJ, 560, 15
- Pierre et al. (2002) Pierre, M., Valtchanov, I. & Refregier, A. 2002, in New Visions of the X-Ray Universe, in press (astro-ph/0202117)
- Pierre et al. (2003) Pierre M., et al. 2003 A&A, in preparation
- Polletta et al. (2003) Polletta, M., Lonsdale, C. J., Xu, C. K. & Wilkes, B. J. 2003, ApJ, submitted
- Polletta et al. (2000) Polletta, M., Courvoisier, T. J.-L., Hooper, E. J. D., & Wilkes, B. J. 2000, A&A, 362, 75
- Poggianti et al. (2001) Poggianti, B. M., Bressan, A., & Franceschini, A. 2001, ApJ, 550, 195
- Priddey & McMahon (2001) Priddey, R. & McMahon, R. 2001, MNRAS, 324, L17
- Reid et al. (1999) Reid, I. N., et al. 1999, ApJ, 521, 613
-
Rieke et al. (2003)
Rieke, G., et al. 2003, SIRTF Guaranteed Time Observation Program,
http://sirtf.caltech.edu/SSC/geninfo/gto/abs/pid81 - Rigopoulou et al. (1999) Rigopoulou, D., Spoon, H., Genzel, R., Lutz, D., Moorwood, A., & Tran, Q. 1999, AJ, 118, 2625
- Rodighiero et al. (2003) Rodighiero, G., Fadda, D., Alessandra, G., Lari, C., & Franceschini, A. 2003, in Exploiting the ISO Data Archive: Infrared Astronomy in the Internet Age, ESA SP-511 (Noordwijk: ESA), in press
- Roelfsema et al. (1996) Roelfsema, P. R., et al. 1996, A&A, 315, L289
- Rosati et al. (2002) Rosati, P., et al. 2002, ApJ, 566, 667
- Rowan-Robinson et al. (1997) Rowan-Robinson, M., et al. 1997, MNRAS, 289, 490
- Rowan-Robinson et al. (2000) Rowan-Robinson, M., et al. 2000 MNRAS, 314, 375
- Rowan-Robinson (2001) Rowan-Robinson, M. 2001, ApJ, 549, 745
- Rowan-Robinson (2002) Rowan-Robinson, M. 2003, MNRAS, submitted
- Rowan-Robinson et al. (2003) Rowan-Robinson, M., et al. 2003, in preparation
- Saunders et al. (1991) Saunders, W., Frenk, C., Rowan-Robinson, M., Lawrence, A., & Efstathiou, G. 1991 Nature, 349, 32
- Saunders et al. (2000) Saunders, W., et al. 2000 MNRAS, 317, 55
- Sawicki (2002) Sawicki, M. 2002, AJ, 124, 3050
- Schlegel et al. (1998) Schlegel D. J., Finkbeiner D. P. & Davis M., 1998 ApJ, 500 525
- Schreier et al. (2001) Schreier, E. J., et al. 2001, ApJ, 560, 127
- Scott et al. (2002) Scott, S., et al. 2002, MNRAS, 331, 817
- Shupe et al. (1998) Shupe, D. L., Fang, F., Hacking, P.B., & Huchra, J.P. 1998, ApJ, 501, 597
- Shupe et al. (1996) Shupe, D., Huber, A. K., & Hacking, P. 1996, SPIE Proceedings 2817, Infrared Spaceborne Remote Sensing IV, ed. M. Scholl & B. Andresen, p1057
- Siana et al. (2002) Siana, B., Smith, H. E., Lonsdale, C. J., & The SWIRE Team 2002, BAAS, 34, 1195
- Silk & Rees (1998) Silk J. & Rees, M. 1998, A&A, 331, L1
- Silva et al. (1998) Silva L., Granato G. L., Bressan A., & Danese L. 1998, ApJ, 509, 103
- Simcoe et al. (2000) Simcoe R. A., et al. 2000, AAS, 196, 5209
- Simpson & Eisenhardt (1999) Simpson, C. & Eisenhardt, P. 1999, PASP, 111, 691
- Soifer et al. (1989) Soifer, B. T., Boehmer, L., Neugebauer, G., & Sanders, D. 1989, AJ, 98, 766
- Somerville et al. (2001) Somerville R., Lemson G., Sigad Y., Dekel A., Kauffmann G., & White S., 2001, MNRAS, 320, 289
- Somerville (2003) Somerville, R. S. 2003, private communication.
- Strauss & Willick (1995) Strauss M.A., & Willick, J. 1995, Physics Reports, 261, 271
- Sturm et al. (2000) Sturm, E., et al. 2000, A&A, 358, 481
- Surace et al. (2000) Surace J. A., Sanders D. B. & Evans A. S. 2000, ApJ, 529, 170
- Szalay, Connolly & Szokoly (1999) Szalay, A. S., Connolly, A. J., & Szokoly, G. P. 1999, AJ, 117, 68
- Tran (1998) Tran, D. 1998, PhD thesis, Université de Paris XI.
- Vaccari et al. (2003) Vaccari, M., et al. 2003, in preparation
- Valtchanov et al. (2003) Valtchanov, I., et al. 2003, A&A, in preparation
- Verstraete et al. (1996) Verstraete, L., Puget, J.-L., Falgarone, E., Drapatz, S., Wright, C., & Timmermann, R. 1996, A&A, 31
- Williams et al. (1996) Williams, R., et al. 1996, AJ, 112, 1335
- Willick & Strauss (1998) Willick, J. A. & Strauss, M. A. 1998, ApJ, 507, 64
- Willis et al. (2003) Willis, A. G., et al. 2003, A&A, in preparation
- Xu et al. (2001) Xu, C. K., Lonsdale, C.J., Shupe, D.L., O’Linger, J., & Masci, F. 2001, ApJ, 562, 179
- Xu et al. (2003) Xu, C. K., Lonsdale, C. J., Shupe, D. L., Franceschini, A., Martin, D., & Schiminovich, D. 2003, ApJ, 587, 90
- Yang et al. (2003) Yang, Y., Mushotsky, R., Barger, A., Cowie, L., Sanders, D. & Steffen, A. 2003, ApJ, 585, L85
- York et al. (2000) York, D. G., et al. 2000, AJ, 120 1579