Mapping Observations of DNC and HN13C in Dark Cloud Cores
Abstract
We present results of mapping observations of the DNC, HN13C, and H13CO+ lines (=1-0) toward 4 nearby dark cloud cores, TMC-1, L1512, L1544, and L63, along with observations of the DNC and HN13C lines (=2-1) toward selected positions. By use of statistical equilibrium calculations based on the LVG model, the H2 densities are derived to be (1.4-5.5)105 cm-3, and the [DNC]/[HN13C] ratios are derived to be 1.25-5.44 with a typical uncertainty by a factor of 2. The observed [DNC]/[HNC] ratios range from 0.02 to 0.09, assuming the [12C]/[13C] ratio of 60. Distributions of DNC and HN13C are generally similar to each other, whereas the distribution of H13CO+ is more extended than those of DNC and HN13C, indicating that they reside in an inner part of the cores than HCO+. The [DNC]/[HN13C] ratio is rather constant within each core, although a small systematic gradients are observed in TMC-1 and L63. Particularly, no such systematic gradient is found in L1512 and L1544, where a significant effect of depletion of molecules is reported toward the central part of the cores. This suggests that the [DNC]/[HNC] ratio would not be very sensitive to depletion factor, unlike the [DCO+]/[HCO+] ratio. On the other hand, the core to core variation of the [DNC]/[HNC] ratio, which range an order of magnitude, is more remarkable than the variation within each core. These results are interpreted qualitatively by a combination of three competing time-dependent processes; gas-phase deuterium fractionation, depletion of molecules onto grain surface, and dynamical evolution of a core.
1 Introduction
It has been recognized that the deuterium atom is fractionated into various molecules in cold interstellar clouds and the isotopic abundance ratios of the deuterated molecules relative to their normal species are as high as 10%, although the cosmic [D]/[H] ratio is only an order of 10-5 (Wilson & Rood 1994). Deuterium fractionation is thought to be caused by the following exothermic isotope-exchange reaction:
| (1) |
where HX+ represents a molecular ion such as H and H3O+ (Millar, Bennet, & Herbst 1989; Howe & Millar 1993).
Since the deuterium fractionation processes are sensitive to the physical conditions such as temperature, ionization degree, and depletion factor of molecules, deuterated molecules can be used as unique tracers to investigate physics and chemistry of dense cores in dark clouds. Survey observations of various deuterated molecules such as DCO+ (Butner, Lada, & Loren 1995), C3HD (Gerin et al. 1987; Bell et al. 1988), DC3N (Howe et al. 1994), NH2D (Saito et al. 2000; Shah & Wootten 2001), and DNC (Hirota, Ikeda, & Yamamoto 2001, hereafter Paper I) have been carried out toward a number of dense cores. Furthermore, various model calculations have been presented in order to account for the observed deuterium fractionation (Millar et al. 1989; Howe & Millar 1993; Roberts & Millar 2000). A detailed study on chemistry of deuterated molecules has recently been carried out with sensitive observations of 10 deuterated molecules as well as chemical model calculations (Turner 2001). According to these observations, deuterium fractionation of various molecules significantly varies from core to core, and also within each core, which is interpreted in terms of the difference in degree of depletion, ionization fraction, chemical bistability, and/or chemical evolution (Turner 2001 and references therein). However, detailed observations are still limited to a small number of sources such as TMC-1, L1544, and L183, and also to a few specific molecular species such as DCO+, N2D+, and NH2D.
In order to study an origin of the variation of deuterium fractionation, it is important to investigate a possible relation between deuterium fractionation and abundances of other molecules. Such a comprehensive study would constrain mechanisms of the variation more strongly. On the basis of this motivation, we carried out survey observations of DNC and HN13C toward 29 dark cloud cores, and found that deuterium fractionation of [DNC]/[HNC] (hereafter we just call DNC/HNC ratio) has a rough correlation with the NH3/CCS ratio (Paper I). Since the NH3/CCS ratio is regarded as an indicator of chemical evolution (Suzuki et al. 1992), this result suggests that deuterium fractionation reflects, at least to some extent, the chemical evolutionary stage of dark cloud cores. Particularly, a significant gradient in the DNC/HNC ratio is seen along the ridge of TMC-1, which also shows the correlation with the NH3/CCS ratio. Saito et al. (2002) also pointed out the gradient in the DCO+/HCO+ ratio along the TMC-1 ridge, suggesting that it originates from the chemical evolutionary effect on the basis of chemical model calculations.
Now it is of particular importance to study whether deuterium fractionation varies within a dense core, as observed in TMC-1, or not. With this in mind, we have carried out mapping observations of the =1-0 lines of DNC, HN13C, and H13CO+ toward 4 nearby dark cloud cores, TMC-1, L1512, L1544, and L63. Furthermore, we have also conducted observations of the =2-1 lines of DNC and HN13C toward selected positions to derive their column densities and H2 densities accurately. A related study for another dark cloud core, L1521E, has already been reported by Hirota, Ito, & Yamamoto (2002).
2 Observations
Mapping observations of the DNC, HN13C, and H13CO+ lines (=1-0) were made in several observing sessions from 1997 to 1999 with the 45 m radio telescope at Nobeyama Radio Observatory111Nobeyama Radio Observatory (NRO) is a branch of the National Astronomical Observatory of Japan, an interuniversity research institute operated by the Ministry of Education, Culture, Sports, Science and Technology of Japan. Their rest frequencies, dipole moments, and intrinsic line strengths are summarized in Table 1. The beam sizes (HPBW) were 20″ and 17″ for the 76 GHz and 87 GHz regions, respectively. We used SIS mixer receivers whose system temperatures were typically 300 K (SSB) including atmospheric attenuation. Toward L1512 and L63, the spectra of DNC, HN13C, and H13CO+ were simultaneously observed with two different receivers by using a polarization beam splitter; one receiver was used for DNC (76 GHz), and the other for HN13C and H13CO+ (87 GHz). The relative pointing error between these two receivers was less than 1″. Toward TMC-1 and L1544, the HN13C and H13CO+ lines were observed simultaneously with the two receivers, while the DNC line was observed separately with only one receiver. The main beam brightness temperature is determined by dividing the observed antenna temperature by the main beam efficiency, , which was provided by the observatory to be 0.5 in the 76-87 GHz region. Acousto-optical radio spectrometers were used for the backend. The spectral resolution was 37 kHz, which corresponds to velocity resolutions of 0.15 km s-1 and 0.13 km s-1 in the 76 GHz and 87 GHz regions, respectively. Pointing was checked by observing nearby SiO maser sources every 1-2 hours, and the pointing accuracy was estimated to be better than 5″ (rms). All the observations were performed with the position-switching mode, in which a typical off position was 10′ away from the source position.
We observed 4 dark cloud cores, TMC-1, L1512, and L1544 in the Taurus region and L63 in the Ophiuchus region, as summarized in Table 2. The reference positions were taken from Suzuki et al. (1992) and Benson & Myers (1989) for TMC-1 and other cores, respectively. Note that the reference position for L1544 listed in Table 2 is shifted by (-27″,64″) from that commonly used, which is determined by the high-resolution observation of dust continuum emission (e.g. Ward-Thompson et al. 1994). The grid spacing (20″-60″) in the mapping observations was larger than the beam size, and hence, maps are undersampled. The on-source integration time ranged from 120 to 360 seconds for each position, and the rms noise temperature ranged from 0.14 to 0.25 K in the scale.
In addition, the =2-1 lines of DNC and HN13C were observed toward selected positions with the NRAO 12 m telescope222The National Radio Astronomy Observatory (NRAO) is a facility of the National Science Foundation, operated under cooperative agreement by Associated Universities, Inc. at Kitt Peak in 1999 December. The beam sizes were 40″ and 35″(HPBW) for the DNC and HN13C observations, respectively. We used two SIS mixer receivers and observed the DNC and HN13C lines simultaneously. The system temperatures were typically 400-500 K (SSB), although those for the HN13C lines were systematically higher because of the heavier atmospheric absorption due to the water line (183 GHz). Since the temperature scale is given as in the observations with the NRAO 12 m telescope, we converted these values to the main beam brightness temperature by the following equation; . The corrected main beam efficiency () of the NRAO 12 m telescope was 0.7 for the DNC and HN13C lines (=2-1), which was derived from observations of planets. The hybrid spectrometers with the frequency resolution of 48.8 kHz were used for the backend. The velocity resolutions were 0.096 km s-1 and 0.084 km s-1 in the 152 GHz and 174 GHz regions, respectively. We employed the position-switching mode as in the observations with the NRO 45 m telescope. On source integration time was from 20 to 70 minutes and the rms noise temperature was from 0.04 to 0.15 K in the scale.
3 Line Parameter
We observed both the =1-0 and 2-1 lines of DNC and HN13C toward selected 10 positions. The DNC lines were detected toward all the positions, while the =1-0 and 2-1 lines of HN13C were detected toward 9 and 8 positions, respectively. Examples of the observed spectra are shown in Figure 1. It is known that the DNC and HN13C lines have complex hyperfine structure due to the deuterium and nitrogen nuclei (Frerking, Langer, & Wilson 1979; Paper I; Turner 2001). Since the hyperfine splittings in the DNC and HN13C lines were not resolved completely due to the small nuclear quadrupole coupling constants, (Paper I; Turner 2001), a single Gaussian profile was fitted to each spectrum to determine the peak antenna temperature, line width, and LSR velocity. Results are summarized in Table Mapping Observations of DNC and HN13C in Dark Cloud Cores.
As shown in Table Mapping Observations of DNC and HN13C in Dark Cloud Cores, broadening due to an unresolved hyperfine structure pattern is larger for the DNC lines than for the HN13C lines, and is larger for the =1-0 lines than for the =2-1 lines. In addition, the LSR velocities of the =1-0 and 2-1 lines of DNC and HN13C seem to be slightly different even toward the same position, which are also due to the hyperfine structure of the lines. Therefore, the line parameters derived from the single Gaussian fitting do not exactly represent the velocity width of the core. Although it is, in principle, possible to determine the velocity width by the Gaussian fitting including hyperfine structure, it is almost impossible to do this because of the limited spectral resolution of the spectrometers used in our observations. In practice, the derived column densities are consistent with those derived by including the hyperfine splittings, as shown in Paper I and Turner (2001). Thus, we analyzed our data using the results of the single Gaussian fitting.
We found a double-peaked line profile in the H13CO+ spectrum toward L1544, indicating that there are two velocity components in L1544 (Tafalla et al. 1998; Caselli et al. 2002a). On the other hand, the DNC and HN13C lines do not show apparent evidence for two velocity components or a self-absorption dip, indicating the difference in distributions between HCO+ and HNC; HNC resides in an inner part of the core while HCO+ tend to be depleted at the core center.
4 LVG Analysis
We analyzed the =2-1 and 1-0 data of DNC and HN13C by statistical equilibrium calculations based on the large velocity gradient (LVG) model (Goldreich & Kwan 1974). We simultaneously fitted the DNC and HN13C data to derive the H2 density and the column densities of DNC and HN13C. Since the hyperfine structure was not resolved for most of the observed lines, we ignored the hyperfine splitting. Collisional excitation rates for the DNC-H2 system and the HN13C-H2 system were calculated from those of the HCN-He system (Green & Thaddeus 1974). We multiplied by a factor of 1.37 to the HCN-He collision rates to correct the difference in the reduced mass. The dipole moment is 3.05 debye both for DNC and HN13C (Blackman et al. 1976).
The mean FWHM line width of the =2-1 and 1-0 lines was used to estimate the velocity gradient in the LVG calculations. This assumption would affect the derived column density, because the =2-1 lines have systematically narrower line widths than the =1-0 lines due to a difference in the unresolved hyperfine structure. However, we confirmed that the systematic errors in the column density caused by this assumption would be less than 25%. The kinetic temperature was assumed to be 10 K for all the cores (Benson & Myers 1989). If we assume the kinetic temperature of 8-12 K, the derived column densities of DNC and HN13C vary only 10-20 %, and hence, a change in the DNC/HN13C ratios is confirmed to be less than 20 %, while the H2 densities typically vary by a factor of 2.
The H2 densities and the column densities of DNC and HN13C obtained by the above method are summarized in Table 4, and the derived DNC/HN13C ratios are summarized in Table 5. In this analysis, we noticed that the intensities of the =2-1 lines relative to the =1-0 lines of DNC observed in TMC-1(cyanopolyyne peak, hereafter CP), L63(-30″, 90″), and L63(0″, 60″) are slightly smaller than those allowed by the LVG model. This is in part due to the limited signal-to-noise ratio of the data, but may also reflect a systematic error such that the DNC lines are more affected by the beam dilution effect than the HN13C lines because of a systematically larger beam size for DNC. Therefore, we assumed the H2 density derived from the HN13C data in the analysis for TMC-1 (CP). Similarly, we employed the H2 density derived from the DNC and HN13C data toward the (0″, 0″) position of L63 in the analysis for the other 2 positions in L63.
For comparison, we analyzed the DNC and HN13C data individually. We found that the H2 densities derived from the HN13C data are larger by a factor of 1.3-4.5 than those from the DNC data. As a result, the DNC/HN13C ratios systematically increased by a factor of 1.2-2.6. The largest change in the DNC/HN13C ratios were found for the (0″, 0″) position of L63 and TMC-1 (core C), where the change in the DNC/HN13C ratios are factor of 2.6 and 2.4, respectively. Except for these two positions, the uncertainty in the DNC/HN13C ratio due to the assumed H2 density is estimated to be less than a factor of 1.6. In total, the typical uncertainty in the DNC/HN13C ratio is estimated to be a factor of 2.
The H2 densities determined by the LVG analysis range from 1.4105 cm-3 to 5.5105 cm-3. These values indicate that the DNC and HN13C molecules seem to be distributed in similar density regions traced by DCO+ (Butner et al. 1995), C34S (Hirota et al. 1998), NH3 (Benson & Myers 1989), and N2H+ (Caselli et al. 2002c). The density variation is not very large among the observed positions. We compared our results with those of Paper I, in which the H2 densities determined from the C34S lines were used (Hirota et al. 1998). For three positions, TMC-1(CP), TMC-1(NH3), and L63 (0″, 0″), we found that the H2 densities derived from the DNC and HN13C lines are comparable to those derived from the C34S lines (Hirota et al. 1998). On the other hand, the H2 density determined from the C34S lines for L1544 (0″, 0″) is lower by a factor of 5 than that from the DNC and HN13C lines. Since the (0″, 0″) position of L1544 is not the core center but rather close to the edge, the H2 density derived from the C34S data would be reduced. Nevertheless, the DNC/HN13C ratios reported for these positions in Paper I are comparable to those derived in the present study.
The derived DNC/HN13C ratios range from 1.25 to 5.44. The DNC/HN13C ratio for TMC-1(CP), 1.25, agrees well with that of Turner (2001), 0.99-1.24. Assuming that the 12C/13C ratio is 60 (Mangum et al. 1988; Langer & Penzias 1993; Ikeda, Hirota, & Yamamoto 2002), the DNC/HNC ratios are derived to be 0.02-0.09. These values are consistent with our previous estimates (Paper I).
5 Distributions of DNC and HN13C
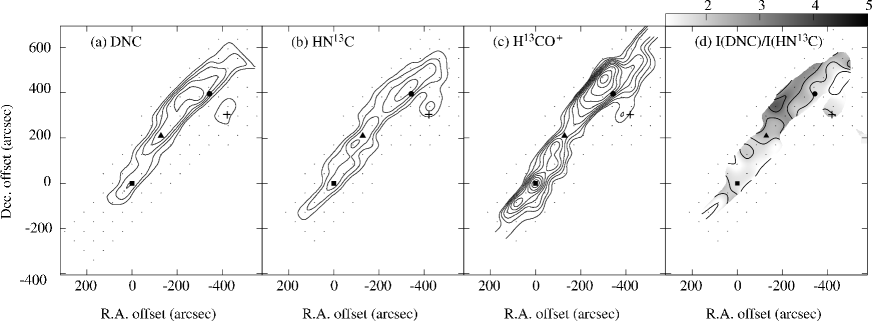
The integrated intensity maps of DNC (=1-0), HN13C (=1-0), and H13CO+ (=1-0) along with the integrated intensity ratio maps of DNC/HN13C (=1-0) are shown in Figures 2-5. As shown in Table 4, the optical depths of the =1-0 lines of DNC and HN13C are less than 1.7. Therefore, the integrated intensity distributions of the =1-0 lines approximately represent the column density distributions, and the integrated intensity ratio of DNC/HN13C in the =1-0 lines approximately represents the column density ratio of DNC/HN13C. In fact, the integrated intensity ratios of DNC/HN13C well correlate with the column density ratios, as shown in Table 5.
In general, the distributions of DNC and HN13C resemble that of N2H+ for L1512, L1544, and L63 (Caselli et al. 2002c). On the other hand, the distributions of H13CO+ is more extended than those of DNC and HN13C. These differences would reflect the chemical abundance variation within the core. Although these molecular lines trace similar density regions (- cm-3), DNC and HN13C reside in an inner part of the core as N2H+ and NH3 (Bergin & Langer 1997; Caselli et al. 2002b).
The distributions of DNC and HN13C are also quite similar to each other. As a result, the variation of the integrated intensity ratio of DNC/HN13C in each core is less than a factor of 2. We should emphasize that the variation of the DNC/HN13C ratios from core to core, ranging from 0.50 to 7.3 (Paper I), is much larger than that within each core. Nevertheless, a small but systematic variation of the DNC/HN13C ratios are found in TMC-1 and L63. These cores are larger in size than L1512 and L1544, and have multiple peak positions in the maps. First, we discuss these two cores.
5.1 TMC-1 and L63
TMC-1 is one of the most well studied dark cloud cores, and various molecular lines have been detected with radio telescopes. The maps of the DNC, HN13C, and H13CO+ lines in TMC-1 are shown in Figure 2. As suggested in Paper I, a gradient can be seen in the DNC/HN13C intensity ratio along the ridge; the DNC/HN13C intensity ratio around the ammonia peak in the northwest part of the ridge is systematically larger than that around the cyanopolyyne peak in the southeast part of the ridge. This is confirmed by our LVG analysis, as shown in Table 5. A similar trend can also be seen in other deuterated molecules such as DCO+ (Guélin, Langer, & Wilson 1982; Saito et al. 2002), CH2DCCH (Markwick, Millar, & Charnley 2002), DC3N (Howe et al. 1994), and C3HD (Bell et al. 1988). Although the H2 density is higher in the core C, the density gradient is not significant between the cyanoplyyne peak and the ammonia peak.
As mentioned in Section 1, it is well known that the abundances of carbon-chain molecules show anti-correlation with those of NH3, N2H+, and SO along the TMC-1 ridge (Hirahara et al. 1992; 1995). Thus, the DNC/HNC ratio well correlates with the NH3/CCS ratio along the ridge. This correlation seems to be understood naturally in terms of chemical evolution; the southern part of the ridge is younger than the northern part (Paper I; Saito et al. 2002), although the other mechanism considering protostellar activities in the northern region is also presented (Markwick, Millar, & Charnley 2000; Markwick, Charnley, & Millar 2001)
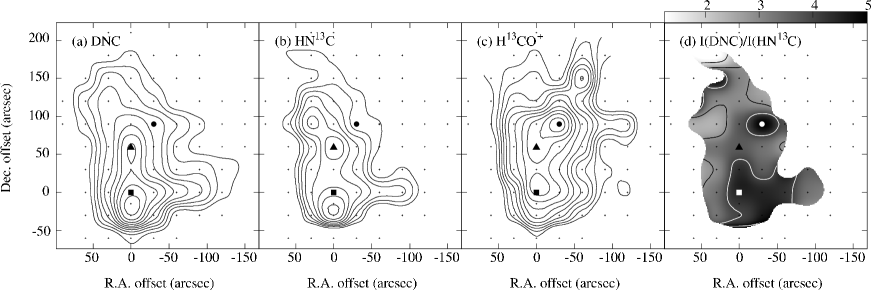
A gradient in the ratio is marginally seen in L63. L63 is one of the cores with the highest deuterium fractionation in DNC (Paper I), DCO+ (Butner et al. 1995), and NH2D (Saito et al. 2000). The maps of the DNC, HN13C, and H13CO+ lines in L63 are shown in Figure 5. There are a few emission peaks in each map, and their positions are slightly different from one another. The overall distributions of DNC and HN13C are similar to that of N2H+ (Caselli et al. 2002c). Millimeter and submillimeter continuum emissions were also observed by Ward-Thompson et al. (1994, 1999) and they presented the maps in the 1.3 mm and 800 m emissions, although they only observed the southern part of the core. The DNC/HN13C ratio is higher along the north-south ridge of the core and the (-30″, 90″) position, which corresponds to one of the H13CO+ peak. Especially, the (-30″, 90″) position is remarkable because the HN13C line is only marginally detected. In this position, it is possible that the fractionation of DNC is as high as 0.1-0.2. However, the physical and chemical conditions toward northern part of L63 are unclear in the present stage because of the lack of detailed observational data.
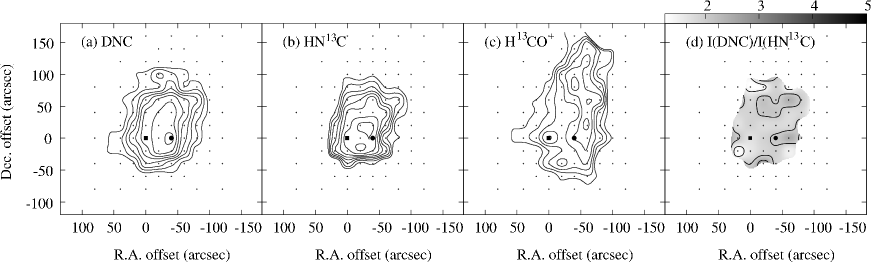
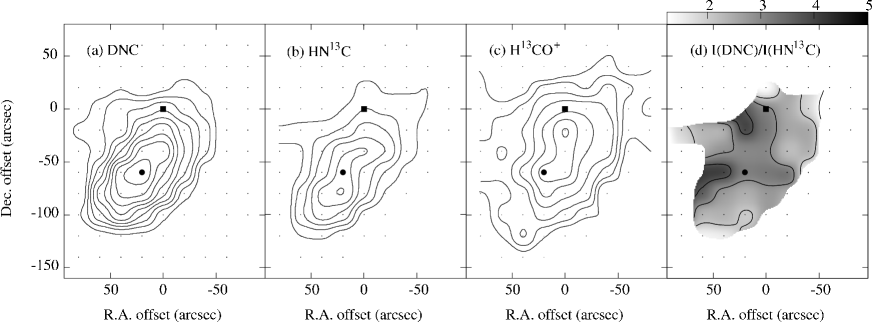
5.2 L1512 and L1544
The maps of the DNC, HN13C, and H13CO+ lines in L1512 and L1544 are shown in Figures 3 and 4, respectively. In these cores, we cannot find apparent systematic gradients in the DNC/HN13C ratio maps. Even when we obtained the column densities for two representative positions, (0″, 0″) and (20″, -60″), in L1544 by the LVG analysis, the DNC/HNC ratio is higher only by a factor of 1.5 toward the core center (20″, -60″) than toward the edge (0″, 0″). On the other hand, Caselli et al. (2002b) reported that the DCO+/HCO+ ratio in L1544 is enhanced almost by an order of magnitude from the edge to the center of the core. In addition, they also reported that the N2D+/N2H+ ratio is enhanced at the core center although the gradient is smaller than that of the DCO+/HCO+ ratio (Caselli et al. 2002b). Therefore, our result is a contrast to theirs. As for L1512, no mapping observations of deuterated molecules has been reported as far as we know.
It has been reported that the CO molecule is significantly depleted in the central part of L1544 and L1512 (Caselli et al. 2002b; Lee et al. 2003). Particularly, Caselli et al. (2002b) presented a map of the depletion factor of CO in L1544, indicating that the depletion factor increases at least by a factor of about 3 from the edge to the center of the core. A heavier depletion of CO would make the life time of H2D+ longer, resulting high H2D+/H ratio (e.g. Roberts & Millar 2000; Turner 2001). Therefore, the DNC/HNC ratio would also be enhanced through the deuteron transfer reaction from H2D+ followed by the electron recombination reaction. However, the present results suggest that the DNC/HNC ratio is not very sensitive to the depletion factor unlike DCO+/HCO+ and N2D+/N2H+ ratios.
6 Origin of the Variation of the DNC/HNC Ratio
As discussed in Section 4, the DNC/HNC ratio is derived to be 0.02-0.09 for the observed cores. These values are significantly higher than those predicted by pure gas-phase chemical models in cold (10 K) dark cloud cores, ranging from 0.015 to 0.03 (Howe & Millar 1993; Roberts & Millar 2000; Turner 2001). Hence the model including the effect of depletion of molecules onto grain surface is invoked to explain the observed ratio. According to Turner (2001), the DNC/HNC ratio increases by a factor of 2-2.5, as the depletion factor of C and O increases from 1 to 3. In order to confirm this effect further, we have investigated the spatial distribution of the DNC/HNC ratio in the L1544 core, where a positive gradient of the depletion factor from the edge to the center of the core is reported (Caselli et al. 2002b). However, no significant enhancement in the DNC/HNC ratio has been observed, although Caselli et al. (2002b) reported that the DCO+/HCO+ ratio is much enhanced toward the center of the core.
One possibility for a lack of enhancement in the DNC/HNC ratio at the core center is a relatively small distribution of HNC. As noted in Section 5, the distribution of HNC is slightly smaller than that of HCO+, which implies that DNC and HNC reside only in an inner part of the core than DCO+ and HCO+. If so, a variation of the depletion factor in such a restricted part might be small, which results in a relatively small variation of the DNC/HNC ratio. However, the large core-to-core variation of the DNC/HNC ratio cannot be explained in this way, unless the core-to-core variation of the depletion factor is introduced a priori.
Another possibility is related to the time scale of the deuterium fractionation. The time scale for deuterium fractionation via the gas-phase reactions is roughly estimated to be 105 yr for the H2 density of 105 cm-3, according to the chemical model calculations (Turner 2001). This would mainly be determined by the mean collision time of a molecule with the H ion. This time scale is comparable to the dynamical time scale (105 yr) and the depletion time scale (105 yr). Therefore, there is a possibility that deuterium fractionation does not follow the change in depletion in a dynamically evolving core. This may be a reason why we observed no significant enhancement of the DNC/HNC ratio at the center of the core. The time scale can, of course, be different from species to species. According to Turner (2001), the time dependence of deuterium fractionation strongly depends on species. If the protonated species such as HCO+ and N2H+ would have faster time scale for the deuterium fractionation, the DCO+/HCO+ ratio can be enhanced at the center of the core, as observed by Caselli et al. (2002b).
The latter explanation can also account for the core-to-core variation of the DNC/HNC ratio. If a core contracts very slowly in comparison with the dynamical time scale, molecules are subject to heavy depletion. As a result, high deuterium fractionation would be expected. In fact, Aikawa et al. (2001) constructed a chemical model for a dynamically evolving core, and showed that the DCO+/HCO+ ratio would increase if the time scale of collapse is relatively longer than those of gas-phase chemistry and depletion of molecules onto grain surface. Probably the L63 core corresponds to this case. If the core is in a very early stage of collapse, deuterium fractionation has not well proceeded. Furthermore, molecules have not been depleted onto dust grains yet, which also gives an unfavorable condition for deuterium fractionation. Probably TMC-1 (CP) corresponds to this case, where the chemical age of the core seems to be young judging from the low NH3/CCS ratio (Suzuki et al. 1992; Hirahara et al. 1992). In addition, the L1521E core also corresponds to this case, where an extremely low DNC/HNC ratio is reported (Hirota et al. 2002). From these considerations, the observed variation of the DNC/HNC ratio seems to originate from a combination of the three competing time-dependent processes; gas-phase deuterium fractionation, depletion of molecules onto grain surface, and dynamical evolution of a core (e.g. Aikawa et al. 2001). Therefore, the DNC/HNC ratio becomes higher for more chemically evolved cores, and shows a correlation with the NH3/CCS ratio (Paper I). For quantitative discussions, systematic chemical model calculations of collapsing cores would be necessary. Such an effort has recently been carried out by Aikawa, Ohashi, & Herbst (2003).
7 Summary
In this paper, we report the results of mapping observations of the =1-0 lines of DNC, HN13C, and H13CO+ toward 4 nearby dark cloud cores; TMC-1, L1512, L1544, and L63. Along with the mapping observations, we have observed the =2-1 lines of DNC and HN13C toward selected positions, which enables us to determine the H2 densities of the emission regions and the column densities of DNC and HN13C by the statistical equilibrium calculations based on the LVG model. The main results of this paper are as follows:
-
1.
We calculated the column densities of DNC and HN13C by the LVG calculations assuming that the DNC and HN13C lines trace the same volume of gas. The DNC/HN13C ratios range from 1.25 to 5.44, with a typical uncertainties of a factor of 2. The H2 densities ranges from 1.4105 cm-3 to 5.5105 cm-3.
-
2.
Assuming the 12C/13C ratio of 60, the DNC/HNC ratios are estimated to be 0.02-0.09. Some of the observed DNC/HN13C ratios exceed values predicted by gas-phase chemical models in cold (10 K) dark cloud cores, 0.015-0.03.
-
3.
The distributions of DNC and HN13C resemble that of N2H+ for L1512, L1544, and L63. On the other hand, the distributions of H13CO+ is more extended than those of DNC and HN13C. These difference would reflect chemical abundance variation within the core; DNC and HN13C would reside in an inner part of the core as well as the other nitrogen-bearing molecules such as N2H+ and NH3 while H13CO+ in an outer envelope.
-
4.
The distributions of DNC and HN13C are quite similar to each other, and the variation of the DNC/HN13C ratio within each core is less than a factor of 2. The variation of the DNC/HN13C ratios from core to core, ranging an order of magnitude (0.50-7.3), is rather remarkable than those within each core.
-
5.
While the systematic variation of the DNC/HN13C ratio can be seen in TMC-1 and L63, a similar gradient cannot be found in L1512 and L1544. Particularly, the DNC/HNC ratio does not show enhancement at the center of the core of L1544 unlike the DCO+/HCO+ ratio. This indicates that the DNC/HNC ratio is not very sensitive to depletion factor. Since the time scale of gas-phase deuterium fractionation, depletion of molecules onto grain surface, and dynamical evolution of a cloud core are comparable to one another, a combination of these competing processes would be responsible for the variation of the DNC/HNC ratio. The DNC/HNC ratio tends to be higher for more chemically evolved cores.
References
- aik (01) Aikawa, Y., Ohashi, N., Inutsuka, S., Herbst, E., & Takakuwa, S. 2001, ApJ, 552, 639
- aik (03) Aikawa, Y., Ohashi, N., & Herbst, E. 2003, ApJ, in press
- bel (88) Bell, M. B., Avery, L. W., Matthews, H. E., Feldman, P. A., Watson, J. K. G., Madden, S. C., & Irvine, W. M. 1988, ApJ, 326, 924
- ben (89) Benson, P. J., & Myers, P. C. 1989, ApJS, 71, 89
- ber (97) Bergin, E. A. & Langer, W. D. 1997, ApJ, 486, 316
- bla (76) Blackman, G. L., Brown, R. D., Godfrey, P. D., & Gunn, H. I. 1976, Nature, 261, 395
- but (95) Butner, H. M., Lada, E. A., & Loren, R. B. 1995, ApJ, 448, 207
- (8) Caselli, P., Walmsley, C. M., Zucconi, A., Tafalla, M., Dore, L., & Myers, P. C. 2002a, ApJ, 565, 331
- (9) Caselli, P., Walmsley, C. M., Zucconi, A., Tafalla, M., Dore, L., & Myers, P. C. 2002b, ApJ, 565, 344
- (10) Caselli, P., Benson, P. J., Myers, P. C., & Tafalla, M. 2002c, ApJ, 572, 238
- fre (79) Frerking, M. A., Langer, W. D., & Wilson, R. W. 1979, ApJ, 232, L65
- ger (87) Gerin, M., et al. 1987, A&A, 173, L1
- gol (74) Goldreich, P., & Kwan, J. 1974, ApJ, 189, 441
- gre (74) Green, S., & Thaddeus, P. 1974, ApJ, 191, 653
- gue (82) Guélin, M., Langer, W. D., & Wilson, R. W. 1982, A&A, 107, 107
- hir (92) Hirahara, Y., et al. 1992, ApJ, 394, 539
- hir (95) Hirahara, Y., et al. 1995, PASJ, 47, 845
- hir (01) Hirota, T., Ikeda, M., & Yamamoto, S. 2001, ApJ, 547, 814 (Paper I)
- hir (02) Hirota, T., Ito, T., & Yamamoto, S. 2002, ApJ, 565, 359
- hir (98) Hirota, T., Yamamoto, S., Mikami, H., & Ohishi, M. 1998, ApJ, 503, 717
- how (93) Howe, D. A., & Millar, T. J. 1993, MNRAS, 262, 868
- how (94) Howe, D. A., Millar, T. J., Schilke, P., & Walmsley, C. M. 1994, MNRAS, 267, 59
- ike (02) Ikeda, M., Hirota, T., & Yamamoto, S. 2002, ApJ, 575, 250
- lan (93) Langer, W. D., & Penzias, A. A. 1993, ApJ, 408, 539
- lee (03) Lee, J.-E., Evans N. J., II, Shirley, Y. L., and Tatematsu, K. 2003, ApJ, 583, 789
- man (88) Mangum, J. G., Rood, R. T., Wadiak, E. J., & Wilson, T. L. 1988, ApJ, 334, 182
- mar (01) Markwick, A. J., Charnley, S. B., & Millar, T. J. 2001, A&A, 376, 1054
- mar (00) Markwick, A. J., Millar, T. J., & Charnley, S. B. 2000, ApJ, 535, 256
- mar (02) Markwick, A. J., Millar, T. J., & Charnley, S. B. 2002, A&A, 381, 560
- mil (89) Millar, T. J., Bennett, A., & Herbst, E. 1989, ApJ, 340, 906
- rob (00) Roberts, H. & Millar, T. J. 2000, A&A, 361, 388
- sai (00) Saito, S., Ozeki, H., Ohishi, M., & Yamamoto, S. 2000, ApJ, 535, 227
- sai (02) Saito, S., Aikawa, Y., Herbst, E., Ohishi, M., Hirota, T., Yamamoto, S., & Kaifu, N. 2002, ApJ, 569, 836
- sha (01) Shah, R. Y., & Wootten, A. 2001, ApJ, 554, 933
- suz (92) Suzuki, H., Yamamoto, S., Ohishi, M., Kaifu, N., Ishikawa, S., Hirahara, Y., & Takano, S. 1992, ApJ, 392, 551
- taf (98) Tafalla, M., Mardones, D., Myers, P. C., Caselli, P., Bachiller, R., & Benson, P. J. 1998, ApJ, 504, 900
- tur (01) Turner, B. E. 2001, ApJS, 136, 579
- war (94) Ward-Thompson, D., Scott, P. F., Hills, R. E., & André, P. 1994, MNRAS, 268, 276
- war (99) Ward-Thompson, D., Motte, F., & André, P. 1999, MNRAS, 305, 143
- wil (94) Wilson, T. L. & Rood, R. T. 1994, ARAA, 32, 191
| Molecule | Transition | (MHz) | (D) | aaCP and NH3 correspond to the cyanopolyyne peak and NH3 peak, respectively. Core C corresponds to the position labeled by Hirahara et al. (1992). The coordinates (B1950) and offsets from the reference position (CP peak) of NH3 peak and core C are as follows; NH3: 04h38m14s.5, 25∘42′30″(-5′26″, 6′45″); core C: 04h38m29s.2, 25∘39′17″(-2′07″, 3′32″). |
|---|---|---|---|---|
| DNC | =1-0 | 76305.727 | 3.05 | 1.00 |
| DNC | =2-1 | 152609.774 | 3.05 | 2.00 |
| HN13C | =1-0 | 87090.850 | 3.05 | 1.00 |
| HN13C | =2-1 | 174179.408 | 3.05 | 2.00 |
| H13CO+ | =1-0 | 86754.330 | 4.07 | 1.00 |
| Source | (1950) | (1950) | Grid | |
|---|---|---|---|---|
| Name | ( h m s) | ( ∘ ′ ″) | (arcsec) | Date |
| TMC-1 | 04 38 38.6 | 25 35 45 | 60 | Apr 1997, Feb 1998 |
| L1512 | 05 00 54.4 | 32 39 00 | 20 | May 1999 |
| L1544 | 05 01 11.1 | 25 07 40 | 20 | Apr 1997, Feb 1998 |
| L63 | 16 47 21.0 | -18 01 00 | 30 | Feb 1999 |
| Source | |||||||
|---|---|---|---|---|---|---|---|
| Name | Position | Molecule | (K) | (km s-1) | (km s-1) | (K) | References |
| TMC-1 | (CPaaCP and NH3 correspond to the cyanopolyyne peak and NH3 peak, respectively. Core C corresponds to the position labeled by Hirahara et al. (1992). The coordinates (B1950) and offsets from the reference position (CP peak) of NH3 peak and core C are as follows; NH3: 04h38m14s.5, 25∘42′30″(-5′26″, 6′45″); core C: 04h38m29s.2, 25∘39′17″(-2′07″, 3′32″).) | DNC(1-0) | 1.42(0.16) | 5.89(0.06) | 1.16(0.16) | 0.16 | 1 |
| HN13C(1-0) | 1.12(0.17) | 5.94(0.06) | 0.75(0.14) | 0.13 | 1 | ||
| DNC(2-1) | 0.43(0.06) | 5.92(0.06) | 0.83(0.13) | 0.04 | |||
| HN13C(2-1) | 0.41(0.08) | 5.82(0.06) | 0.54(0.13) | 0.05 | |||
| (NH3aaCP and NH3 correspond to the cyanopolyyne peak and NH3 peak, respectively. Core C corresponds to the position labeled by Hirahara et al. (1992). The coordinates (B1950) and offsets from the reference position (CP peak) of NH3 peak and core C are as follows; NH3: 04h38m14s.5, 25∘42′30″(-5′26″, 6′45″); core C: 04h38m29s.2, 25∘39′17″(-2′07″, 3′32″).) | DNC(1-0) | 1.76(0.17) | 5.90(0.05) | 1.12(0.13) | 0.17 | 1 | |
| HN13C(1-0) | 1.07(0.21) | 5.96(0.07) | 0.73(0.18) | 0.14 | 1 | ||
| DNC(2-1) | 0.78(0.08) | 5.99(0.05) | 0.86(0.11) | 0.05 | |||
| HN13C(2-1) | 0.39(0.13) | 6.03(0.09) | 0.52(0.21) | 0.09 | |||
| (core CaaCP and NH3 correspond to the cyanopolyyne peak and NH3 peak, respectively. Core C corresponds to the position labeled by Hirahara et al. (1992). The coordinates (B1950) and offsets from the reference position (CP peak) of NH3 peak and core C are as follows; NH3: 04h38m14s.5, 25∘42′30″(-5′26″, 6′45″); core C: 04h38m29s.2, 25∘39′17″(-2′07″, 3′32″).) | DNC(1-0) | 1.75(0.25) | 5.89(0.07) | 1.01(0.17) | 0.21 | ||
| HN13C(1-0) | 1.32(0.21) | 6.00(0.05) | 0.64(0.12) | 0.16 | |||
| DNC(2-1) | 0.88(0.09) | 5.98(0.04) | 0.79(0.10) | 0.06 | |||
| HN13C(2-1) | 0.79(0.11) | 5.85(0.04) | 0.50(0.09) | 0.07 | |||
| L1512 | (0″, 0″) | DNC(1-0) | 1.28(0.12) | 7.13(0.04) | 0.82(0.09) | 0.06 | 1 |
| HN13C(1-0) | 1.25(0.10) | 7.19(0.02) | 0.51(0.05) | 0.06 | 1 | ||
| DNC(2-1) | 0.68(0.06) | 7.18(0.03) | 0.78(0.08) | 0.05 | |||
| HN13C(2-1) | 0.63(0.12) | 7.10(0.04) | 0.41(0.09) | 0.06 | |||
| (-40″, 0″) | DNC(1-0) | 1.46(0.25) | 7.12(0.08) | 0.92(0.19) | 0.16 | ||
| HN13C(1-0) | 1.13(0.22) | 7.22(0.05) | 0.51(0.12) | 0.14 | |||
| DNC(2-1) | 0.64(0.13) | 7.12(0.08) | 0.74(0.19) | 0.08 | |||
| HN13C(2-1) | 0.50(0.31) | 7.03(0.00) | 0.25(0.20) | 0.15 | |||
| L1544 | (0″, 0″) | DNC(1-0) | 1.33(0.17) | 7.05(0.07) | 1.18(0.19) | 0.15 | 1 |
| HN13C(1-0) | 0.86(0.15) | 7.18(0.07) | 0.80(0.17) | 0.14 | 1 | ||
| DNC(2-1) | 0.67(0.07) | 7.15(0.04) | 0.82(0.10) | 0.06 | |||
| HN13C(2-1) | 0.40(0.13) | 7.06(0.11) | 0.64(0.26) | 0.08 | |||
| (20″, -60″) | DNC(1-0) | 2.91(0.32) | 7.21(0.06) | 1.09(0.15) | 0.25 | ||
| HN13C(1-0) | 1.71(0.27) | 7.16(0.04) | 0.53(0.10) | 0.16 | |||
| DNC(2-1) | 1.69(0.10) | 7.17(0.03) | 0.93(0.06) | 0.07 | |||
| HN13C(2-1) | 0.92(0.15) | 7.15(0.06) | 0.67(0.13) | 0.10 | |||
| L63 | (0″, 0″) | DNC(1-0) | 2.54(0.32) | 5.74(0.06) | 0.88(0.14) | 0.17 | 1 |
| HN13C(1-0) | 0.92(0.36) | 5.86(0.09) | 0.46(0.22) | 0.17 | 1 | ||
| DNC(2-1) | 1.27(0.07) | 5.79(0.02) | 0.78(0.05) | 0.05 | |||
| HN13C(2-1) | 0.49(0.18) | 5.68(0.07) | 0.38(0.17) | 0.09 | |||
| (-30″, 90″) | DNC(1-0) | 1.38(0.27) | 5.75(0.08) | 0.86(0.20) | 0.21 | ||
| HN13C(1-0) | 0.17 | ||||||
| DNC(2-1) | 0.47(0.05) | 5.75(0.04) | 0.77(0.10) | 0.04 | |||
| HN13C(2-1) | 0.07 | ||||||
| (0″, 60″) | DNC(1-0) | 2.43(0.24) | 5.80(0.04) | 0.88(0.10) | 0.18 | ||
| HN13C(1-0) | 0.96(0.19) | 5.88(0.07) | 0.69(0.16) | 0.14 | |||
| DNC(2-1) | 0.80(0.10) | 5.79(0.05) | 0.76(0.11) | 0.07 | |||
| HN13C(2-1) | 0.14 |
References. — 1:Hirota et al. 2001
Note. — The numbers in parenthesis represent three times the standard deviation in the Gaussian fit (3).
| Source | =1-0 | =2-1 | (H2) | ||||||
|---|---|---|---|---|---|---|---|---|---|
| Name | Position | Molecule | (K) | (K) | (105 cm-3) | (1012 cm-2) | |||
| TMC-1 | (CP) | DNC | 0.8 | 4.9 | 1.2 | 3.7 | 1.8aaH2 density derived from the HN13C data toward TMC-1 (CP). | 3.46 | |
| HN13C | 1.3 | 4.5 | 1.5 | 3.6 | 1.8 | 2.77 | |||
| (NH3) | DNC | 1.6 | 5.1 | 2.5 | 4.0 | 1.4 | 7.56 | ||
| HN13C | 1.5 | 4.3 | 1.7 | 3.5 | 1.4 | 3.03 | |||
| (core C) | DNC | 0.4 | 8.0 | 1.0 | 4.8 | 5.5 | 2.70 | ||
| HN13C | 0.6 | 6.6 | 1.1 | 4.4 | 5.5 | 1.74 | |||
| L1512 | (0″, 0″) | DNC | 0.4 | 7.2 | 0.9 | 4.4 | 4.6 | 2.08 | |
| HN13C | 0.6 | 5.9 | 1.0 | 4.2 | 4.6 | 1.26 | |||
| (-40″, 0″) | DNC | 0.9 | 5.2 | 1.6 | 3.9 | 2.0 | 3.89 | ||
| HN13C | 1.7 | 4.6 | 1.4 | 3.7 | 2.0 | 1.54 | |||
| L1544 | (0″, 0″) | DNC | 0.5 | 6.4 | 1.0 | 4.3 | 3.5 | 3.02 | |
| HN13C | 0.5 | 5.2 | 0.7 | 3.9 | 3.5 | 1.51 | |||
| (20″, -60″) | DNC | 0.8 | 7.8 | 2.1 | 5.3 | 4.8 | 7.31 | ||
| HN13C | 0.8 | 6.4 | 1.4 | 4.5 | 4.8 | 2.44 | |||
| L63 | (0″, 0″) | DNC | 1.4 | 6.2 | 2.7 | 4.6 | 2.4 | 7.29 | |
| HN13C | 0.9 | 4.7 | 1.1 | 3.7 | 2.4 | 1.34 | |||
| (-30″, 90″) | DNC | 0.6 | 5.4 | 1.0 | 3.9 | 2.4bbH2 density derived from the DNC and HN13C data toward L63 (0″, 0″). | 2.35 | ||
| HN13C | 2.4bbH2 density derived from the DNC and HN13C data toward L63 (0″, 0″). | 0.24 | |||||||
| (0″, 60″) | DNC | 1.0 | 5.9 | 2.0 | 4.3 | 2.4bbH2 density derived from the DNC and HN13C data toward L63 (0″, 0″). | 4.92 | ||
| HN13C | 0.7 | 4.6 | 2.4bbH2 density derived from the DNC and HN13C data toward L63 (0″, 0″). | 1.80 | |||||
| Source | (DNC)/(HN13C) | (DNC)/(HN13C) | ||||
|---|---|---|---|---|---|---|
| Name | Position | =1-0 | =2-1 | Present | Paper I | |
| TMC-1 | (CP) | 1.96(0.37) | 1.61(0.27) | 1.25 | 1.70(0.11) | |
| (NH3) | 2.52(0.50) | 3.31(0.92) | 2.50 | 2.5(0.2) | ||
| (core C) | 2.09(0.44) | 1.76(0.23) | 1.55 | |||
| L1512 | (0″, 0″) | 1.65(0.15) | 2.05(0.31) | 1.65 | 1.34(0.04) | |
| (-40″, 0″) | 2.33(0.52) | 3.79(2.00) | 2.53 | |||
| L1544 | (0″, 0″) | 2.28(0.52) | 2.15(0.51) | 2.00 | 2.0(0.2) | |
| (20″, -60″) | 3.50(0.58) | 2.55(0.30) | 3.00 | |||
| L63 | (0″, 0″) | 5.28(1.60) | 5.32(2.44) | 5.44 | 7.0(0.7) | |
| (-30″, 90″) | 8.87 | 5.75 | 9.79 | |||
| (0″, 60″) | 3.23(0.68) | 4.94 | 2.73 | |||
Note. — The numbers in parenthesis represent the errors estimated from the rms noise of the observed spectra(3).