Young Stars and Outflows in the globule IC 1396 W
We have observed the IC 1396 W globule in a narrow band filter centred on the 1 – 0 S(1) line of molecular hydrogen and in the J, H, K’ broad-band filters. Three molecular hydrogen outflows could be identified by means of H2 emission. The projected axes of the flows are parallel to each other. By means of the NIR images and IRAS/ISOPHOT data we could identify the driving sources of all outflows, the possible Class 0 source IRAS21246+5743 and two red objects (Class 1/2). NIR photometry reveals an embedded cluster of young stars in the globule, coinciding with FIR emission. Other young stars in the field are more or less clustered in several small groups, an indication that star formation takes place at different positions at the same time in such small globules.
Key Words.:
Shock waves – Molecular processes – Stars: formation – ISM: jets and outflows – individual objects: IC 1396 W1 Introduction
The H II region IC 1396 is situated in the Cep OB2 region at a distance of about 750 pc (Matthews m79 (1979)). It is excited by the O6.5V star HD 206267 (Walborn & Panek wp84 (1984)). Extensive studies of the structure and the content of embedded young stellar objects in this region were performed by Weikard et al. (wwcws96 (1996)) and Schwarz et al. (sgw91 (1991)). Osterbrock (o57 (1957)) has identified several dark globules in this region, while Sugitani et al. (sfo91 (1991)) proved the association of some of such globules with IRAS sources. This, and the observations of the IC 1396 N globule (e.g. Codella et al. (cbnst01 (2001)) and Nisini et al. (nmvgldc_etal01 (2001))) give strong evidence for the assumption that these globules are sites of ongoing star formation.
The IC 1396 W globule lies about 1.75∘ WNW of the star HD 206267. In the centre of the small (about 6’) dark cloud, the IRAS source IRAS21246+5743 can be found. This source is not detected at 12 m. Together with the very red IRAS colours and the extended appearance in 100 m IRAS image, this suggests the existence of a young, deeply embedded source. Further investigations of this object with the photometer ISOPHOT confirmed this hypothesis (Froebrich et al. fshe03 (2003)). They find strong evidence for IRAS21246+5743 being a deeply embedded Class 0 source of 16 L⊙ that will reach about one solar mass on the main sequence. The ISOPHOT maps at 160 and 200 m of Froebrich et al. (fshe03 (2003)) show two further cold objects (2.5′ SW and NE, respectively) in the vicinity of the central source. This might be an indication of other new forming stars or cold dust in the IC 1396 W globule. Such embedded objects or clusters can be revealed by NIR imaging in the J, H, and K bands. The resulting (J-H, H-K) colour-colour diagrams give then additional information about the extinction and the youngest members of such clusters.
Observations of the IC 1396 W cloud in low-excitation rotational CO lines (see e.g. Wouterloot & Brand (wb89 (1989)) and Schwartz et al. (sgw91 (1991))) indicate line wings on the profiles. This gives evidence for the presence of a mass outflow, connected to the central IRAS source. But no CO map, flow mass, or energetics were presented so far. Hodapp (h94 (1994)) imaged the region in the NIR K’ filter and describes a parabola-shaped nebula at the western end of the outflow, an indication of shock excited bow shaped H2 emission as found in many other protostellar outflows. NIR imaging in continuum and a narrow band filter centred at the 1 – 0 S(1) line of molecular hydrogen at 2.122 m can provide a verification of this assumption. Such observations are a powerful tool to investigate the intensity and morphology of shocked H2 emission.
In Sec. 2 we present our data and describe the data reduction process. A special emphasis is placed on the calibration of the J, H, and K’ magnitudes. Our results are shown in Sec. 3. We describe the discovered outflows in detail and characterise the young stellar population of the IC 1396 W globule by means of a (H-K, J-H) colour-colour diagram.
2 Observations and Data Reduction
The NIR survey of IC 1396 W was carried out with MAGIC (Herbst et al. hbbhmmw93 (1993)) mounted at the 2.2-m telescope of the German-Spanish Astronomical Centre on Calar Alto. The camera possesses a NICMOS3 array with a pixel scale of 1.6″/pix in widefield mode. Using a dithering pattern, we observed a ′ field centred on IRAS21246+5743. During a run from 16th to 19th of September 2002, we obtained images in the broadband filters J, H, K’, and the narrow band filter NB2122 with a central wavelength of 2.122 m. The total exposure times were 192 s in J and H, 208 s in K’, and 3480 s in NB2122. In a photometric night, the 2MASS object 2MASSW J0036159+182110 (hereafter 2M0036+18; Kirkpatrick et al. k00 (2000)) was observed in the broadband filters J, H, and Kshort as photometric standard star.
Both, object and standard star frames were flatfielded using skyflats. The DIMSUM package in IRAF111IRAF is distributed by National Optical Astronomy Observatories, which is operated by the Association of Universities for Research in Astronomy, Inc., under contract with the National Science Foundation. was used for sky subtraction and co-addition of the single images. Co-centering of the single frames was done by using all detectable stars in the field to obtain a high relative astrometric accuracy (about 1″).
In order to generate a catalogue of all objects in the field (including the emission knots), we ran the SExtractor (Bertin & Arnouts ba96 (1996)) on the NB2122 mosaic. The relative offsets between the NB2122 and the three broadband images were determined by measuring the relative positions of some bright stars. Applying these offsets to the NB2122 pixel coordinates, we obtained object catalogues for the J, H, and K’ mosaics. We used the PHOT routine within the IRAF DAOPHOT package (Stetson s87 (1987)) to perform aperture photometry for all registered objects. The aperture radius of 4 pixels safely includes more than 99% of the object’s flux. The instrumental magnitudes of the calibration object 2M0036+18 were measured with the same parameters.
With the 2MASS magnitudes of 2M0036+18, we calculated accurate zeropoints for the J, H, and Kshort band. The K’ filter used for the IC 1396 W survey has a response function very similar to the Kshort filter: Essentially, both filters cover the K-band without the long wavelength end above 2300 nm. Compared with the K-band, this excludes a region with strong atmospheric absorption and, thus, improves the signal-to-noise ratio. The application of the derived zeropoints shifts the instrumental magnitudes of the IC 1396 W field into the photometric system of 2MASS. Since the standard star was observed nearly at the same airmass as the IC 1396 W field, this operation also corrects for the atmospheric extinction. The error caused by the airmass difference between standard and science observations is below 1%.
To distinguish between field stars in the back- or foreground and a possible young population, we need to compare the derived magnitudes with the main sequence, e.g. with the infrared colours given by Bessell & Brett (bb88 (1988), hereafter: BB). The referred empirical main sequence is well adapted for our purposes because it uses a specified homogenized JHK system. To calculate the zeropoint difference of this system with respect to the 2MASS system, we integrated the filter curves of both systems and scaled our magnitudes to the transmission of the BB bands.
However, one has to be careful comparing our colours with the main sequence of BB. The described transformation from 2MASS to BB magnitudes is only valid for objects with flat spectral energy distribution and, thus, colour zero. Since we do not a priori know the BB colours for our objects, it is not possible to perform a colour correction. As noted above, the long wavelength cutoff of the Kshort (and the K’) filter is nm below the end of the BB K-band. Hence, compared with the BB system, we will loose K-flux proportional to the colour of the target. As a consequence, our (H-K) colours will be too low. A similar effect must be expected for the J-band: In this case, the BB band excludes flux for nm, whereas the cutoff of the 2MASS J-filter (and the MAGIC J-filter as well) lies at 1420 nm. Hence, we measure too much flux in the J-band for red objects, leading to increased (J-H) colours. Recapitulating, all red objects will move down to right in the (H-K, J-H) colour-colour diagram. The interpretation of these colours (see Sect. 3.1) must account for this effect.
The K’ image was multiplied by the ratio of the NB2122/K’ band-passes and then subtracted from the NB2122 image. In the difference image stars possess zero flux and the H2 emission line objects can be identified easily. Flux calibration and conversion to W m-2 of this difference image was done using the zero-point of 673 Jy for the K-band as given by Wamsteker (w81 (1981)).
3 Results
3.1 JHK Photometry - Stellar population of the globule
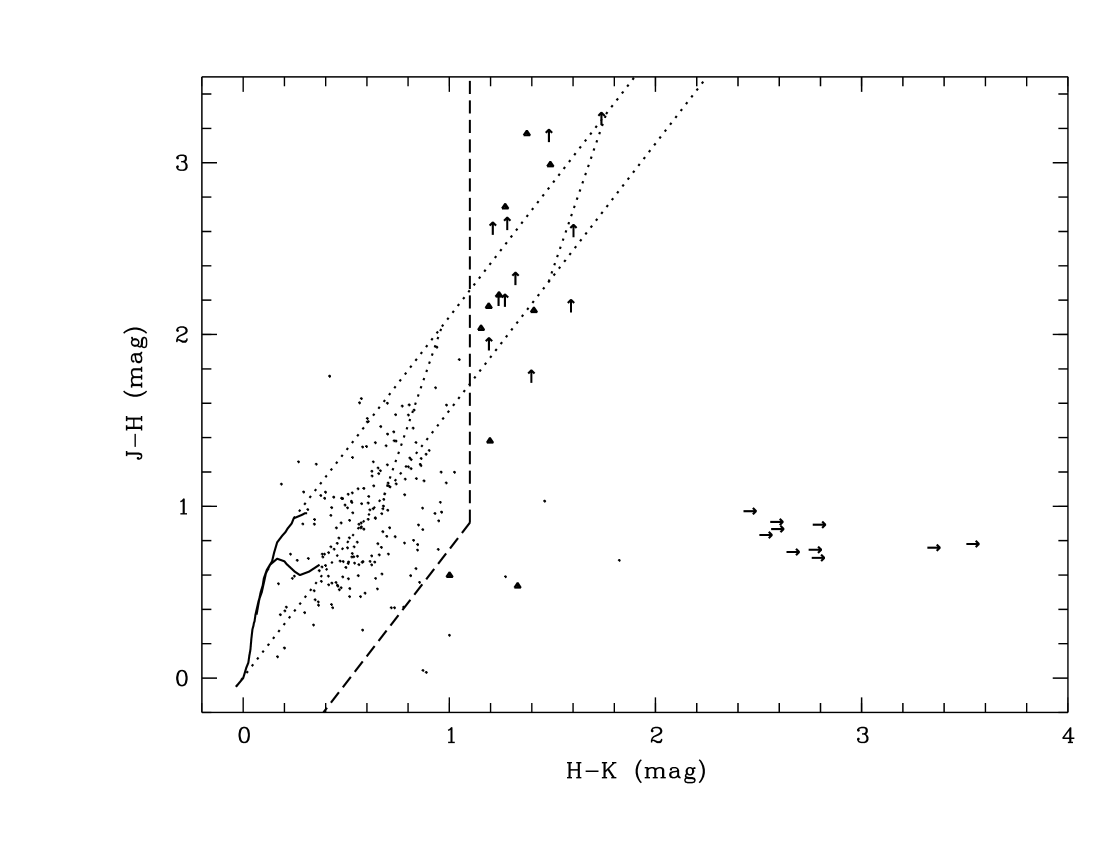
Our colour-colour diagram for the central part of the observed field is shown in Fig. 1. Solid lines represent the main sequence for dwarfs and giants given by BB. The dotted lines indicate the reddening vector calculated with the extinction model of Mathis (m90 (1990)) and confine the area where developed stars should reside. Two dotted lines parallel to the main sequence show the main sequence position for = 10 and = 20 mag. From this diagram, we estimate a mean cloud extinction of mag. As discussed above (see Sect. 2), our photometry gives too high J-H and too low H-K colours compared with the main sequence as a consequence of non-homogenuous colour systems. Thus, the objects with very high J-H can be expected to lie in fact below the extinction path.
Clearly, there is a population of young red objects right of the main sequence. We selected all objects on the right side of the dashed line as probable young stellar objects. H2 emission knots and obvious spurious detections were rejected. The remaining 10 objects are marked as triangles. The reddest objects will not be detected in J or even in H. We show the position of these candidates with arrows: Upper arrows represent lower limits in J-H for objects without detection in J, right arrows are lower limits in H-K for objects without detection in J and H, but in K’ and NB2122. In these cases, the J-H values are randomly. We summarise coordinates and photometry of the young stellar population in IC 1396 W in Table 1.
| Object | (J2000) | (J2000) | K (mag) | J-H (mag) | H-K (mag) |
|---|---|---|---|---|---|
| 1 | 21:25:41.2 | 57:54:37 | 14.64 0.08 | 0.60 0.13 | 1.00 0.13 |
| 2 | 21:25:41.5 | 57:57:18 | 10.75 0.01 | 3.17 0.04 | 1.38 0.01 |
| 3 | 21:25:42.9 | 57:55:27 | 14.47 0.07 | 1.38 0.20 | 1.20 0.12 |
| 4 | 21:25:47.1 | 57:54:17 | 11.31 0.01 | 2.74 0.04 | 1.27 0.01 |
| 5 | 21:25:49.0 | 57:54:42 | 11.62 0.01 | 2.99 0.07 | 1.49 0.01 |
| 6 | 21:25:52.8 | 57:55:47 | 13.19 0.02 | 2.16 0.12 | 1.19 0.04 |
| 7 | 21:25:54.4 | 57:56:01 | 13.61 0.03 | 2.23 0.17 | 1.24 0.05 |
| 8 | 21:26:05.7 | 57:56:44 | 13.04 0.02 | 2.04 0.08 | 1.15 0.03 |
| 9 | 21:26:16.6 | 57:55:42 | 15.12 0.11 | 0.54 0.26 | 1.33 0.22 |
| 10 | 21:26:32.8 | 57:57:45 | 12.42 0.01 | 2.14 0.08 | 1.41 0.02 |
| 11 | 21:25:45.3 | 57:56:27 | 14.80 0.08 | 2.2 | 1.24 0.15 |
| 12 | 21:25:46.2 | 57:55:45 | 14.77 0.08 | 2.2 | 1.27 0.15 |
| 13 | 21:25:51.6 | 57:56:04 | 15.10 0.11 | 1.9 | 1.19 0.20 |
| 14 | 21:25:52.0 | 57:56:10 | 14.59 0.07 | 2.3 | 1.32 0.13 |
| 15 | 21:25:52.1 | 57:54:58 | 13.24 0.02 | 3.2 | 1.74 0.05 |
| 16 | 21:25:52.6 | 57:56:07 | 14.48 0.06 | 2.1 | 1.59 0.14 |
| 17 | 21:25:59.4 | 57:55:19 | 14.31 0.05 | 2.6 | 1.28 0.09 |
| 18 | 21:26:17.3 | 57:56:30 | 15.08 0.11 | 1.7 | 1.40 0.22 |
| 19 | 21:26:33.7 | 57:55:26 | 13.60 0.04 | 3.1 | 1.48 0.07 |
| 20 | 21:26:40.6 | 57:55:46 | 14.03 0.06 | 2.6 | 1.60 0.12 |
| 21 | 21:26:41.9 | 57:59:30 | 14.41 0.10 | 2.6 | 1.21 0.17 |
| 22 | 21:25:40.4 | 57:54:29 | 15.44 0.16 | 2.8 | |
| 23 | 21:25:44.3 | 57:55:04 | 15.70 0.19 | 2.5 | |
| 24 | 21:25:45.1 | 57:54:22 | 15.64 0.17 | 2.6 | |
| 25 | 21:25:48.7 | 57:53:52 | 15.77 0.20 | 2.4 | |
| 26 | 21:25:49.5 | 57:55:56 | 14.88 0.10 | 3.3 | |
| 27 | 21:26:04.5 | 57:54:47 | 15.64 0.20 | 2.6 | |
| 28 | 21:26:13.1 | 57:56:01 | 15.44 0.15 | 2.8 | |
| 29 | 21:26:23.1 | 57:56:11 | 15.46 0.15 | 2.7 | |
| 30 | 21:26:27.4 | 57:56:19 | 15.56 0.19 | 2.6 | |
| 31 | 21:26:33.9 | 57:55:41 | 14.69 0.10 | 3.5 |
3.2 Outflow morphology and driving sources
| Object | (J2000) | (J2000) | Flux∗ | Surface∗∗ |
|---|---|---|---|---|
| Brightness | ||||
| 1-a | 21:26:37.3 | +57:58:11 | 8.2 | 1.15 |
| 1-b | 21:26:33.8 | +57:57:56 | 12.4 | 1.89 |
| 1-c | 21:26:32.1 | +57:57:55 | 4.2 | 0.78 |
| 1-d | 21:26:32.8 | +57:57:35 | 10.2 | 1.15 |
| 1-e | 21:26:29.6 | +57:57:35 | 24.8 | 5.90 |
| 1-f | 21:26:29.9 | +57:57:25 | 13.8 | 2.58 |
| 1-g | 21:26:28.9 | +57:57:26 | 24.3 | 4.38 |
| 1-h | 21:26:26.7 | +57:57:27 | 6.6 | 1.97 |
| 2-a | 21:26:23.5 | +57:57:50 | 12.3 | 3.61 |
| 2-b | 21:26:21.2 | +57:57:40 | 65.0 | 13.20 |
| 2-c | 21:26:20.2 | +57:57:25 | 11.3 | 3.48 |
| 2-d | 21:26:18.6 | +57:57:12 | 15.6 | 4.88 |
| 2-e | 21:26:16.7 | +57:57:14 | 1.9 | 0.74 |
| 2-f | 21:26:09.9 | +57:56:46 | 22.4 | 2.05 |
| 2-g | 21:26:06.7 | +57:56:22 | 13.1 | 1.93 |
| 2-h | 21:26:04.9 | +57:56:29 | 13.7 | 2.66 |
| 2-i | 21:26:05.0 | +57:56:17 | 21.2 | 3.20 |
| 2-j | 21:26:01.8 | +57:56:11 | 177.3 | 16.19 |
| 2-k | 21:25:59.1 | +57:56:20 | 6.9 | 1.15 |
| 2-l | 21:25:59.5 | +57:55:55 | 6.0 | 1.02 |
| 2-m | 21:25:57.7 | +57:55:49 | 11.6 | 2.87 |
| 2-n | 21:25:55.4 | +57:55:48 | 11.7 | 3.36 |
| 3-a | 21:25:45.5 | +57:57:44 | 3.6 | 1.02 |
| 3-b | 21:25:43.8 | +57:57:32 | 6.0 | 1.89 |
| 3-c | 21:25:42.5 | +57:57:23 | 14.0 | 3.40 |
| 3-d | 21:25:39.6 | +57:57:15 | 2.8 | 1.02 |
| 3-e | 21:25:38.0 | +57:57:10 | 21.0 | 5.25 |
| 3-f | 21:25:37.2 | +57:57:08 | 29.6 | 9.10 |
| 4 | 21:26:19.5 | +57:56:59 | 7.8 | 1.23 |
| 5 | 21:26:07.9 | +57:56:05 | 10.1 | 2.79 |
| 6 | 21:25:57.6 | +57:55:22 | 16.6 | 1.23 |
-
∗
Fluxes are in W m-2.
-
∗∗
Surface brightness of H2 1–0 S(1) averaged over 1.5 ″ diameter are in W m-2 arcsec-2.
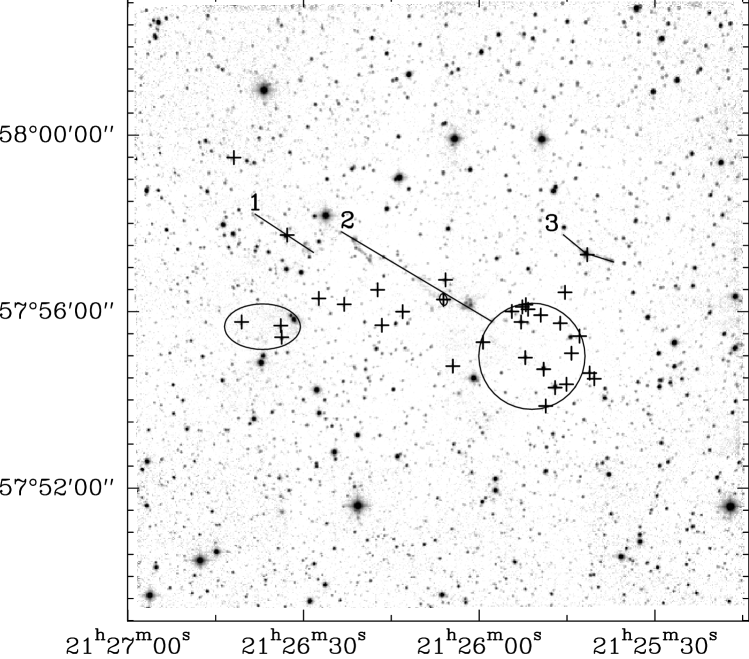
In Fig. 2 we marked the positions of the red sources listed in Table 1 by crosses. The majority of these objects is situated in the south-east corner of the globule (marked by a circle). However, no signs of outflow activity are visible here. Exactly in this region, Froebrich et al. (fshe03 (2003)) discovered with ISOPHOT maps an extremely cold source, possibly cold dust. This dust might cause the red colours of the stars and the non-detection of H2 emission in this field. Still the possibility of other deeply embedded sources exists.
About 120″ south of outflow number 1, a bright nebulosity is visible. Westward of this object there is also a small group (ellipse) of red sources (including the reddest of our objects, #31 in Table 1). No signs of outflow activity is visible here also. The other red stars are distributed uniformely in the field of the globule.
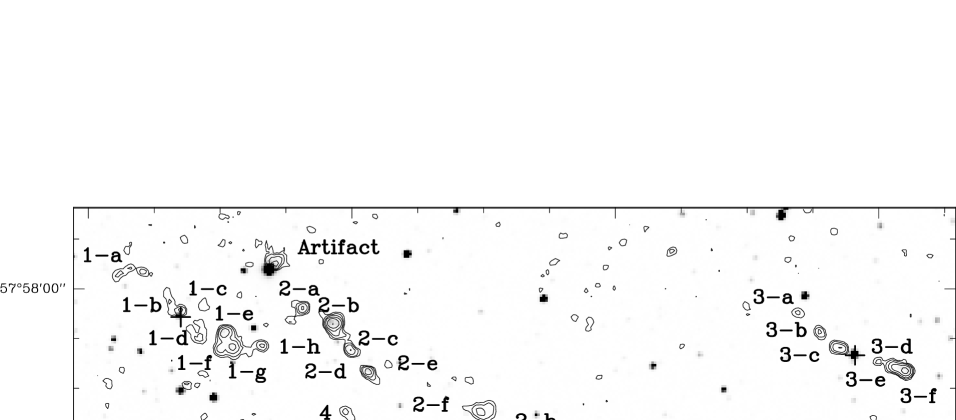
In our continuum subtracted NB2122 images of the IC 1396 W globule we discovered a variety of emission line knots in the 1 – 0 S(1) line of molecular hydrogen. In Fig. 2 the whole observed field is shown in the NB2122 image. We marked and labelled the three detected outflows and regions with stars of extreme red colours. Fig. 3 shows a blow up of the inner part of our image. The continuum subtracted H2 image is overplotted in contours for clarification. Contour levels start at 4 10-20 W m-2 arcsec-2 and increase by a factor of two in each step. The detected H2 knots are labelled. Their positions and fluxes are listed in Table 2.
The positions of the emission knots strongly suggest that we see three different outflows, emanating from young stars in the IC 1396 W globule. The knots are named, as shown in Fig. 2, by the outflow (1, 2, or 3) and a knot number (a, b, c …). Three further knots (4, 5, and 6) could not be associated directly with one of the flows. Surprisingly all three outflows seem to be orientated from north-east to south-west. The individual position angles are 58, 60 and 61∘ for the three individual outflows. Such a close alignment of three flows (even if just in projection) is difficult to explain by coincidence (probability: 0.03 %). There are also other examples of aligned outflows in small ( 1 pc) star forming clouds (e.g. $ρ$ Oph A, Kamazaki et al. (kshuk03 (2003)); L 1551, Saito et al. (skimhhk_etal95 (1995)); IC 1396 N, Nisini et al. (nmvgldc_etal01 (2001))). The authors state magnetic fields, density gradients or initial angular momentum of the molecular cloud as cause for the alignment. A consistent interpretion based on magnetic fields, however, is not possible for all these objects, since cases exist where fields and outflows are either parallel (L 1551, Saito et al. skimhhk_etal95 (1995)) or perpendicular ( Oph A, Kamazaki et al. kshuk03 (2003)). Thus, a determination of the real cause for the aligned outflows is yet not possible with the present data.
Outflow 1
In a small extension at the north-eastern edge of the IC 1396 W globule a small flow with a projected length of about 90″ (0.3 pc) is detected. Along the outflow axis a red star (#9 in Table 1) is situated which possibly drives the flow. According to the K-band magnitude of 12.4 mag the object seems to be a late type Class 1 or a borderline Class 1/2 source (Aspin et al. asr94 (1994)). Southwest of this source a group of four (1-d .. 1-g) emission knots is observed. Their positions suggest that they might be part of a bow shock heading to south-west. About 20″ westward of this emission, another faint knot (1-h) is found. The north-eastern part of the flow is much fainter in the H2 emission. A careful inspection of the H2 image reveals that the emission indicates a cavity, created by a jet. A similar structure can be seen in other young outflows (e.g. HH 211; Mc Caughrean et al. mrz94 (1994)).
Outflow 2
The most luminous and largest (240″ 0.9 pc) outflow is situated right in the centre of the observed field. At the south-west end, a bow shock structure can be found. This part of the emission was already detected in the K’ image of Hodapp (h94 (1994)). Two further knots are visible in the prolongation (2-m, 2-n). In the north-east the flow shows both a cavity-like structure (2-f .. h) and further knots (2-a .. e), seeming to be part of a bow shock. Between the knots 2-g .. i, and right at the axis of the flow, the source IRAS21246+5743 is situated. No other red object can be found along the flow axis. If IRAS21246+5743 is the source of the flow, the south-west part is much less extended. This could be due to higher extinction in this direction, since more red stars and sub-mm emission (Froebrich et al. fshe03 (2003)) can be found in the prolongation of the flow (see Sec. 3.1). At least a 30 mag higher visual extinction would be necessary to avoid the detection of H2 knots of the same brightness as the north-east lobe of the flow. A more favourable possibility is that the flow enters at its south-western edge a more dense region. The resulting shock waves are stronger, causing the bright knot 2-j and the flow is prevented to extend more into this direction.
Outflow 3
The third outflow is the faintest detected in the field. It is situated at the north-western edge of the globule. The emission knots show a jetlike structure, consisting of three knots on each side. The jet and counter-jet are misaligned by a projected angle of 25 ∘. While the south-western part is more luminous, it is less extended (SW: 36″ 0.13 pc; NE: 40″ 0.15 pc). Similar to flow number 1, a red star (#2 in Table 1) possibly driving the jet, is found in the centre of the emission knots. The measured K-band brightness of 10.8 mag classifies this source as a Class 2 object (Aspin et al. asr94 (1994)). This would also explain the low luminosity of the outflow (see below).
Other H2 emission and flow energetics
Three more emission knots are detected in the field that cannot be directly associated with one of the flows. Two of them (5 and 6) could possibly belong to the flow driven by IRAS21246+5743. Another possibility is the existence of a fourth outflow, also parallel to the others, consisting of these three knots. A possible driving source of the flow, confirming this hypothesis, is not detected in our NIR images.
The total flux in the 1 – 0 S(1) line of the three outflows is 96, 391 and 71 10-18 W m-2. Due to overlap effects in the knots, this number is not equal to the sum of the fluxes given in Table 2. The fluxes convert to 1.7, 6.8 and 1.2 10-3 solar luminosities, using a distance of 750 pc. Taking an average extinction of AV = 10 mag (read off the colour-colour diagram, Fig. 1) and AV/A2.1μm = 9 this converts to 5, 19 and 3 10-3 L⊙ total intrinsic H2 1 – 0 S(1) luminosity. According to the classification of the driving sources (flow 1: Class 1/2; flow 2: Class 0; flow 3: Class 2), these measurements fit well in the evolutionary picture of outflow and source luminosities (e.g. Smith s99 (1999, 2000, 2002)).
IRAS21246+5743, the driving source of outflow 2, is possibly of Class 0 (Froebrich et al. fshe03 (2003)) and has a luminosity of about 16 solar luminosities. Froebrich et al. (fshe03 (2003)) further estimate a final source mass of about one solar mass. In their Fig. 13 they present evolutionary tracks for the outflow and source luminosity. This leads to an estimate of the total shock luminosity of about 14 L⊙, and thus (taking 10% of the emission in H2 lines, 10% of these in the 1 – 0 S(1) line and AV = 10 mag) to 12 10-3 L⊙ in the 1 – 0 S(1) line. Here we measure 19 10-3 L⊙ for the whole outflow. Taking into account the ’unusual’ conditions of the south-western lobe (see Sec. 3.2, Outflow 2) and calculating the luminosity by using twice the north-eastern lobe we get 14 10-3 L⊙. This is in very good agreement with the model predictions, giving further strong evidence of IRAS21246+5743 being a Class 0 object.
4 Conclusions
We have observed the IC 1396 W globule in J, H, K’, and the NB2122 narrow band filter centred on the 1 – 0 S(1) line of molecular hydrogen. By means of the continuum subtracted NB2122 image we were able to detect three molecular outflows in the field. Two of them were not previously known. The flow axes are parallel within 3 degrees in projection. More and more such aligned outflows are discovered in small ( 1 pc) star forming regions/globules. Magnetic fields cannot consistently explain all these cases. Thus, a parallel initial angular momentum of these objects, caused by the fragmentation of small clouds/globules, might be the reason for the alignment.
With our NIR photometry, IRAS and ISOPHOT observations we are able to identify the driving sources of the outflows. Two flows are driven by more evolved Class 1/2 objects. The brightest outflow is driven by the Class 0 source IRAS21246+5743. We measured an intrinsic H2 luminosity of 19 10-3 L⊙ which confirms the Class 0 nature of this object. The other outflow luminosities fit well into the evolutionary model of Smith (s99 (1999, 2000, 2002)) for the evolution of outflow and source luminosities.
The asymmetry in brightness and lenght of the main outflow, driven by IRAS21246+5743, can be well explained in consideration of the findings of Froebrich et al. (fshe03 (2003)). At the south-western end the flow enters a clump of denser material that causes stronger shocks with brighter H2 emission and at the same time decelerates the jet.
Our JHK photometry of the globule reveals a population of young stars. They are situated mainly in a dense embedded subcluster, about 2.5′ south-west of IRAS21246+5743. This cluster coincides with a clump of denser gas. The other young stars are almost uniformely distributed in the observed field. The spread of the red sources over almost the whole globule indicates that star formation takes place uniformely distributed. It is concentrated, nevertheless, in a region with strong FIR emission.
Acknowledgements.
It is a pleasure to thank A.P. Hatzes and J. Eislöffel for providing observing time within the framework of their campaign. We greatfully acknowledge the support from H. Linz and A. Sasse, as well as valuable comments from the anonymous referee. A. Scholz received travel fund from the DFG HA3279/2-1 project.References
- (1) Aspin, C., Sandell, G., Russel, A.P.G. 1994, A&AS, 106, 165
- (2) Bertin, E., Arnouts, S., 1996, A&AS, 117, 393
- (3) Bessell, M. S., Brett, J. M., 1988, PASP, 100, 1134
- (4) Codella, C., Bachiller, R., Nisini, B., Saraceno, P., Testi, L. 2001, A&A, 376, 271
- (5) Froebrich, D., Smith, M.D., Hodapp, K.-W., Eislöffel, J. 2003, submitted
- (6) Herbst, T.M., Birk, C., Beckwith, S.V.W., Hippler, S., McCaughrean, M.J., Mannucci, F., Wolf, J. 1993, Proc. SPIE, 1946, 605
- (7) Hodapp, K.-W. 1994, ApJS, 94, 615
- (8) Kamazaki, T., Saito, M., Hirano, N., Umemoto, T., Kawabe, R. 2003, ApJ, 584, 357
- (9) Kirkpatrick, J.D., Reid, I. N., Liebert, J., Gizis, J.E. Burgasser, A.J., Monet, D. G.; Dahn, Conard C., Nelson, B., Williams, R. J., 2000, AJ, 120, 447
- (10) Mathis, J. S., 1990, ARA&A, 28, 37
- (11) Matthews, T.J. 1979, A&A, 75, 345
- (12) Mc Caughrean, M.J., Rayner, J.T., Zinnecker, H. 1994, AJ, 436, L189
- (13) Nisini, B., Massi, F., Vitali, F., Giannini, T., Lorenzetti, D., Di Paola, A., Codella, C., et al. 2001, A&A, 376, 533
- (14) Osterbrock, D.E. 1957, ApJ, 125, 622
- (15) Saito, M., Kawabe, R., Ishiguro, M., Miyama, S.M., Hayashi, M., Handa, T., Kitamura, Y., et al. 1995, ApJ, 453, 384
- (16) Schwartz, R.D., Gyulbudaghian, A.L., Wilking, B.A. 1991, ApJ, 370, 263
- (17) Smith, M.D., 1999, Astrophys. and Space Sci., 261, 169
- (18) Smith, M.D., 2000, IAJ, 27, 25
- (19) Smith, M.D., 2002, in The Origins of Stars and Planets: The VLT View, ed. João Alves und Mark McCaughrean
- (20) Stetson, P. B., 1987, PASP, 99, 191
- (21) Sugitani, K., Fukui, Y., Ogura, K. 1991, ApJSS, 77, 59
- (22) Walborn, N.R., Panek, R.J. 1984, ApJ, 286, 718
- (23) Wamsteker, W. 1981, A&A, 97, 329
- (24) Weikard, D., Wouterloot, J.G.A., Castets, A., Winnewisser, G., Sugitani, K. 1996, A&A, 309, 581
- (25) Wouterloot, J.G.A., Brand, J. 1989, A&AS, 80, 149