The faint supernova remnant G 34.7-0.4 (W44)
Flux calibrated images of the known supernova remnant G 34.7-0.4 in basic optical emission lines are presented. The low ionization images show a relatively flat flux distribution. The diffuse and patchy morphology of the detected optical emission may indicate the presence of turbulent magnetic fields. Typical observed HN ii fluxes are 8 erg s-1 cm-2 arcsec-2, while the S ii fluxes are lower around 4 erg s-1 cm-2 arcsec-2. Emission in the medium ionization line of O iii5007 Å is not detected within our sensitivity limits, probably due to the heavy extinction towards the remnant. The long–slit spectra reveal strong S ii and N ii emission relative to H and moderate O i6300 Å emission. Shock velocities in the range of 110–150 km s-1 and low electron densities are estimated. Archival MSX infrared data show emission in the south and west areas of the remnant matching rather well the optical and radio emission.
Key Words.:
ISM: general – ISM: supernova remnants – ISM: individual objects: G 34.7-0.41 Introduction
The radio emission from G34.7-0.4 (W44) is non–thermal (–0.4; I ) and displays a shell like morphology. The shell displays an ellipsoidal shape with the major axis oriented in the south–east to north–west direction and an extent of 35′26′ (e.g. Jones et al. jon93 (1993), Giacani et al. gia97 (1997)). The strongest filamentary radio emission is observed in the eastern half of the remnant, while Kundu & Velusamy (kun72 (1972)) found that the projected magnetic field distribution is quite uniform in the northeast areas of the remnant. The X–ray images of the object reveal a centrally brightened morphology with the X–ray emission bounded by the radio emission (Rho et al. rho94 (1994)). Temperature measurements of the hot gas lie in the range of 0.7–1.0 keV, while the neutral hydrogen column density is 1022 cm-2 (Harrus et al. har97 (1997), Jones et al. jon93 (1993)). The 21 cm line observations of Koo & Heiles (koo91 (1991)) revealed the presence of an H i shell associated with W44 expanding with a velocity of 150 km s-1, and carrying 81044 erg of kinetic energy.
Narrow band optical images of the remnant have been presented by Rho et al. (rho94 (1994)) and Giacani et al. (gia97 (1997)) in the emission lines of HN ii and S ii. These images show the diffuse nature of the optical emission, its low surface brightness and a satisfactory degree of correlation with the radio emission. Interest on this remnant was further raised by the discovery of a 267 ms pulsar at a distance of 3 kpc and a characteristic spin–down age of 20000 yr (Wolszczan et al. wol91 (1991)). Subsequent deep X–ray observations by ASCA and Chandra in the vicinity of the pulsar lead to the discovery of an extended nebulosity. Its spectrum is hard and can be described by a steep power–law model (Harrus et al. har96 (1996), Petre et al. pet02 (2002)). The emission around the pulsar is considered to originate from a synchrotron nebula powered by PSR B1853+01.
Our current view of W44 consists of a remnant in the radiative phase of its evolution with a radius of 12 pc at a distance of 2.5 kpc (Cox et al. cox99 (1999)). Thermal conduction has, most likely, altered the interior density and temperature distributions from those expected by an adiabatic remnant. The progenitor star exploded 20000 yr ago releasing 1051 erg into an interstellar medium (ISM) of relatively high density (3–6 cm-3). The ISM density is not uniform but displays a significant gradient perpendicular to the major axis of the remnant with a scale height of 22 pc (Cox et al. cox99 (1999), Shelton et al. she99 (1999)).
In this work we present flux calibrated images in the optical emission lines of HN ii, S ii and O iii as well as long–slit spectra at three different locations of W44. In Sect. 2 we provide information about the observations and data analysis, while in Sect. 3 and 4 the results of the imaging and spectroscopic observations are presented. Finally, we discuss the properties of the supernova remnant and the environment into which lies in Sect. 5.
2 Observations
| Slit centers | Exp. timesa | ||
|---|---|---|---|
| (No of spectrab) | |||
| 18h55m25s | 01°32′04″ | 7200 (2) | |
| 18h55m59s | 01°05′18″ | 7800 (2) | |
| 18h55m24s | 01°24′44″ | 7800 (2) |
a Total exposure times in sec
b Number of spectra obtained
| Area I | Area II | Area III | |||||
| Line (Å) | Fa,b | I | Fa,b | I | Fa,b | I | |
| 4861 H | – | 100 | – | 100 | 12 (3) | 100 | |
| 4959 O iii1 | – | – | – | – | – | – | |
| 5007 O iii2 | 10d (3) | 901 | – | – | – | – | |
| 6300 O i1 | 23 (6) | 108 | 26 (5) | 123 | 59 (7) | 279 | |
| 6364 O i2 | 7 (4) | 25 | 8 (2) | 36 | 28 (4) | 119 | |
| 6548 N ii1 | 28 (5) | 85 | 26 (8) | 80 | 20 (4) | 61 | |
| 6563 H | 100 (18) | 300 | 100 (30) | 300 | 100 (19) | 300 | |
| 6584 N ii2 | 86 (15) | 249 | 84 (25) | 242 | 81 (15) | 234 | |
| 6716 S ii1 | 80 (15) | 186 | 97 (29) | 228 | 75 (16) | 176 | |
| 6731 S ii2 | 59 (12) | 134 | 71 (22) | 162 | 50 (10) | 114 | |
| Absolute H fluxe | 3.8 | 4.1 | 2.9 | ||||
| S ii /H | 1.39 [0.11] | 1.07 | 1.68[0.07] | 1.29 | 1.25[0.10] | 0.97 | |
| N ii/H | 1.15 [0.09] | 1.11 | 1.12[0.06] | 1.08 | 1.08[0.09] | 1.04 | |
| S ii1/S ii2 | 1.36 [0.15] | 1.38 | 1.36[0.08] | 1.40 | 1.51[0.18] | 1.55 | |
| ne (1) | 220 cm-3 | 140 cm-3 | 200 cm-3 |
a Fluxes uncorrected for interstellar extinction and relative to F(H)=100
b Listed fluxes are a signal to noise weighted average of the individual fluxes
c Corrected for interstellar extinction assuming E(B–V)=3.28 or c=4.94
d Detected only in one of the two spectra
e In units of erg s-1 cm-2 arcsec-2
Numbers in parentheses represent the signal to noise ratio
of the quoted fluxes
1 errors are given in square brackets
2.1 Optical images
The supernova remnant W44 was observed with the 0.3 m Schmidt–Cassegrain telescope at Skinakas Observatory, Crete, Greece on July 7 and August 7–8, 2002. The observations were performed with a 1024 1024 Thomson CCD which provides a 70′ 70′ field of view and an image scale of 4″ per pixel. The remnant was observed through the HN ii, S ii, and O iii filters. Astrometric solutions were calculated for all data frames using the HST Guide star catalogue (Lasker et al. las99 (1999)) and were subsequently projected to a common origin on the sky before any arithmetic operation. The equatorial coordinates quoted in this work refer to epoch 2000.
Standard IRAF and MIDAS routines were employed for the reduction of the data. All frames were bias subtracted and flat-field corrected using a series of well exposed twilight flat–fields. The absolute flux calibration was performed through observations of a series of spectrophotometric standard stars (HR5501, HR7596, HR7950, HR9087 and HR8634; Hamuy et al. ham92 (1992), ham94 (1994)). The digital data were retrieved from the European Southern Observatory (ESO) and were folded with the appropriate filter transmission curve, which is known for the specific focal ratio of the 0.3 m telescope.For the given airmass, exposure time of each calibration star and the instrumental setup, it is possible to predict the expected count rate. A least squares fit for the expected and observed count rates allows us to calculate the zero point magnitude and the atmospheric extinction in the specific filter. These coefficients are then applied to the data frames for absolute flux calibration (see also Jacoby et al. jac87 (1987)).
2.2 Optical spectra
Long–slit spectra were obtained on July 6, 7, and 8, 2002 with the 1.3 m Ritchey–Cretien telescope at Skinakas Observatory. The data were taken with a 1300 line mm-1 grating and a 800 2000 SITe CCD covering the range of 4750 Å – 6815 Å. The projected slit width on the sky is 77, while its length is 7′.9. The coordinates of the slit centers, the number of available spectra from each location and the total exposure times are given in Table 1. The spectrophotometric standard stars HR5501, HR7596, HR7950, HR9087, and HR8634 were observed for the absolute calibration of the source spectra. The spectra were reduced with the IRAF software and specifically, with the packages twodspec, longslit and apextract. The sufficient coverage in airmass of the calibration stars allowed to determine both the sensitivity function of the instrument response and the dependence of the airmass on the wavelength. Subsequently, these corrections were applied to the data spectra.
3 The imaging observations
3.1 The HN ii and S ii line images
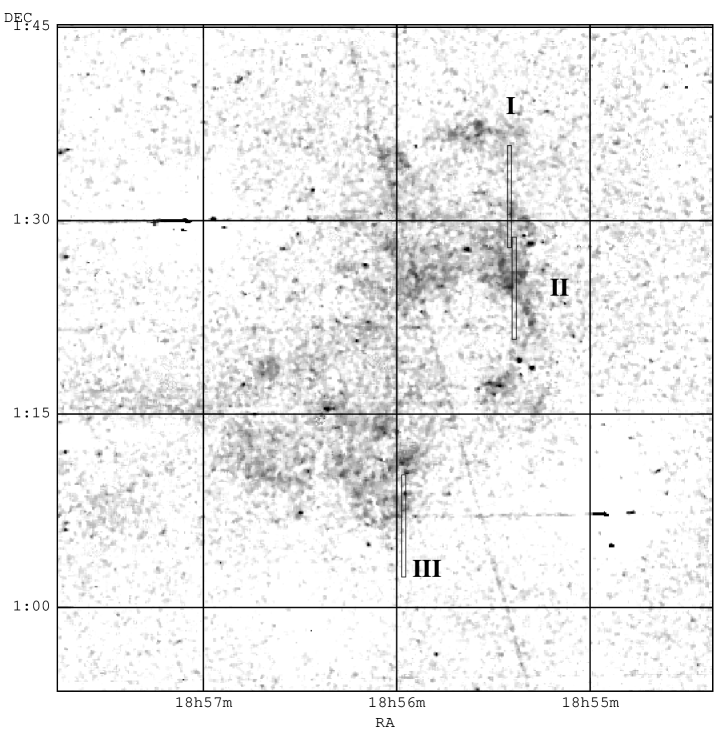
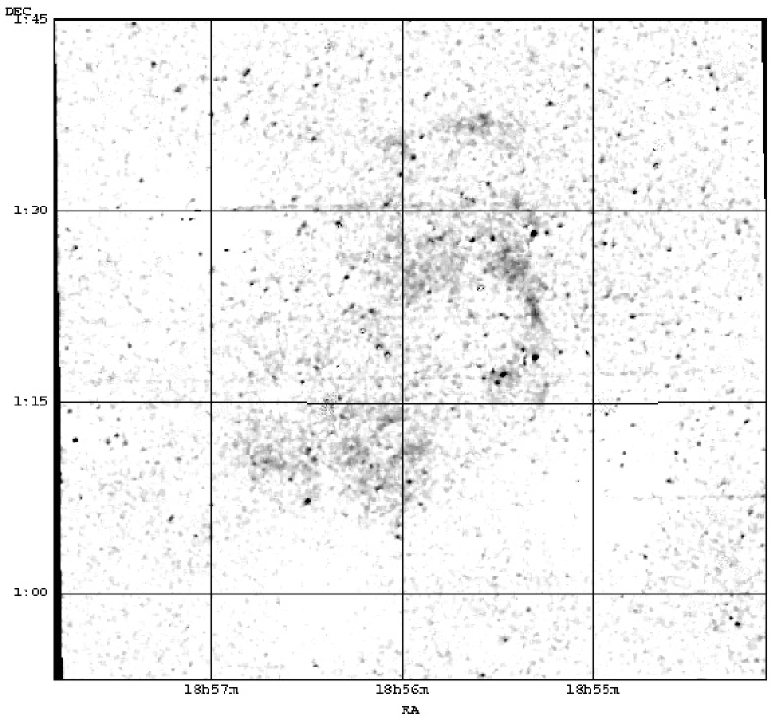
The low ionization images covering the H, N ii, and S ii lines (Fig. 1 and 2) display a diffuse and patchy morphology already noted by Giacani et al. (gia97 (1997)) and Rho et al. (rho94 (1994)). The flux in each of the HN ii and S ii images appears to have a smooth distribution over the extent of the remnant. Since our images are flux calibrated, we can measure an average HN ii flux of 8 erg s-1 cm-2 arcsec-2 over several locations of the remnant with faint diffuse emission emitting at a level of 3 erg s-1 cm-2 arcsec-2. The estimated H flux is 4 erg s-1 cm-2 arcsec-2 since the N ii6548, 6584 Å lines contribute equally well in the HN ii filter and we have assumed that the H and N ii fluxes are of comparable strength (e.g. Fesen et al. fes80 (1980), Mavromatakis et al. mav02 (2002); see also §4). Measuring the observed sulfur flux over the same locations we find an average value of 4 erg s-1 cm-2 arcsec-2, while the faintest diffuse emission amounts to a flux of 2 erg s-1 cm-2 arcsec-2. However, the two sulfur lines do not contribute equally in the filter bandpass and in order to account for this effect we assume a S ii6716Å/S ii6731 Å ratio of 1.4, appropriate for middle aged remnants. Consequently, the average total sulfur flux is estimated around 6 erg s-1 cm-2 arcsec-2. Although the observed emission in the HN ii and S ii lines is weak in terms of absolute flux, the sulfur flux is quite strong relative to H. Using the calibrated images to estimate the observed S ii/H ratio, it is found that it ranges from 0.9–1.8. These values are in agreement with those measured in the available long–slit spectra (§4).
3.2 The O iii image
The final O iii image does not show any emission from the remnant and thus, it is not shown here. The total exposure time of 7200 s and the hardware configuration used did not allow the detection of possible O iii5007 Å emission from W44 and the 3 upper limit set is 1.5 erg s-1 cm-2 arcsec-2 over its whole area. This upper limit is consistent with the spectroscopic measurements.
4 The long–slit spectra from G 34.7-0.4
Long–slit spectra were obtained for the first time from this faint remnant. Approximate slit positions are shown in Fig. 1 where it is seen that locations I, II, and III mainly focus on the brighter areas of the remnant in the south, and north–west. Especially, location II was chosen due to the stronger S ii emission in that area. The measured fluxes from individual lines along with some derived quantities are given in Table 2. Since a reliable Balmer decrement measurement towards G 34.7-0.4 is not available, we adopt the statistical relation
| (1) |
given by Predehl and Schmitt (pre95 (1995)) to determine the color excess. Assuming a hydrogen column density of 1.77 cm-2 (Tsunemi & Enoguchi tsu02 (2002)) we find an E(B–V) of 3.28. This column density is consistent with the total galactic column density of 1.7–1.91022 cm-2, calculated with the FTOOLS command “nh” based on data from Dickey & Lockmann (dic90 (1990)). The equivalent logarithmic extinction is 4.94 and this value was used to correct all observed spectra for interstellar extinction. This, of course, assumes a constant extinction over the remnant but it is possible that the extinction may vary. We note here the presence of LDN 617 in the south areas of G 34.7-0.4 (Lynds lyn62 (1962)). However, in the absence of detailed and accurate measurements we assume it is constant. It is evident from Table 2 that the heavy extinction greatly affects the bluer lines making them very hard to detect.
All spectra are characterized by the low but fairly constant H flux and the strong sulfur flux relative to H (S ii/H1.1–1.7). The ratio of the two sulfur lines approaches the low density limit in all cases and is estimated that the electron densities over the specific locations are less than 200 cm-3. Emission at H 4861 Å is marginally present in one set of spectra (location III) and may be a spurious detection given its low signal to noise. The failure to detect the H line prevents us from checking on whether the spectra originate from fully developed or incomplete shock structures. In the following, we will assume that the radiative shock structures are complete. In addition, the medium ionization line of O iii 5007 Å appears to be absent from the optical spectra. Emission at the 3 confidence level in this line is detected only in one of the two spectra taken from position I suggesting a probable statistical fluctuation (Table 2). The 3 upper limit on the O iii emission in all spectra is 0.4 erg s-1 cm-2 arcsec-2, roughly a factor of 10 less than the typical H flux. The O ii6300, 6364 Å line fluxes from Area III should be treated with caution since there are indications for improper background subtraction.
Note here that the signal to noise ratios given in Table 2 do not incorporate errors due to the calibration process which are 10%.
5 Discussion
The known supernova remnant G 34.7-0.4 lies in the galactic plane at a distance of 2.5 kpc (Cox et al. cox99 (1999)). As a result, short wavelengths suffer significant extinction rendering optical measurements a difficult task. Earlier optical observations mainly focused on the morphology of the optical emission and provided estimates of the fluxes in the HN ii and S ii lines (Giacani et al. gia97 (1997)).
In this work we present flux calibrated images of this faint remnant in major emission lines and long–slit spectra. The typical flux levels in the HN ii and S ii images are 8 and 4 erg s-1 cm-2 arcsec-2, while emission at the bluer line of O iii5007Å was not detected at the sensitivity limit of our observations. Note that for a color excess of 3.28 (see §4), the observed intensity of the O iii line would be 30 times lower than that of the H line, even if they had equal intrinsic intensities. It is also evident from the typical fluxes of the low ionization lines that the observed S ii flux is quite strong relative to H (see also §3.1). The morphology of the optical emission although diffuse and patchy (Figs. 1 and 2) is very well correlated with the radio emission, mainly in the west (Giacani et al. gia97 (1997)). The nature of the optical emission may be attributed to the presence of radiative shocks seen face–on due to the orientation of the interstellar “clouds” or to a patchy interstellar medium towards G 34.7-0.4. However, line–of–sight extinction variations cannot account for the overall appearance of the remnant, while it may not be clear why all these “clouds” should be oriented with this specific geometry. Another possibility may involve a turbulent magnetic field. The component parallel to the shock front will be compressed not only in the transition region but also further in the recombination zone as the gas cools. The field component perpendicular to the shock front will not be affected and thus, there will be substantial variations of the magnetic pressure within the recombination zone. These variations will affect inversely the gas density distribution and consequently, the optical line emissivity will display a clumpy and irregular appearance (Raymond & Curiel ray95 (1995)).
The optical spectra showing strong S ii, N ii and H emission and the calibrated optical images suggest that radiative shocks are present in W44. The neutral oxygen line at 6300Å is detected although it is difficult to establish accurately the actual source flux because the night sky is very bright in this line. In an attempt to determine the physical conditions giving rise to the optical emission we would have to explore the family of models appropriate for our case (e.g. Cox & Raymond cox85 (1985), Raymond et al. ray88 (1988)). Unfortunately, UV spectra and/or the O iii5007Å and O ii3727Å lines are not available and the actual family of radiative shocks cannot be confidently established. The observed spectra are characterized by the strong N ii6584 Å, S ii6716, 6731Å line emission relative to H, the large sulfur line ratios implying low electron densities and the presence of moderate O i6300 Å emission. The latter line is marginally present in 100 km s-1 shocks, while in shocks faster than 150 km s-1 less flux in the N ii, O i and S ii lines is produced. Thus, we estimate shock velocities in the range of 110–150 km s-1 (Cox & Raymond cox85 (1985)). The ionization state of the preshocked gas cannot be resolved with the currrent data. The strong sulfur emission and the low electron densities may suggest the presence of moderate magnetic fields. Weak magnetic fields (0.1–1 G) allow for large compression factors in the recombination zone, while magnetic fields higher than 5 G suppress the compression resulting in lower electron and particle densities (e.g. Cox cox72 (1972), Raymond ray79 (1979), Raymond et al. ray88 (1988)). Adopting electron densities around 200 cm-3 and the estimated shock velocities, we find preshock cloud densities of the order of 3 atoms per cm3 using the relation given by Fesen & Kirshner (fes80 (1980)). However, this relation assumes negligible magnetic field and since it is probable that moderate magnetic fields are present what is obtained is actually a lower limit to the preshock could density. Shelton et al. (she99 (1999)) estimate the velocity of the primary shock along the tenuous end to be 300 km s-1. Assuming pressure equilibrium between the ISM and the interstellar clouds, a density contrast of 4–7 or greater is calculated.
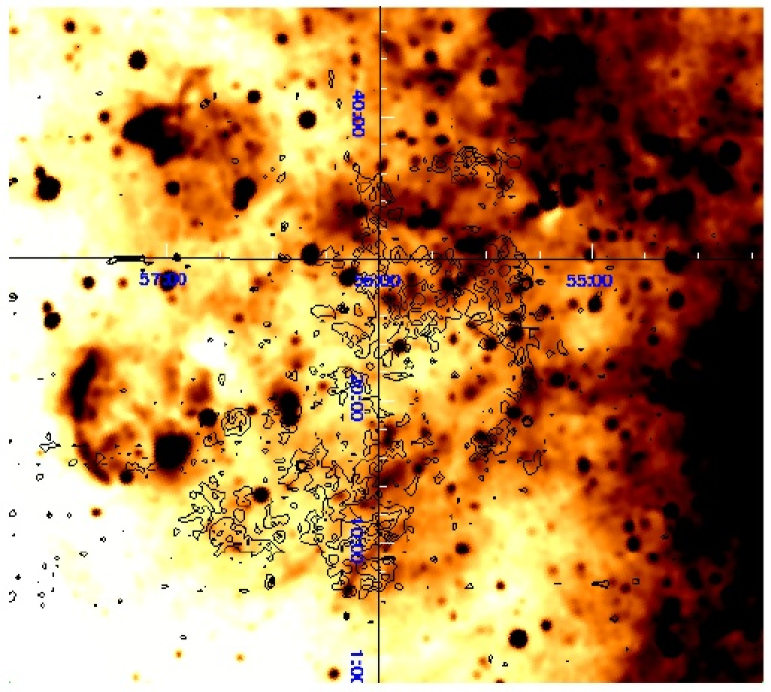
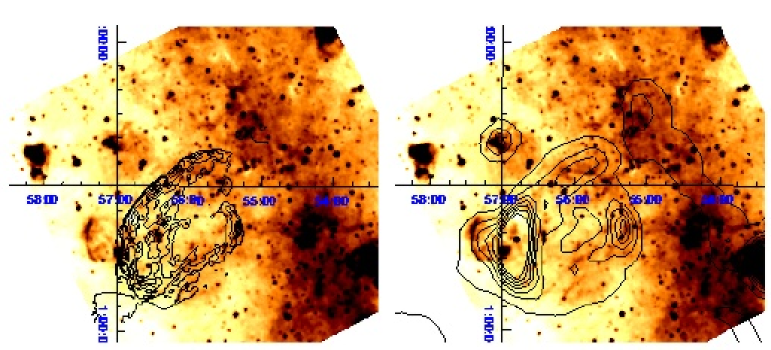
Thermal emission from dust grains attributed to G 34.7-0.4 has been detected in the infrared by the IRAS satellite (Arendt are89 (1989), Giacani et al. gia97 (1997)). The dust grains can be collisionally heated by the primary blast wave which then emit in the infrared. Emission was present in all four IRAS bands but the moderate resolution of 2′ did not allow a detailed comparison of the optical and/or radio data with the dust emission. However, the Midcourse Space Experiment (111The MSX data were retrieved from the NASA/IPAC Infrared science archive at http://irsa.ipac.caltech.eduMSX) provided data of higher sensitivity and spatial resolution (20″) than the IRAS data. In Fig. 3 we show the MSX image at 8.28 m with the optical emission in HN ii as the overlaid contours. Faint filamentary structures appear to correlate well with the optical emission. In fact, there is an arc–like structure in the infrared which is partially correlated with the optical and radio emission of the remnant (Figs. 3 and 4). The arc originates from 18h55m33s, and 01°15′20″, runs to the north for 18′ and then turns to the east up to 18h56m13s and 01°32′33″. The approximate radius of curvature of this arc is 11′. In addition, filamentary structures in the south also seem to match the radio emission at 1442 MHz (Fig. 4). These structures are a few arcminutes long and 0′.5 wide. If these structures are actually correlated to G 34.7-0.4 then temperatures around 106 K would also be expected at the outer areas of the remnant. Another very interesting feature is located further to the east at 18h57m25s and 01°18′15″ extending for 10′ in the south–north direction. Even though, the high resolution 1442 MHz data extend only up to 18h57m20s, the lower resolution 4850 MHz data match very well the position and curvature of this infrared filamentary structure. However, the nature of this structure (thermal or non–thermal) and its association to G 34.7-0.4 cannot be reliably determined using the currently available data. Dedicated radio spectral observations are needed to determine whether the extent of the remnant is larger in the east–west direction than we currently assume or the observed emission is simply projected on G 34.7-0.4. The irregular boundary of the radio emission in the west, north–west may be indicative of an interaction with the clouds in this area (Fig. 4, and also Seta et al. set98 (1998)). The interaction with molecular clouds in the east may be less extended (e.g. Wootten woo77 (1977)) explaining the filamentary radio emission in this area. However, the possibility of interaction in the west is an open issue (e.g. Cox et al. cox99 (1999)) and more kinematic data would be needed. For example, high resolution echelle spectra around the remnant’s boundary would help to validate or discard this hypothesis by establishing the range of velocities in the east and the west.
6 Conclusions
Weak and diffuse emission is the major characteristic of the field of the supernova remnant G 34.7-0.4. The long–slit spectra verify the shock heated nature of the detected radiation and suggest low electron densities. The velocities of the shocks travelling into the interstellar clouds are in the range of 110–150 km s-1. The morphology of the images and the low electron densities implied by the spectra may indicate the presence of moderate magnetic fields. High resolution infrared data are rather well correlated with the optical and radio emission from G 34.7-0.4.
Acknowledgements.
The authors would like to thank the referee for his comments and suggestions and E. B. Giacani and J. J. Condon for providing the 1442 MHz and 4850 MHz digital data, respectively. Skinakas Observatory is a collaborative project of the University of Crete, the Foundation for Research and Technology-Hellas and the Max-Planck-Institut für Extraterrestrische Physik. This research made use of data products from the Midcourse Space Experiment. Processing of the data was funded by the Ballistic Missile Defense Organization with additional support from NASA Office of Space Science. This research has also made use of the NASA/ IPAC Infrared Science Archive, which is operated by the Jet Propulsion Laboratory, California Institute of Technology, under contract with the National Aeronautics and Space Administration.References
- (1) Arendt, R. G. 1989, ApJS, 70, 181
- (2) Condon, J. J., Broderick, J. J., Seielstad, G. A., Douglas, K., Gregory, P. C., 1994, AJ, 107, 1829
- (3) Cox, D. P., Shelton, R. L., Maciejewski, W., Smith, R. K., Plewa, T., Pawl, A., R zyczka, M., 1999, ApJ, 524, 179
- (4) Cox, D. P., and Raymond, J. C., 1985, ApJ, 298, 651
- (5) Cox, D. P., 1972, ApJ, 178, 143
- (6) Dickey, J. M., and Lockman, F., J., 1990, ARAA, 28, 215
- (7) Fesen R. A., Kirshner R. P., 1980, ApJ, 242, 1023
- (8) Giacani, E. B., Dubner, G. M., Kassim, N. E., Frail, D. A., Goss, W. M., Winkler, P. F., Williams, B. F., 1997, AJ, 113, 1379
- (9) Hamuy, M., Walker, A. R., Suntzeff, N. B., Gigoux, P., Heathcote, S. R. & Phillips, M. M., 1992, PASP, 104, 533
- (10) Hamuy, M., Suntzeff, N. B., Heathcote, S. R., Walker, A. R., Gigoux, P., Phillips, M. M., 1994, PASP, 106, 566
- (11) Harrus, I. M., Hughes, J. P., Helfand, D. J., 1996 ApJ, 464, L161
- (12) Harrus, I. M., Hughes, J. P., Singh, K. P., Koyama, K., Asaoka, I., 1997, ApJ, 488, 781
- (13) Jacoby, G. H., Quigley, R. J., Africano, J. L., 1987, PASP, 99, 672
- (14) Jones, L. R., Smith, A., Angellini, L., 1993, MNRAS, 265, 631
- (15) Kaler, J. B., 1976, ApJS, 31, 517
- (16) Koo , B.-C., Heiles, C., 1995, ApJ, 442, 679
- (17) Koo , B.-C., Heiles, C., 1991, ApJ, 382, 204
- (18) Kundu, M. R., Velusamy, T., 1972, A&A, 20, 237
- (19) Lasker, B. M., Russel, J. N., & Jenkner, H., 1999, in the HST Guide Star Catalog, version 1.1-ACT, The Association of Universities for Research in Astronomy, Inc.
- (20) Lynds, B. T., 1962, ApJS, 7, 1
- (21) Mavromatakis F., Boumis P., Papamastorakis P., Ventura J., 2002, A&A, 388, 355
- (22) Petre, R., Kuntz, K.D., Shelton R.L., 2002, ApJ, 579, 404
- (23) Predehl, P., and Schmitt, J. H. M. M., 1995, A&A, 293, 889
- (24) Raymond, J. C., Hester, J. J., Cox, D., Blair, W. P., Fesen, R. A., Gull, T. R., 1988, ApJ, 324, 869
- (25) Raymond, J. C., 1979, ApJS, 39, 1
- (26) Raymond, J., C., and Curiel, S., 1995, The Fifth Mexico-Texas Conference on Astrophysics: Gaseous Nebulae and Star Formation, Vol. 3, p. 199
- (27) Rho, J., Petre, R., Schlegel, E. M., Hester, J. J., 1994, ApJ, 430, 757
- (28) Seta, M., Hasegawa, T., Dame, T. M., Sakamoto, S., Oka, T., Handa, T., Hayashi, M., Morino, J.-I., Sorai, K., Usuda, K. S., 1998, ApJ, 505, 286
- (29) Shelton, R. L., Cox, D. P., Maciejewski, W., Smith, R. K., Plewa, T., Pawl, A., R zyczka, M., 1999, ApJ, 524, 192
- (30) Tsunemi, H., and Enoguchi, H., Cospar 2002, Houston, Texas
- (31) Wolszczan, A., Cordes, J. M., Dewey, R. J., 1991, ApJ, 372, L99
- (32) Wootten, H. A., 1977, ApJ, 216, 440