A search for the optical and near–infrared counterpart of the accreting millisecond X–ray pulsar XTE J1751–305
Abstract
We have obtained optical and near–infrared images of the field of the accreting millisecond X–ray pulsar XTE J1751–305. There are no stars in the 0.7” error circle (0.7” is the overall uncertainty arising from tying the optical and X–ray images and from the intrinsic uncertainty in the Chandra X–ray astrometric solution). We derive limiting magnitudes for the counterpart of R23.1, I21.6, Z20.6, J19.6, K19.2. We compare these upper limits with the magnitudes one would expect for simple models for the possible donor stars and the accretion disk subject to the reddening observed in X–rays for XTE J1751–305 and when put at the distance of the Galactic Centre (8.5 kpc). We conclude that our non–detection does not constrain any of the models for the accretion disk or possible donor stars. Deep, near–infrared images obtained during quiescence will, however, constrain possible models for the donor stars in this ultra–compact system.
keywords:
stars: individual (XTE J1751–305) — stars: neutron — X-rays: stars1 Introduction
Low–mass X–ray binaries (LMXBs) are typically old ( yr) binary systems in which a low–mass companion star () transfers matter to a neutron star or a black hole. The neutron star LMXBs are thought to be among the predecessors of the millisecond radio pulsars. Due to accretion of matter and decay of the magnetic field during the LMXB phase, the neutron star spins–up to millisecond periods (see ? for a review). However, until March 2002 only six LMXBs were known to show pulsations (see ? for a short overview), and only one of them, a transient system, was shown to have a millisecond period (SAX J1808.4–3658; ? and ?). In 2002 ? (see also ?) and ? (see also ?) discovered millisecond pulsations in two other transient sources, XTE J1751–305 and XTE J0929–314, in outburst.
There are two main reasons to search for the companion stars of accretion powered millisecond X–ray pulsars. Accretion powered millisecond X–ray pulsars have most likely accreted a substantial amount of matter as they were spun–up by accretion to a period of milliseconds. A spectroscopical determination of the radial velocity curve of the companion star yields a lower limit to the mass of the neutron star; measuring a mass of considerably more than 1.4 M⊙ for even one neutron star would imply the firm rejection of many proposed equations of state (see the discussion by ?; for an overview of the mass determinations of millisecond radio pulsars in neutron star–white dwarf binaries see ?). In order to spectroscopically measure the radial velocity of the companion star, clearly a detection of the object is first required. Secondly, at present there are three known ways to produce compact X–ray binaries (?; ?; ?; ?; ?; see Section 3 for a more elaborate account of these models). Detection of the companion star will allow us to differentiate between these different formation scenarios.
In this Paper we present the results of our search for the optical and near–infrared counterpart of the ultra–compact accreting millisecond X–ray pulsar XTE J1751–305 ( minutes; ?). Early reports on the data presented in this Paper were published by ?, ?, ?, and ?.
2 Observations and analysis
We observed the region around the accurate Chandra X–ray position of the source using the 6.5 m Magellan, the 3.8 m UKIRT, the 3.58 m NTT, and the 1.54 m Danish telescopes. A spectrum of the candidate optical counterpart presented by ? was obtained with ESO’s 3.6 m telescope at La Silla using Grism number 12 which covers 601–1032 nm. A log of the observations can be found in Table 1. In case of the near–infrared data the total exposure time is given and the dither pattern, i.e. in case of the UKIRT J band images we took 5 exposures of 60 seconds each, in between each observation the telescope was dithered; this pattern was repeated twice. In the case of the Magellan near–infrared observations we obtained J and Ks images of 60 seconds integration time each. We also obtained 11 J band images of 20 seconds integration each.
The data reduction was performed in iraf111iraf is distributed by the National Optical Astronomy Observatories. The near–infrared images (J and K band) were sky subtracted (using the sky determined from the dithered images), flatfielded, aligned, and combined to form one image per band per night. The Magellan near–infrared data have been linearised before the reduction. The optical images (R, I, and Z band) were reduced in the standard fashion. Aperture and point spread function fitting photometry were done using the packages apphot and daophot in iraf. The spectrum obtained with ESO’s 3.6 m telescope was extracted using the task apall in the package specred in iraf. All nights were photometric except for the nights of April 13 and 14, 2002 when the humidity was very high at Magellan and April 14, 2002 at UKIRT when thin cirrus was present. The J band observations during that night also suffered from a bright sky as they were obtained partially during twilight. Charge overflow from a neighbouring bright star covered the location of XTE J1751–305 on the CCD in our image obtained with the Danish telescope, rendering it impossible to determine whether a source is present or not at the Chandra X–ray location. Hence, we will not consider this observation any further.
| Telescope | Instrument | Observation date | MJD | Filters | Exposure | Airmass | Seeing |
|---|---|---|---|---|---|---|---|
| and start time (UT) | (UTC) | Bessel (except J, K(s)) | Time (s) | (arcseconds) | |||
| Danish | DFOSC | 08–04–2002 08:51 | 52372.36870 | R | 900 | 1.01 | 1.2 |
| Magellan | Classic–CAM | 09–04–2002 08:02 | 52373.33472 | Ks | 60 | 1.05 | 0.65 |
| Magellan | Classic–CAM | 09–04–2002 07:32 | 52373.31388 | J | 280 (11x20+60) | 1.05 | 0.65 |
| Magellan | MagIC | 13–04–2002 07:43 | 52377.32153 | I | 240 (3x) | 1.05 | 0.6 |
| Magellan | MagIC | 14–04–2002 08:30 | 52378.35416 | I | 30 (1x), 240 (18x) | 1.00–1.03 | 0.7 |
| UKIRT | UFTI | 14–04–2002 14:41 | 52378.61201 | J | 600 (2x5x60) | 1.6 | 0.8 |
| UKIRT | UFTI | 14–04–2002 14:55 | 52378.62161 | K | 600 (2x5x60) | 1.6 | 0.65 |
| UKIRT | UFTI | 18–04–2002 14:47 | 52382.61623 | J | 600 (2x5x60) | 1.6 | 0.65 |
| UKIRT | UFTI | 18–04–2002 15:06 | 52382.62925 | K | 600 (2x5x60) | 1.6 | 0.5 |
| NTT | SUSI2 | 18–04–2002 08:33 | 52382.35682 | R | 600 | 1.00 | 0.8 |
| NTT | SUSI2 | 18–04–2002 08:23 | 52382.34950 | I | 600 | 1.00 | 0.9 |
| NTT | SUSI2 | 18–04–2002 08:12 | 52382.34185 | Z | 600 | 1.01 | 0.8 |
| 3.6M (spec) | EFOSC | 01–05–2002 07:19 | 52395.30470 | Gr#12 0.7” slit | 1500 | 1.01 | 0.9 |
We derived an astrometric solution for the optical I band image obtained with the NTT of the field of XTE J1751–305 using the positions of 4 nearby unsaturated stars which appear in the USNO-A1.0 catalogue. The rms of the fit was 0.015”. The typical astrometric error of stars in the USNO–A1.0 catalogue is 0.25” (68 per cent confidence); the uncertainty in the X–ray position is dominated by the Chandra aspect solution (0.6”; 90 per cent confidence; ?). Hence, the overall astrometric uncertainty in the position of the errorcircle is 0.7” (90 per cent confidence). Next, we tied the astrometric solution of the I band image to the optical R and Z band and to the near–infrared J and K(s) band images by assigning the known position of several stars (from the I band) to the R, Z, J(s), or K band image; this did not increase the error in the astrometry significantly.
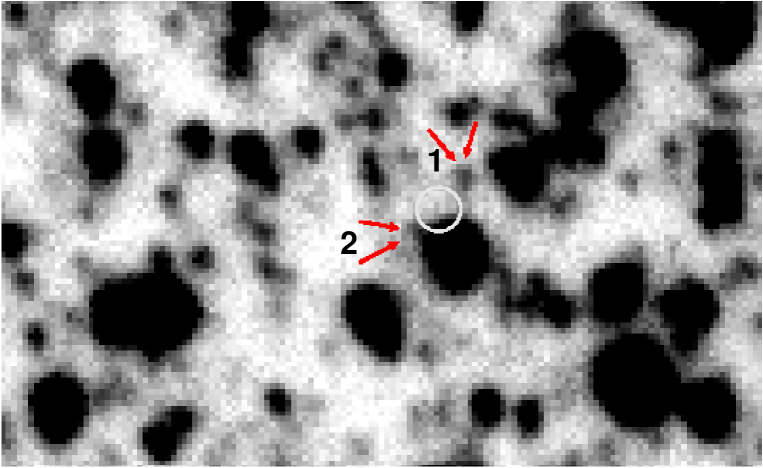
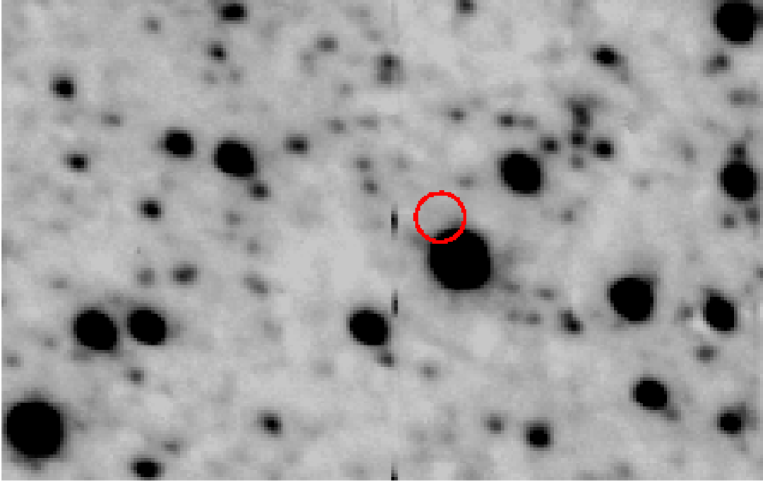
In Figure 1 (top panel) we show the R band image from our NTT observations. Separately, in Figure 1 (bottom panel) we show the near–infrared UKIRT (K band) image. From the astrometry it is clear that each of the two candidate counterparts (both indicated with two arrows in the top panel) is just outside the 90 per cent confidence error circle (? initially proposed star 1 as the counterpart but see also ?; ? proposed star 2 as the counterpart; see Figure 1). Hence, it is unlikely but not ruled out that the counterpart was detected.
We determined 3 upper limits on the presence of a star in the error circle of each of the images obtained under photometric conditions. To do this we added a simulated artificial star (created using the point spread function of the stars in the image) at the position of the error circle. The magnitude of this extra star was varied and measured using the standard photometric tasks. We define the 3 limiting magnitude as the magnitude at which the error in the magnitude of such an artificial star is 0.3 magnitudes (an 0.3 magnitude error is equivalent to a 30 per cent error on the flux measurement, i.e. a three sigma detection; see also ?). For all the images we need 3–5 trials to cover the error circle (the number of trials is different for the different images; it varies as a function of the seeing). We did not take the number of trials into account when calculating the upper limits (the error introduced by this is 0.1 magnitude). The error on the determined limiting magnitude is also 0.1 magnitude. Together with the uncertainty in the photometric zero–point (at most 0.1 magnitude) this yields an uncertainty of 0.2 magnitude in the limiting magnitudes.
For the NTT Z band image we converted the (Sloan) z’ magnitude of the observed standard star (PG0918+029D) to the UKIRT UFTI Z band using the transformation given on the UKIRT web page. However, since the NTT and the UKIRT Z band differ, and there is no cross-calibration of these two Z bands, in doing so we introduced an uncertainty in the Z band magnitudes which can be more than 0.2 magnitudes. Therefore, the Z band upper limit is given as reference only; it should be considered approximate. The upper limits are given in Table 2.
| Telescope | Observation date | Limiting magnitude |
|---|---|---|
| Magellan | April, 9, 2002 | J 19.6 |
| Magellan | April, 9, 2002 | K 18.2 |
| UKIRT | April 18, 2002 | J 19.5 |
| UKIRT | April 18, 2002 | K 19.2 |
| NTT | April 18, 2002 | R23.1 |
| NTT | April 18, 2002 | I21.6 |
| NTT | April 18, 2002 | Z20.6 |
We searched for variability in the I band magnitude for the candidate counterpart proposed by ? (star 1) by comparing the magnitudes in the Magellan and the NTT observations. The I band magnitude of star 1 is consistent with being the same during the observations. Unfortunately, the I band magnitudes of the candidate counterpart proposed by ? (star 2) could not be determined for the NTT image due to the presence of the nearby star. However, differential photometry showed that star 2 was not variable in the Magellan Sloan i’ band images taken a day apart (?).
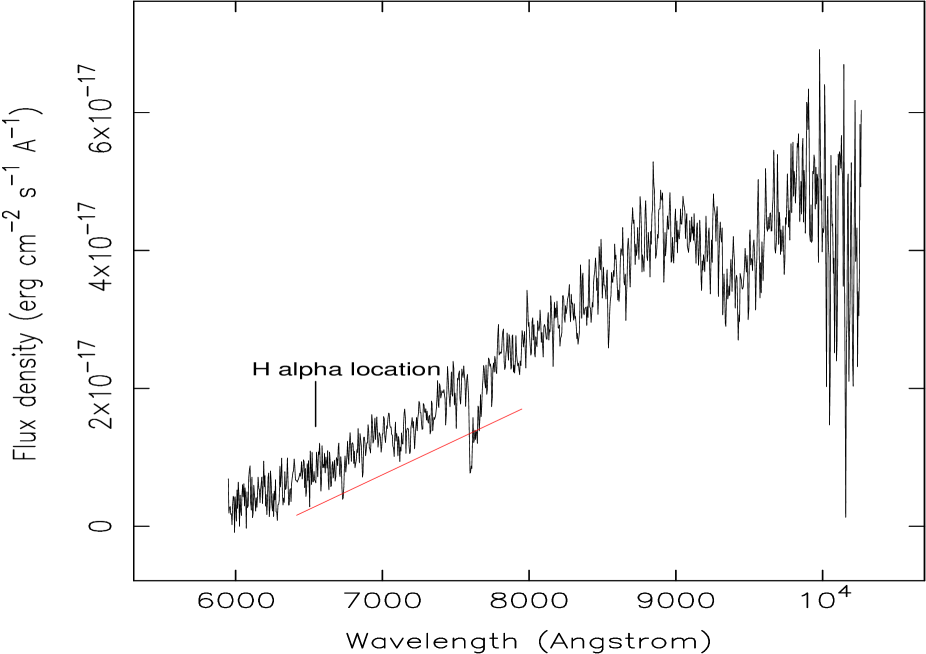
The slit we used to obtain a spectrum using ESO’s 3.6 m telescope at La Silla had a width of 0.7”. The slit orientation was such that both star 1 and 2 were in the slit as well as most of the position marked by the error circle. However, due to the seeing of 0.9” during these observations the spectrum of star 2 may have been contaminated by light of the bright nearby star. In order to investigate this we converted the magnitudes of this bright nearby star (R=18.3, I=16.2) and those of star 2 (R=22.6, I=19.2; we note that the uncertainty on these magnitudes is large due to the non–photometric conditions at the time of the Magellan I band observations; for comparison the best estimate of the magnitude of star 1 was 20.2) to flux densities and we compared the amplitude of the spectral energy distribution according to these R and I band flux densities with the amplitude of the flux calibrated spectrum. The fact that the flux density of the spectrum is higher than that of star 2 shows that the spectrum will have been contaminated with light from the bright nearby star. We note that in converting the magnitudes to fluxes we assumed that star 2 was not variable. We show the spectrum in Figure 2. We also label the position of H, although it is unclear whether the donor star of XTE J1751–305 contains hydrogen or not. The spectrum is featureless except for the atmospheric absorption feature near 7613 Angstrom and the band at 9300 Angstrom. The spectrum of star 1 was not detected, rendering further support to the conclusion that the detected light from the position of star 2 was dominated by the bright nearby star.
3 Discussion
We have obtained optical and near–infrared images of the field of the accreting millisecond X–ray pulsar XTE J1751–305. Two possible counterparts have been investigated but since they both fall outside the 90 per cent confidence Chandra error circle we conclude that neither the optical nor the near–infrared counterpart was detected. The star closest to the error circle was suggested to be the counterpart by ? (star 2 in Figure 1). We placed upper limits on the presence of a star in the error circle in the R, I, Z, J, and K band.
To evaluate the constraints these upper limits can place on the properties of the system, we consider the possible evolutionary states for XTE J1751–305. To arrive at an approximately forty minute orbital period X–ray binary there are essentially three evolutionary paths. The first starts from a detached white dwarf – neutron star binary, which is brought into contact by angular momentum loss due to gravitational wave radiation. For a discussion of this scenario for ultra–compact X–ray binaries see ?. The mass of the donor in this case would be 0.02 M⊙ and the mass transfer rate 10-11 M⊙yr-1. Recently, ? discussed XTE J1751–305 and the similar accreting millisecond X–ray pulsar XTE J0929–314 and calculated models for hot white dwarf donors, rather than the previously used zero–temperature models. He finds a luminosity of the order of 10-3 L⊙ and an effective temperature of 6000 K for the donors.
It is also possible to form a forty minute binary from a helium star that transfers matter to a neutron star (e.g. ?; ?). Such a scenario goes through the forty minute period range twice. The first time, the system goes through the orbital period of 40 minutes while the orbital period decreases, then the donor is a luminous, hot helium star of about 0.6 M⊙. The mass transfer rate at that stage is of the order of M⊙ yr-1. After having reached a period minimum of about 10 minutes, the system returns to longer periods with a dim, semi–degenerate helium star donor, not unlike the low–mass white dwarfs in the first scenario.
The third evolutionary scenario producing ultra–compact binaries involves a main sequence star close to core hydrogen exhaustion that starts mass–transfer to a neutron star (?; ?). Such a system evolves to shorter orbital periods than the standard period–minimum for hydrogen rich stars, since more and more helium enriched layers are reached when peeling off the star. These systems go through a period minimum, again of the order of 10 minutes, and form white dwarf like, low–mass, low–luminosity donor stars. ? discuss possible models for XB 1832–330 which has an orbital period close to forty minutes as well, so these models should also be applicable to XTE J1751–305. The donors in these models have masses and mass transfer rates between 0.026 and 0.14 M⊙ and 4.5 and 22 M⊙ yr-1, respectively.
The X–ray observations already place some constraints on the system. The mass–function for the companion (1.3 M⊙; ?) suggests that the companion is a low–mass star. If the companion were to be a 0.6 M⊙ helium star, the inclination should be less than 1.6∘. The two pre period–minimum models of ? with donor masses of 0.14 and 0.094 M⊙ would imply inclinations less than 6∘ and 9∘, respectively. ? infer a mass transfer rate of 2.110-11 M⊙ yr-1, assuming a neutron star radius of 10 km, a distance of 10 kpc and a recurrence time of 3.8 yr. Even though there is quite some uncertainly in the distance and recurrence time, the high mass transfer rate as expected from a helium star donor seems to be unlikely, even more so, because at such high rates the system would be expected to be a persistent X–ray source (?).
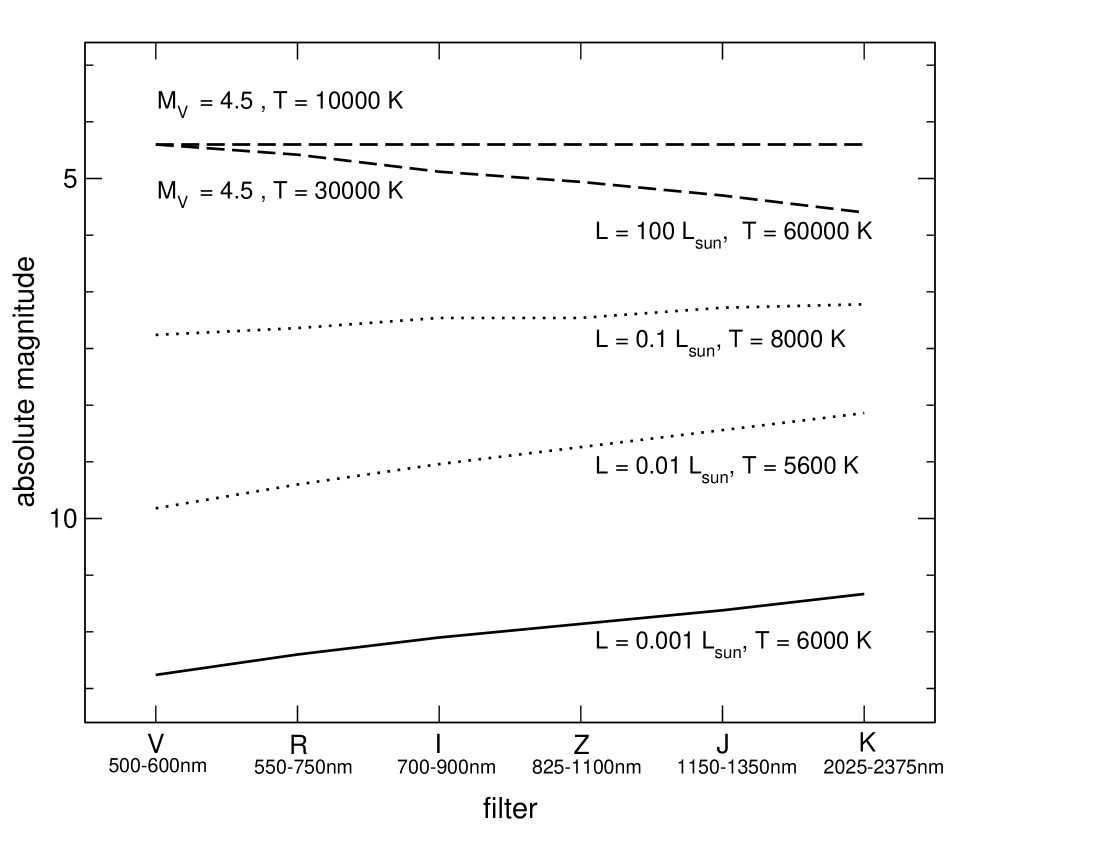
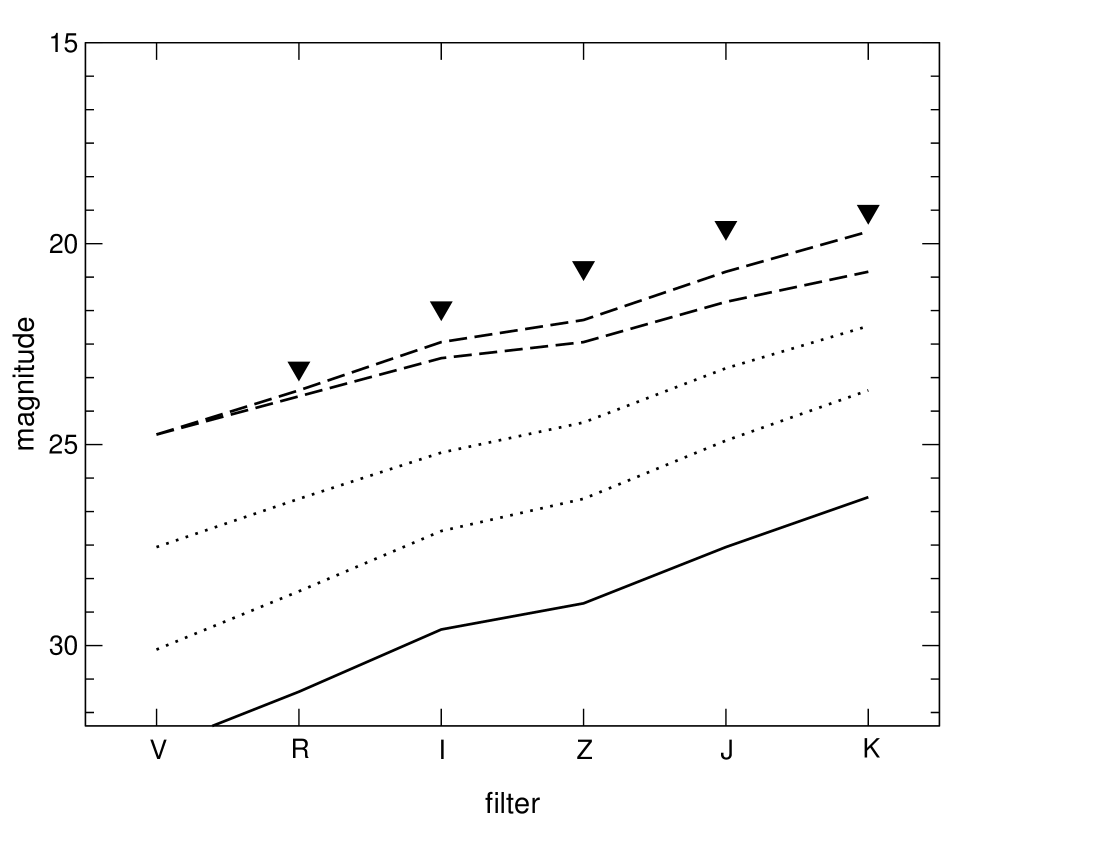
Next, we estimate the expected absolute magnitudes of the different donor star and accretion disk models in the optical and near–infrared. Since the source was still in outburst when we obtained our observations it is likely that the accretion disk dominates in the optical and near–infrared. We assumed an absolute visual magnitude of the disk of 4.5 based on the observed absolute magnitude of 4U 1916–053 of 5.3, which has a similar orbital period, but allowing for the higher X–ray luminosity of XTE J1751–305 (assuming that the disk luminosity scales with the square root of the X–ray luminosity see ?), and the fact that 4U 1916–053 has a high inclination reducing its absolute visual magnitude. Since these ultra–compact systems have to have small accretion disks, they are expected to be hot (see, ?). We estimated the absolute magnitudes for disks modelling them as simple blackbodies of 10000 and 30000 K. The results are shown in Figure 3 (dashed lines in the top panel).
The absolute magnitudes of the possible donor stars in a forty minute binary, again assuming simple blackbody spectral energy distributions, are calculated for the hot white dwarf scenario proposed by ? and for the two pre period–minimum models of ?. We did not consider their post–period minimum model because according to ? the companions in X–ray binaries will never cool down so much. Also, such a donor star would be very similar to the hot white dwarf donor model. For the hot helium star donor, we used a model having a luminosity of 100 L⊙ and T = 60000 K (see ?). Interestingly, the absolute magnitudes of this model fall on top of the 30000 K disc model. The absolute magnitudes of all four models are shown in Figure 3 (top panel).
To compare the theoretical models with our upper limits, we assumed XTE J1751–305 is near the Galactic Centre, with a distance modulus of 14.65 magnitudes. Furthermore, we inferred an absorption ( = 5.6), based on the measured = cm-2 (?) and calculated the absorption in the other bands according to the relations found by ?. The results are shown in Figure 3 (bottom panel) where the single symbols denote the upper limits. Unfortunately, our upper limits do not constrain any of the models. Further deep near–infrared imaging could, however, start to rule out several possible models for the counterpart of the accreting millisecond X–ray pulsar XTE J1751–305. According to the models presented above, XTE J0929–314, having an orbital period of 40 minutes, a reddening in the V band of 0.65 magnitudes (?) can’t have a distance much larger than the lower limit of 6.5 kpc derived by ?. Otherwise it would not have been detected in outburst at V=18.8 (?).
Acknowledgments
We would like to thank Mark Leising en Matt Wood for obtaining a B and V band image with the SARA telescope, the Director of ESO for granting the DDT time which made the ESO observations possible, and the referee for constructive comments.
References
- Bhattacharya 1995 Bhattacharya D., 1995, Millisecond pulsars, eds Lewin, van Paradijs, van den Heuvel. ISBN 052141684, Cambridge University Press, 1995.
- Bildsten 2002 Bildsten L., 2002, ApJ, 577, L27
- Chakrabarty & Morgan 1998 Chakrabarty D., Morgan E. H., 1998, Nat, 394, 346
- Dickey & Lockman 1990 Dickey J. M., Lockman F. J., 1990, ARA&A, 28, 215
- Galloway et al. 2002a Galloway D. K., Chakrabarty D., Morgan E. H., Remillard R. A., 2002, ApJ, 576, L137
- Galloway et al. 2002b Galloway D. K., Morgan E. H., Remillard R. A., Chakrabarty D., 2002b, IAU Circ, 7900
- Greenhill, Giles & Hill 2002 Greenhill J. G., Giles A. B., Hill K. M., 2002, IAU Circ, 7889, 1
- Hulleman et al. 2000 Hulleman F., van Kerkwijk M. H., Verbunt F. W. M., Kulkarni S. R., 2000, A&A, 358, 605
- Jonker & van der Klis 2001 Jonker P. G., van der Klis M., 2001, ApJ, 553, L43
- Jonker et al. 2002 Jonker P. G., Nelemans G., Groot P., van der Klis M., Hjorth J., Delsanti A., Stappers B., 2002, IAU Circ, 7872, 2
- Kong et al. 2002 Kong A. K. H., Challis P., Garcia M. R., Kirshner R., 2002, The Astronomer’s Telegram, #87, 87, 1
- Markwardt & Swank 2002 Markwardt C. B., Swank J. H., 2002, IAU Circ, 7867
- Markwardt et al. 2002 Markwardt C. B., Swank J. H., Strohmayer T. E., Zand J. J. M. i., Marshall F. E., 2002, ApJ, 575, L21
- Miller et al. 2002 Miller J. M. et al., 2002, ApJ, , submitted
- Podsiadlowski, Rappaport & Pfahl 2002 Podsiadlowski P., Rappaport S., Pfahl E. D., 2002, ApJ, 565, 1107
- Rieke & Lebofsky 1985 Rieke G. H., Lebofsky M. J., 1985, ApJ, 288, 618
- Savonije, de Kool & van den Heuvel 1986 Savonije G. J., de Kool M., van den Heuvel E. P. J., 1986, A&A, 155, 51
- Thorsett & Chakrabarty 1999 Thorsett S. E., Chakrabarty D., 1999, ApJ, 512, 288
- Tsugawa & Osaki 1997 Tsugawa M., Osaki Y., 1997, PASJ, 49, 75
- Tutukov & Fedorova 1989 Tutukov A. V., Fedorova A. V., 1989, Soviet Astronomy, 33, 606
- Tutukov et al. 1987 Tutukov A. V., Fedorova A. V., Ergma E. V., Yungelson L. R., 1987, Soviet Astronomy Letters, 13, 328
- van Paradijs & McClintock 1995 van Paradijs J., McClintock J. E. Optical and Ultraviolet Observations of X-ray Binaries, p. 58, X-ray Binaries, eds. W.H.G. Lewin, J. van Paradijs, and E.P.J. van den Heuvel (Cambridge: Cambridge Univ. Press), p. 58, 1995
- Wang & Chakrabarty 2002 Wang Z., Chakrabarty D., 2002, IAU Circ, 7880, 2
- Wang et al. 2002 Wang Z., Chakrabarty D., Elliot J. L., Markwardt C. B., 2002, IAU Circ, 7874, 2
- Wijnands & van der Klis 1998 Wijnands R., van der Klis M., 1998, Nat, 394, 344
- Yungelson, Nelemans & van den Heuvel 2002 Yungelson L. R., Nelemans G., van den Heuvel E. P. J., 2002, A&A, 388, 546