A PUZZLING X-RAY SOURCE FOUND IN THE DEEP FIELD SOUTH
Abstract
In this letter we report the detection of an extremely strong X-ray emission line in the 940ks ACIS-I spectrum of . (catalog ) The source was identified as a Type 1 AGN at redshift of = 1.617, with 2.0 – 10.0 keV rest frame X-ray luminosity of 1044 ergs s-1. The emission line was detected at 6.2 keV, with an equivalent width (EW) of 4.4 keV, both quantities referring to the observed frame. In the rest frame, the line is at 16.2 keV with an EW of 11.5 keV. An X-ray emission line at similar energy ( 17 keV, rest frame) in PKS 2149306 was discovered before using ASCA data. We reject the possibility that the line is due to a statistical or instrumental artifact. The line is most likely due to blueshifted Fe-K emission from an relativistic outflow, probably an inner X-ray jet, with velocities of the order of . Other possible explanations are also discussed.
1 Introduction
Along with the 1 Ms exposure of Deep Field North (CDFN, Brandt et al. 2001, 2 Ms exposure available now, see Alexander et al. 2002), 1 Ms exposure of Deep Field South (CDFS, Rosati et al. 2002) constitute the deepest X-ray exposure of a part of the sky ever taken. With these two deep surveys, the original X-ray glow discovered by Giacconi et al. in 1962 is now almost completely resolved into individual sources. In CDFS, 346 such X-ray sources have been detected in 0.1 deg2 (Giacconi et al. 2002), most of which are extragalatic sources harboring supermassive black holes. Great interest is now focusing on studying the properties of these X-ray sources and understanding their physical nature. In this letter, we report the discovery of an extremely strong X-ray emission-line feature in one of the CDFS sources (a type 1 active galactic nucleus, or AGN, at ). The line is at 16.2 keV in the rest frame, with a huge equivalent width of 11.5 keV. Both of these parameters are highly unusual.
2 The Data
The 1 Ms exposure of CDFS was composed of eleven individual ACIS observations from Oct. 1999 to Dec. 2000. The detailed X-ray data reduction and the final catalog of the X-ray detected sources were given in Giacconi et al. (2002). , (catalog ) 6 from the center of the field, was covered by all eleven exposures. Its X-ray radial intensity profile is consistent with that of a point-source (Giacconi et al. 2002), and no other X-ray source was detected within 38.
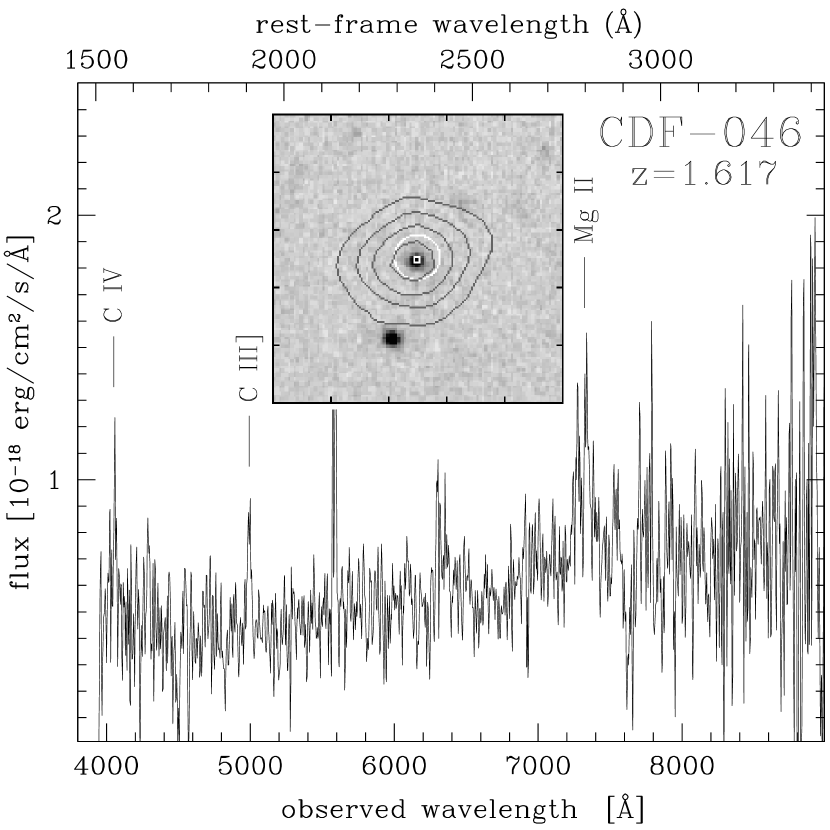
The source was covered by the deep band [(Vega)26] primary optical imaging survey of CDFS, which was obtained using the FORS1 camera on the ANTU (UT-1 at VLT) telescope. The band image cut-out of the source overplotted with X-ray flux contours is given in Figure 1. From the cut-out we can clearly see that the optical counterpart of the X-ray source is located at the center of the X-ray flux contours. The nearest other optical source is 5.6 away, far outside of the 3 positional error circle (which has a radius of 1.55, see Giacconi et al. 2002 for details). The CDFS was observed with the VLA at 1345 MHz and 4860 MHz in Oct, 1999 and Feb, 1999 respectively (Kellermann et al. in preparation). The measured flux densities at the position of CXO CDFS J033225.3-274219 at the two frequencies are 71 13 and 43 12 microJy corresponding to a spectral index of -0.41. The source is radio loud with radio to optical ratio R = 160.
Low-resolution optical spectroscopy of (catalog )was obtained with the robotic multi-slit mode of FORS-1 on the ESO Very Large Telescope 8.2m unit facility (ESO/VLT-ANTU) in November 23, 2000. A 1.2″ slit was placed on the object (seeing was 0.6″ during most of the observation). We used the lowest resolution, I150 grism and no order-separation filter. The total integration time was 2.5 hours under photometric conditions. The data were reduced following ‘standard industry practices’ and is shown in Figure 1. The object was classified with relatively high confidence as a type-I AGN, based on two certain and one marginal broad emission line (C-III, Mg-II, C-IV, with FWHM 1800 km/s). The source has an optical-to-X-ray ratio of 1.2, which is right of the average value of soft X-ray selected AGNs (Puchnarewicz, et al. 1996).
In Figure 2, we plotted the X-ray count rates of the source extracted from eleven exposures. Since each exposure has similar effective area (good to within 3%) at the source position, the count rates are representative of relative X-ray flux levels. We can see that the continuum count rates of all but one of the exposures are consistent with the average value (within 3 errorbars). We also looked into the individual exposures, but due to the limited counts, no evidence of variance on a smaller time scale could be established.
3 X-ray spectral fitting
The ACIS X-ray spectrum of the source was extracted from a circle with radius of 6.2, which is the 95% encircled-energy radius of the ACIS point-spread function at the source position, and the background was extracted from an annulus with outer radius of 18 and inner radius of 8.2. The X-ray telescope response (ARF) and CCD ACIS-I instrument response was generated for each single observation, and the final time-weighted files were used for spectral analysis. The summed spectrum (source plus background) and the expected background were shown in Figure 3. After subtracting the background, we obtained around 440 X-ray counts in the soft band (0.5 – 2.0 keV), and 130 in the hard band (2.0 – 9.0 keV). Since we don’t have enough counts, especially in the hard band, we use C statistics (Cash 1979, Nousek & Shue 1989) but compare with results using for reference, and XSPEC v11.2, which enables the utilization of C statistics in the case when a background spectrum is also in use 111see http://heasarc.gsfc.nasa.gov/docs/xanadu/xspec/manual/node57.html, for the spectral-fitting analysis. All the spectral fitting was done in the energy band 0.5 – 9.0 keV. All statistical errors quoted in this paper are for 90% confidence, one interesting parameter.
The unbinned spectrum was first fitted with a simple power-law plus a neutral absorber in the quasar frame. A Galactic neutral hydrogen absorption column of (Dickey & Lockman 1990) was also included. The X-ray spectrum is fairly steep ( = 2.1) with moderate absorption (NH = 1.3 1022 cm-2). The absorption-corrected 2.0 – 10.0 keV luminosity in the rest frame is 0.8 1044 ergs.s-1 ( = 60.0 km s-1Mpc-1, = 0.3, = 0.7). The ratio of data to the model for the fit is given in Figure 4 (upper panel). From both figure 3 and 4, we can see a huge bump at 6.2 keV (observed frame), indicating a possible strong emission line. A single Gaussian was then added to our continuum model. With three more free parameters (the line centroid energy , the line width , and the line intensity ), the fit was significantly improved ( C = - 22.6), indicating a confidence level of 99.99%. The results are given in Table 1. In the quasar frame we obtain = 16.2 keV, = 0.5 keV, and the equivalent width EW = 11.5 keV. The large rest-frame energy and large EW are both highly unusual and present a challenge for the interpretation of the origin of the line emission. We attempted to perform time-resolved spectroscopy on the emission line but found that the data are not of sufficiently high quality to investigate the line variability.
We also tried C and statistics on the rebinned spectrum (at least 10 counts per bin), and present the results in table 1 for comparison. We can see that three methods gave almost the same best-fit values for the parameters, but different confidence levels. Using the rebinned spectrum, C statistics gives higher significance level of the line and slightly narrower errors than statistics does, which is consistent with the prediction of Cash (1979). Since rebinning the spectrum would smooth the line feature, it’s also reasonable that the line is more significant in the unbinned spectrum than in the rebinned one.
4 Discussion
It is clear that the emission line is not an artifact of calibration uncertainty in the ACIS instrumental response function. No such artifact (i.e. an emission-like feature at keV) has been reported, as far as we are aware. In addition, we examined the ratios of data to a simple power-law plus neutral absorber model for CXO CDFS J033236.8-274407, and CXO CDFS J033213.3-274241, two nearby sources with similar X-ray counts. These are also shown in Figure 4 for comparison, and it is clear that the feature is not observed in the other two sources. Also, since the total exposure was composed of eleven individual observations with different roll angles, photons from each source fell into different positions on the instrument during different observations. It is unlikely that an unknown instrumental artifact (if there is any), which occurs only at certain positions on the detector, would affect photons from all eleven exposures. Figure 2 shows the 5.7 – 6.7 keV count rates of (catalog )from the eleven exposures, which are consistent with the average value within 3 errorbars. We note that the 5.7 – 6.7 keV count rates from exposure No.1 and 5 are about 34 times of the average value. However, they only contribute 6% of the total exposure time and 19% of the 5.7 – 6.7 keV counts, and fittings with the two exposures excluded yield similar results for the line feature ( = 6.1 keV, EW = 3.1 keV, both in the observed frame). This rules out the possibility that the line is due to an unknown artifact which only affects one or several of the exposures. For the same reason, the line cannot either be due to a transient event not associated with the source. We can also eliminate inadequate background subtraction as the origin of the emission line. We tried using background spectra obtained from different regions of the detector and obtained similar results. An even more compelling reason is that the spectrum without background subtraction still exhibits the emission line, but the background spectrum itself does not. And again the fact that we do not see the emission line in the other two sources shown in Figure 4 indicates that it is not due to the instrument background or X-ray background.
Yaqoob et al. (1999) reported the discovery of a highly Doppler blueshifted Fe-K emission line in QSO PKS 2149-306 from an ASCA observation. In the quasar frame, the line has a similar center energy (17.0 keV) with that of our source, but lower equivalent width (300 eV). Furthermore, if we consider both the lines as blueshifted Fe-K fluorescent lines, the blueshift factors are also similar with that of another emission line detected in PKS 0637-75 at 1.6 keV (with EW = 60 eV, rest frame) from ASCA data, which was interpreted as highly blueshifted OVII (Yaqoob et al. 1998). The good agreements of the blueshift factors from different sources and different instruments make them more convincing and interesting.
So, could the line we detected also be explained as a highly Doppler blueshifted Fe-K emission line? The Doppler factor of 2.3–2.5 then implies bulk velocities of (head-on) must be responsible for the blueshift since the rest-frame energy of the line must be in the range 6.4–6.97 keV (neutral to H-like Fe). Inflow (observed from the far side) can be ruled out quite simply because the only way to produce Keplerian velocities high enough is to approach a compact object to within a few gravitational radii, but by that time the gravitational redshift is so large that it prevents the net blueshift attaining a high enough value. Exact calculations show this to be the case even for a maximally rotating Kerr hole in which the rotation can help increase the blueshift. Therefore, outflow is required. Yaqoob et al. (1999) pointed out that Fe-K line photons originating in an accretion disk and Compton scattering off a leptonic jet aligned along the disk axis can account the emission line in PKS 2149-306. However, this model can not produce the large equivalent width we observed. Thus Fe-K line originating from the outflow itself is required, and, to produce the line, the outflow can not be fully ionized. Even then, if the emission line is produced by fluorescence, the continuum photons cannot illuminate the outflowing material from behind since the Doppler redshift of the continuum would make it even harder than it already is to attain the large equivalent width. For the same reason, there must be preferential blueshifting of the line photons over the continuum photons. The continuum photons must illuminate the outflow from the sides. So the outflow must locate very close to the X-ray continuum emission region, and have comparable size to ensure the outflow has enough open angle to the X-ray continuum emission to produce the large equivalent width. Under these conditions it is possible to boost the rest-frame equivalent width by the Doppler factor raised to the power of ( is the X-ray photon index), or . Thus, an emission line which would ordinarily have an equivalent width of 0.1 keV could be boosted to have a rest-frame equivalent width of keV. Of course, the geometry is highly constrained. We note that Fe-K lines have now been found in several gamma-ray burst afterglows (e.g. Piro et al. 1999, 2000; Yoshida et al. 1999; Antonelli et al. 2000) and some models to account for these lines invoke super-solar Fe abundances of as much as a factor . If there is any association at all with past gamma-ray bursts, or if such super-solar abundances occur under other circumstances, then the large equivalent width of the emission line would obviously also be much easier to explain (although an outflow is still required).
Similar blueshifted and strong iron emission line has not been detected before in other AGNs. However, it’s interesting to note that Migliari et al. (2002) reported the discovery of blueshifted and very strong iron emission lines (EW = 13 keV, Migliari, private communication) from extended X-ray emission in x-ray binary system SS 433. The X-ray jets are required to reheat itself to produce the X-ray continuum and line emission. We argue that if the possible outflow of (catalog )discussed above was also heated by itself or other unknown mechanisms and ionized, it could produce iron line itself without being illuminated by the X-ray continuum. Then the special geometry requirement can be released. It’s interesting to note that VLA observation of the source resolved an extended radio emission 6″ south to the core (Kellermann, private communication), presenting a possible radio jet. Based on above discussions, we conclude the most likely outflow is an inner X-ray jet. It’s highly valuable to study the source in more details in near future, including obtaining optical spectroscopy with high quality to check if there are blueshifted optical emission lines, obtaining X-ray image with better spatial resolution to check if there is any extended X-ray emission, etc.
An alternative explanation is that some fraction of the X-ray continuum of (catalog )is heavily absorbed by a cold outflow, and the observed big bump is due to the Fe absorption edge. The spectral fitting results indicate we need a cold outflow with bulk velocities of 0.74c and column density of NH = 1.6 1024 cm-2, covering 98% of the X-ray continuum ( C = - 17.9). Such a cold outflow is unusual either.
Is it possible that there happens to be a low-redshift () type 2 AGN so close to (catalog )that we cannot detect it individually? Fe K lines at 6.4 keV with large equivalent widths ( 1 keV) are not difficult to produce theoretically by Compton-thick type 2 AGNs (e.g. Ghisellini et al. 1994), and already confirmed by X-ray observations (e.g. Levenson et al. 2002). NGC 6240, a standard Compton-thick type 2 AGN, has an Fe K line intensity of 3.2 10-5 photons cm-2 s-1 (Ikebe et al. 2000), and a R band nuclei magnitude of 16.1 (Fried & Schulz 1983). Assuming a spectral energy distribution of NGC 6240, the iron line flux we observed leads to a type 2 AGN with R = 22.5, which is even brighter than (catalog )(R=22.9). However, we didn’t detect any evidence of its existence from either the deep image or the optical spectroscopy. Even if the source was much more heavily obscured in optical than NGC 6240, it is also puzzling that we would have missed its host galaxy (which has to have a low redshift, z 0.034) from our deep image. Thus it is very unlikely that the emission line feature at 6.2 keV is produced by another low redshift type 2 AGN. However, it does not hurt to make a wild guess: is it possible that there is a class of source consisting of an obscured Compton-thick active nucleus whose host galaxy is also obscured so that the entire object is optically invisible? If this kind of source really exists, there might be more among the X-ray sources with no optical counterparts in the deep fields.
In principle there is a simple way to distinguish the blueshifted Fe K line model from the outflowing absorption model or the type 1 plus type 2 model. That is, the latter two models predict that the X-ray emission above 10 keV should be dominated by the outflow obscured component or the type 2 AGN since the effect of the obscuring matter is much less than it is below 10 keV. In fact using the latter two model we predict that the 10–20 keV flux should be times larger compared to the blueshifted Fe K line model. The planned hard X-ray imaging mission, InFocs would be able to perform the simple test outlined here.
| Parameter | C | C | |
|---|---|---|---|
| unbinned | rebinned | rebinned | |
| 2.2 | 2.3 | 2.3 | |
| (1022cm-2) | 1.4 | 1.6 | 1.7 |
| (keV) | 6.2 | 6.2 | 6.2 |
| (keV) | 0.2 | 0.2 | 0.2 |
| EW (keV) | 4.4 | 4.9 | 5.3 |
| C()/dof | 548.8/575 | 48.8/49 | 46.7/49 |
| C () | -22.6 | -16.1 | -11.4 |
Note. — Spectral fits with an absorbed power law plus Gaussian line model. The line intensity is in units of , and the line parameters are given in the observed frame. C () gives the improvements of the fit by adding the Gaussian line to the continuum model.
References
- (1) Alexander, D. M., et al. 2002, Astron. Nachrichten, in press, astro-ph0210308
- (2) Antonelli, L. A., et al. 2000, ApJ, 545, L39
- (3) Brandt, W.N., et al. 2001, AJ, 122, 2810
- (4) Cash, W. 1979, ApJ, 228, 939
- (5) Dickey, L. M., & Lockman, F. J. 1990, ARAA. 28, 215.
- (6) Fried, J. W., & Schulz, H. 1983, A&A, 118, 166
- (7) Ghisellini, G., Haardt, F., & Matt, G., 1994, MNRAS, 267, 743
- (8) Giacconi, R., Gurksy, H., Paolini, F.R., & Rossi, B.B., 1962, Phys. Rev. Letters, 9, 439
- (9) Giacconi, R., et al. 2002, ApJS, 139, 369
- (10) Ikebe, Y., et al. 2000, MNRAS, 316, 433
- (11) Levenson, N. A., Krolik, J. H., Życki, P. T., Heckman, T, M., Weaver, K. A., & Awaki, H. 2002, ApJ, 573, L81
- (12) Migliari, S., Fender, R., & Méndez, M. 2002, Science, 297, 1673
- (13) Nousek, J. A., & Shue, D. R. 1989, ApJ, 342, 1207
- (14) Piro, L., et al. 1999, ApJ, 514, L73
- (15) Piro, L., et al. 2000, Science, 290, 955
- (16) Puchnarewicz, E. M. et al. 1996, MNRAS, 281, 1243
- (17) Rosati, P., et al. 2002, ApJ, 566, 667
- (18) Yaqoob, T., George, I.M., Turner, T.J., Nandra, K., Ptak, A., & Serlemitsos, P.J. 1998, 505, L87
- (19) Yaqoob, T., George, I.M., Nandra, K., Turner, T.J., Zobair, S., & Serlemitsos, P.J. 1999, ApJ, 525, L9
- (20) Yoshida, A., et al. 1999, A&AS, 138, 433