The Building the Bridge survey for z=3 Ly emitting galaxies I:
method and first results
††thanks: Based on observations made with ESO Telescopes at the
Paranal Observatory under programmes ID 67.A-0033 and 69.A-0380
We present the first results of an observational programme at the ESO Very Large Telescope aimed at detecting a large sample of high-redshift galaxies fainter than the current spectroscopic limit of R=25.5 for Lyman-Break galaxies. In this paper, we describe the results of deep narrow and broad-band imaging and subsequent follow-up multi-object spectroscopy of faint high-redshift galaxies in the fields of the QSOs BRI 13460322 and Q 21384427. These QSOs have intervening high neutral hydrogen column density absorbers, at redshifts z=2.85 and z=3.15 respectively, for which redshifted Ly emission falls within less than a few Å from the central wavelengths of existing VLT (60 Å-wide) narrow-band filters. We selected 37 and 27 candidate emission-line galaxies in the two fields respectively. Most (85%) of the candidates have R-band magnitudes fainter than R=25.5. The first spectroscopic follow-up of a sub-sample of the candidates resulted in 41 confirmed candidates and 4 foreground emission line galaxies (three [O ii] emitters and one C iv emitter). The confirmation rate for Ly emitters is 82% and 68% in the field of BRI 13460322 and Q 21384427 respectively. In addition, we serendipitously detect a number of other emission-line sources on some of the slitlets not used for candidates. Of these, 9 are also most likely Ly emitters with redshifts ranging from 1.98 to 3.47. The redshift distribution of confirmed candidates in the field of BRI 13460322 is consistent with being drawn from a uniform distribution weighted by the filter response curve, whereas the galaxies in the field of Q 21384427 have redshifts clustering very close to the redshift of the damped Ly absorber. This latter fact indicates the existence of a large ‘pancake’-like structure confirming the earlier suggestions of Francis & Hewitt (1993).
Key Words.:
cosmology: observations – quasars: BRI 13460322, Q 21384427 – galaxies: high redshift1 Introduction
Our knowledge of the properties of high-redshift galaxies (here z3) currently mainly comes from two very different kinds of studies, namely, i) the study of Lyman-Break Galaxies (LBGs) selected by the Lyman-limit break in their spectrum (e.g. Steidel et al. 1996, 2000; Fontana et al. 2000; Papovich et al. 2001; Vanzella et al. 2002), and ii) the study of the chemical and kinematical properties of (proto)galaxies, so called Damped Ly Absorbers (DLAs), intervening the lines of sight to QSOs (e.g. Wolfe et al. 1986; Pettini et al. 1997; Prochaska & Wolfe 2002; Ledoux et al. 2002). However, there is strong evidence that there is only a small overlap between the galaxies in the current LBG samples and the DLAs (Fynbo, Møller & Warren 1999; Haehnelt et al. 2000; Schaye 2001; Møller et al. 2002; Adelberger et al. 2003). The reason for this is that Lyman-Break galaxy samples are continuum-flux limited and that the current flux limit corresponding to R25.5 is not deep enough to reach the level of typical damped Ly absorption selected galaxies. However, due to the very steep faint-end slope of the z=3 galaxy luminosity function (Adelberger & Steidel 2000; Poli et al. 2001a, 2001b) 70% of the observer rest-frame R-band flux from z=3 galaxies is emitted by galaxies fainter than R=25.5. Therefore, besides accounting for the bulk of the damped Ly absorption in QSO spectra, the R25.5 galaxies could dominate the integrated star-formation rate and the metal enrichment and heating of the intergalactic medium at z3.
In 2000, we started the programme “Building the Bridge between Damped Ly Absorbers and Lyman-break Galaxies: Ly Selection of Galaxies” at the European Southern Observatory’s Very Large Telescope (VLT). This project aims at bridging the gap between absorption- and emission-line selected galaxy populations by creating a database of z3 galaxies that are fainter than R=25.5, and to study the properties, such as morphology, star-formation rates, clustering and continuum colours, of these faint, very numerous, and so far little studied high-redshift galaxies.
Our method is to obtain deep narrow-band Ly observations of the fields of z3 QSO absorbers whose redshifts match existing VLT narrow-band filters. We chose to observe the fields of QSO absorbers to anchor our fields to already known structures at the target redshift and, hence, minimise the risk of observing a void. Ly narrow-band imaging can, with comparatively short integration times, lead to the detection of a significant sample of z3 galaxies having much fainter continuum fluxes than LBGs, as demonstrated by, e.g., Cowie et al. (1998), Kudritzki et al. (2000), and Fynbo et al. (2000, 2001, 2002). In the following, we shall use the acronym LEGO for Ly-Emitting Galaxy-building Objects (Møller & Fynbo 2001) to refer to the Ly emitters. In this first paper, we describe the results of deep narrow and broad-band imaging and subsequent follow-up multi-object spectroscopy of the fields of the QSOs BRI 13460322 and Q 21384427. These QSOs have intervening high neutral hydrogen column density Ly absorbers at redshifts z=3.15 () and z=2.85 () respectively (Francis & Hewett 1993; Storrie-Lombardi et al. 1996). The paper is organized in the following way. First, in Sect. 2 we describe the imaging and the selection of LEGO candidates. Then, in Sect. 3 we describe the observations and results from the first spectroscopic run. Finally, in Sect. 4. we discuss our findings. Throughout this paper we assume a cosmology with =65 km s-1 Mpc-1, =0.3 and =0.7. In this model, a redshift of 3.15(2.85) corresponds to a luminosity distance = 29.05(25.76) Gpc and a distance modulus of 47.31(47.05). One arcsecond on the sky corresponds to 8.18(8.42) proper kpc and the look-back time is 12.3(12.1) Gyr (roughly 85% of the time since the event commonly referred to as the Big Bang).
2 Imaging
2.1 Observations and data reduction
The fields of BRI 13460322 and Q 21384427 were observed in service mode at the VLT 8.2 m telescopes, units Antu and Melipal, during the months of May to September 2001 and May to June 2002 respectively. The wavelength of Ly at the redshift of the z=3.15 absorber in the spectrum of BRI 13460322 corresponds to the central wavelength of a 59 Å-wide [O iii] off-band VLT filter. Similarly, the wavelength of Ly at the redshift of the z=2.85 absorber in the spectrum of Q 21384427 is 2.5 Å off from the central wavelength of a 66 Å-wide He ii VLT filter. Both fields were observed in one of the two narrow-band filters and also in the Bessel B and R broad-band filters. The transmission curve of each of the filters is shown in Fig. 1. The integration times in the B and R filters were set by the criterion that the broad on-band B imaging should reach about half a magnitude deeper than the narrow-band imaging for objects having a pure continuum in the narrow filter so as to get a reliable selection of objects with excess emission in the narrow filter. For the broad off-band R imaging, we reached a magnitude deeper (at the 5 significance level) than the spectroscopic limit of R(AB)=25.5 for LBGs. The total integration times, the seeing (FWHM) of the combined images and the 5 detection limits are given for each filter and both fields in Table LABEL:journal.

| filter | total exp. | combined seeing | 5 detection |
|---|---|---|---|
| time (hr) | () | limit | |
| BRI 13460322 | |||
| narrow | 8.9 | 0.93 | 26.0 |
| B | 2.5 | 1.02 | 26.5 |
| R | 1.7 | 0.94 | 26.2 |
| Q 21384427 | |||
| narrow | 10.0 | 0.96 | 26.5 |
| B | 2.5 | 1.04 | 26.9 |
| R | 1.7 | 0.93 | 26.5 |
The images were reduced (de-biased and corrected for CCD pixel-to-pixel variations) using the FORS1 pipeline (Grosbøl et al. 1999). The individual reduced images in each filter were combined using a code that optimizes the Signal-to-Noise (S/N) ratio for faint, sky-dominated sources (see Møller & Warren 1993 for details on this code).
The broad-band images were calibrated as part of the FORS1 calibration plan via observations of Landolt standard stars (Landolt 1992). As the data were collected over a time span of months, we have data from several photometric nights which we used to determine independent zeropoints for the combined images. These zero-points are consistent with each other within 0.02 mag. We transformed the zero-points to the AB system using the relations given by Fukugita et al. (1995): B(AB)=B and R(AB)=R. The Q 21384427 images are deeper than the BRI 13460322 ones by nearly half a magnitude as the BRI 13460322 data were obtained at higher airmass and with slightly larger lunar illumination than the Q 21384427 data. For the calibration of the narrow-band images, we used observations of the spectrophotometric standard stars LTT6248 and LDS749-B for, respectively, the BRI 13460322 and Q 21384427 fields.
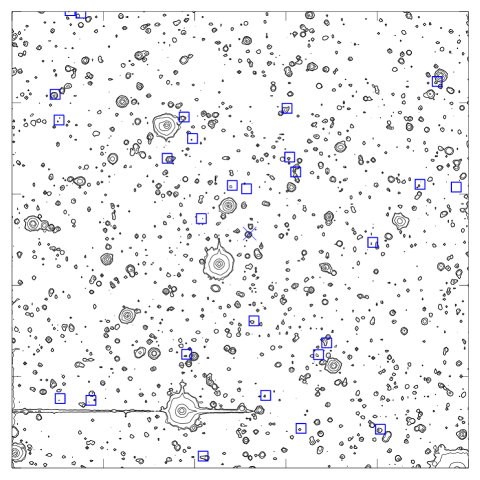
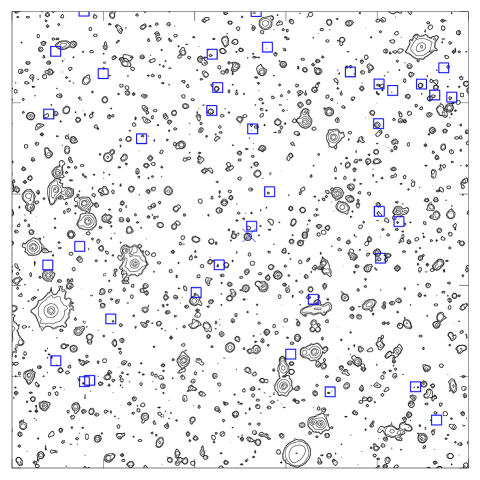
Contour images of the combined narrow-band images of the 400400 arcsec2 fields surrounding the QSOs BRI 13460322 and Q 21384427 are shown in Fig. 2. Both QSOs are identified by an “” at the field centre and the positions of selected LEGO candidates (see Sect. 2.1.1) are shown with boxes.
2.1.1 Selection of LEGOs in the fields
For object detection and photometry, we used the software package SExtractor (Bertin & Arnouts 1996). As a detection image, we used the weighted sum of the combined narrow- and B-band images, with 80% weight for the narrow-band image and 20% weight for the B-band one to secure an optimal selection of objects with excess in the narrow filter. However, the selection was not very sensitive to the exact weights given to the narrow-band and B-band images. Before object detection we convolved the detection image with a Gaussian filter function having a FWHM equal to that of point sources. We used a detection threshold of 1.1 times the background sky-noise in the unfiltered detection image and a minimum area of 5 connected pixels above the detection threshold in the filtered image. Isophotal apertures were defined on the detection image and those same isophotal apertures are used in the different bands (narrow, B and R). In our final catalogue, we include only objects with total S/N5 in the isophotal aperture in either the narrow- or the B-band images. In total, we detect 1993 and 2499 such objects within the 400400 arcsec2 fields around BRI 13460322 and Q 21384427 respectively. We measured the flux of all objects in the isophotal aperture (for precise colour measurement) and in an ellipsoidal aperture with minor axis and major axis , where is the first moment of the light distribution and is the ellipticity (to get a measure of the total magnitudes). As a minimum aperture radius, we used . The fluxes measured in the large aperture are used to measure the total magnitudes of the objects. We also derived error bars on colours as described in Fynbo et al. (2002).

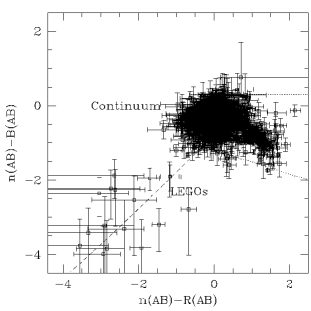


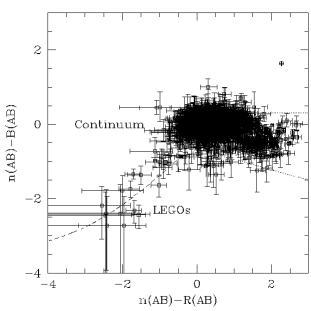

For the final selection of LEGO candidates, we used the “narrow minus on-band broad” versus “narrow minus off-band broad” colour/colour plot technique (Møller & Warren 1993; Fynbo et al. 1999, 2000, 2002 and Fig. 3). In order to constrain where objects with no special spectral features in the narrow filter are in the diagram, we calculated colours based on synthetic galaxy SEDs taken from the Bruzual & Charlot (1995) models. We have used models with ages ranging from a few Myr to 15 Gyr and with redshifts from 0 to 1.5 (open squares in Fig. 3) and models with ages ranging from a few Myr to 1 Gyr with redshifts from 1.5 to 3.0 (open triangles). For the colours of high-redshift galaxies, we included the effect of Ly blanketing (Møller & Jakobsen 1990; Madau 1995). Fig. 3 shows the n(AB)B(AB) versus n(AB)R(AB) colour diagram for the simulated galaxy colours (left panels) and for the observed sources in the two target fields (middle and right panels). The dashed line indicates where objects with a particular broad-band colour and either absorption (upper right) or emission (lower left) in the narrow filter will fall.
In the middle panel, we show the colour-colour diagram for all of the objects detected in the two fields. Due to the damped Ly line, Q 21384427 has a large positive n(AB)B(AB) colour and is hence seen in the upper right corner. Due to Lyman-forest blanketing, the B-band flux of BRI 13460322 is suppressed hence decreasing its n(AB)-B(AB) colour. In the lower left part of the diagram, a large group of objects are found to lie significantly away from the locus of continuum objects. In the right panel, we show with the solid line the median n(AB)B(AB) colour in the range 0n(AB)B(AB)3. The two dotted lines show the 98% and 2% percentiles in the n(AB)B(AB) colour. We selected as emission line sources objects with S/N5 in the narrow-band image and whose 1 upper limit on n(AB)B(AB) is below the 98% line. We detect 27 and 37 such objects in the BRI 13460322 and Q 21384427 fields respectively which we consider as LEGO candidates in the following. The colours of the candidates are shown again in the two right panels.
3 Multi-Object Spectroscopy
3.1 Observations and data reduction
Follow-up Multi-Object Spectroscopy (MOS) of the previously described sample of LEGO candidates was carried out in visitor mode in July 10 – 13, 2002, with FORS1 installed at the VLT telescope, unit Melipal. The mask preparation was done using the FORS Instrumental Mask Simulator. The field of BRI 13460322 was only visible at the beginning of the nights so we only had time for using three masks for the observations of this field. Nevertheless, all but five candidates could be put on to slits. For the field of Q 21384427, we did observe all but three candidates using five masks. In the following, we will refer to these 8 masks as mask1346A to C and mask2138A to E. The observing conditions were generally mediocre due to very strong wind coming from the North. As a result, the seeing was always above . The seeing deteriorated during the nights so that the spectra in the field of BRI 13460322 were obtained under better conditions than the ones in the other field. We used MOS slitlets having a width of on the sky. All spectra were obtained with the G600B grism covering the wavelength range from 3600 Å to 6000 Å at a resolution of about 800. The detector pixels were binned 22 for all observations through all masks. The journal of spectroscopic observations is given in Table LABEL:spec-journal.
| mask | Exp.time | Date | Effective seeing |
|---|---|---|---|
| (hr) | (2002) | () | |
| mask1346A | 3.0 | July 10 | 1.1 |
| mask1346B | 3.0 | July 11 | 1.3 |
| mask1346C | 3.0 | July 12 | 1.4 |
| mask2138A | 3.0 | July 10 | 1.4 |
| mask2138B | 4.0 | July 10 | 1.4 |
| mask2138C | 3.0 | July 11 | 1.4 |
| mask2138D | 4.0 | July 11 | 1.1 |
| mask2138E | 5.5 | July 12 | 2.2 |
3.2 Results


The MOS data were reduced and combined as described in Fynbo et al. (2001). The accuracy in the wavelength calibration is about pixel for a spectral resolution , which translates to z=0.0002. Average object extraction was performed within a variable window size matching the spatial extension of the emission line(s). Therefore, the flux should be conserved. When two or more individual exposures on the same target have been obtained through different masks, the spectra were appropriately combined with rescaling and weights, and using a mask for rejecting cosmic ray impacts.
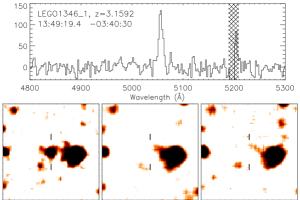
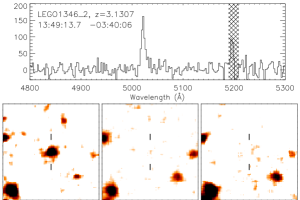
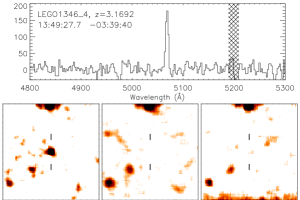
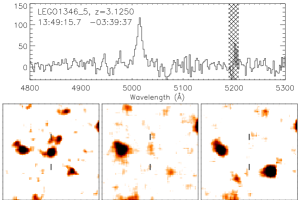
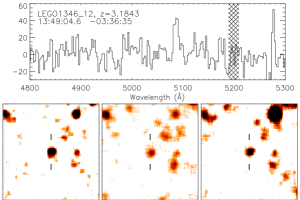
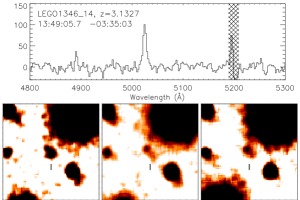
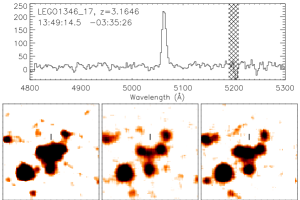
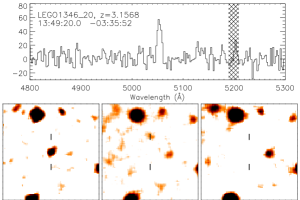
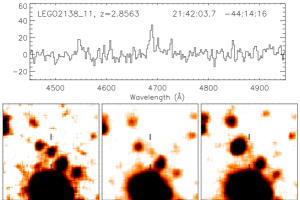
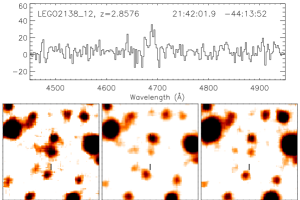
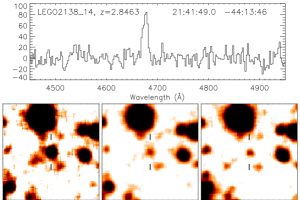
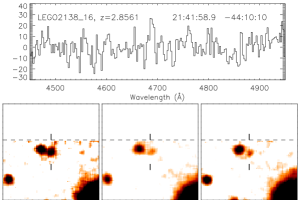
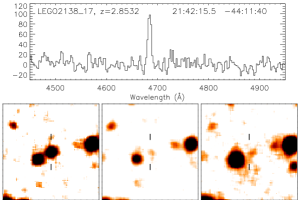
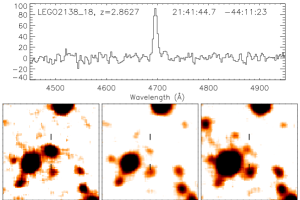
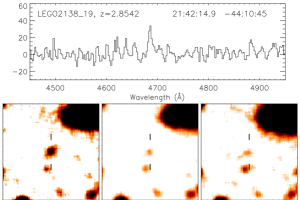
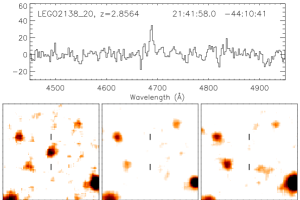
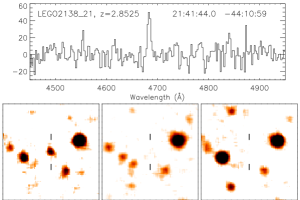
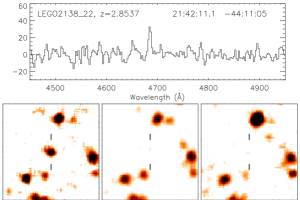
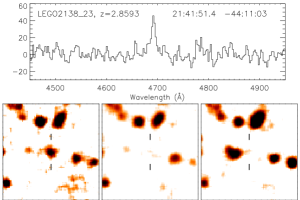
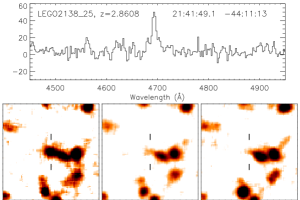
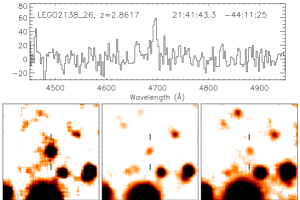
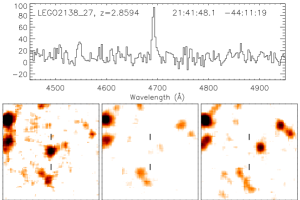
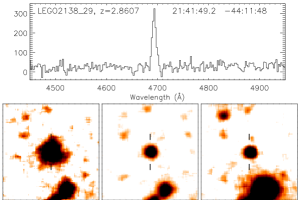
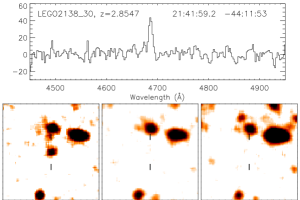
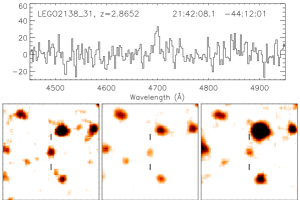
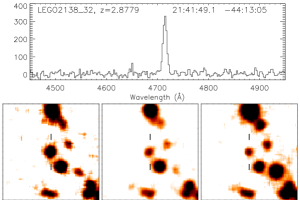
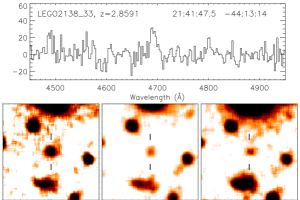
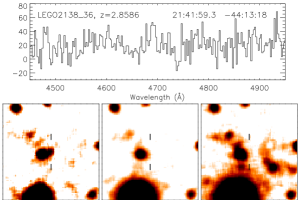
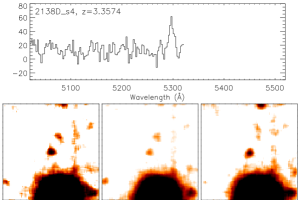
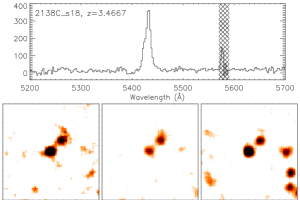
We first analysed the slitlets containing the spectra of the LEGO candidates. The combined spectra are displayed in Figs. 5 and 6. Out of the 27 candidates in the BRI 13460322 field, we confirm 20 as being emission-line objects. We consider a candidate confirmed if there is an emission line detected with at least 3 significance at the correct position in the slitlet within the wavelength range corresponding to the filter transmission. Five candidates were not observed and for the remaining two an emission line is not detected. Two of the confirmed emission-line sources are foreground galaxies with the [O ii] line located in the narrow-band filter. The overall efficiency for detection and confirmation of LEGOs is therefore #(confirmed LEGOS)/#(observed LEGOs) = 18/22 = 82% so far. For the Q 21384427 field, the overall efficiency is smaller. Three candidates were not observed and 9 observed candidates were not confirmed. For the remaining 25, we confirm the presence of an emission line. Two of the confirmed emission-line sources are foreground objects. One is an [O ii] emitter and the other is a z=2.03664i4 AGN with C iv located in the narrow-band filter. Hence, the fraction of confirmed LEGOs is 23/34=68%.

For the confirmed LEGOs, we derived Ly fluxes, equivalent widths (EWs) and star-formation rates (SFRs) as described in detail in Fynbo et al. (2002).
3.3 Basic properties of LEGOs
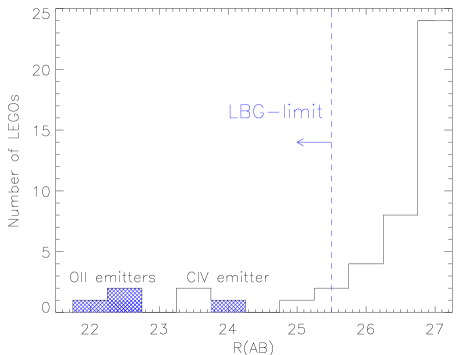
The confirmed LEGOs are in general very faint. In Fig. 7, we show an histogram with the R(AB) magnitudes measured for confirmed emission-line sources. At the bright end (R24), we find that 4 out of 6 sources are foreground emission-line galaxies (three [O ii] emitters and a z=2.0364 AGN with C iv located in the narrow-band filter). 85% of the confirmed LEGOs are fainter than the R(AB)=25.5 spectroscopic limit for LBGs in current ground-based surveys (see e.g. Fig. 6 of Shapley et al. 2003). The few LEGOs in our sample that are so bright that they would have made it into the LBG samples are quite remarkable objects. LEGO2138_29 (see Fig. 6) has Ly emission that is much more extended than its continuum emission. This has already been seen for other LEGOs (e.g. Møller & Warren 1998; Fynbo et al. 2001) but not as clearly as in this case. LEGO1346_17 (see Fig. 5) seems to be part of a complex system with several components, although we cannot exclude chance alignment.

Based on observed Ly fluxes, the range of SFRs for the confirmed LEGOs is 0.20–15 M yr-1 if the extinction is negligible. The observed EWs range from less than 100 Å to more than 1000 Å. This corresponds to about 20 Å to 250 Å in the rest-frame and is consistent with the theoretically expected Ly EWs for metal-poor starburst galaxies (Charlot & Fall 1993; Valls-Gabaud 1993; Schaerer 2003).
The surface density of confirmed sources is of the order of 10 arcmin-2 per unit redshift down to a Ly flux limit of 710-18 erg s-1 cm-1 and the EW limit shown in Fig. 4. This is about a factor of five higher than the surface density of LBGs down to R=25.5, 21.2 (Steidel et al. 1999) even if most LBGs are not themselves Ly emitters. In other words, the LBGs are the tip of an iceberg consistent with the conclusion of Fynbo et al. (1999). This reflects the steepness of the luminosity function for z=3 galaxies.
In future papers, we will address the morphology, clustering properties and luminosity function of the LEGOs from this and complementary VLT surveys.
3.4 Redshift distributions
In Fig. 8, we show the redshift distributions of LEGOs in the two fields relative to the filter response curves. The redshifts of LEGOs observed in the field of BRI 13460322 fill out the sampled volume, with a mean redshift of 3.155 and a standard deviation of 0.019. On the contrary, the redshifts of LEGOs in the field of Q 21384427 have a mean of 2.858 and a standard deviation of only 0.006, corresponding to a velocity dispersion of 470 km s-1. A significant part of this velocity spread must be caused by peculiar velocities or offsets between the Ly and systemic redshifts, and therefore, the Hubble flow depth of the structure should be even less. The mean observed redshift is close to the redshift of the DLA absorber toward Q 21384427 (z=2.851). This indicates the presence of a large-scale structure of galaxies, e.g. a pancake-like structure at the redshift of the DLA absorber, surrounded by voids. Independent evidence for this comes from the observation of strong metal absorption lines at the same redshift in two nearby QSOs (Francis & Hewitt 1993; D’Odorico et al. 2002). The redshift distribution of LEGOs in the field of Q 21384427 is similar to that of LEGOs in the fields of radio galaxies (Pentericci et al. 2000; Venemans et al. 2002). In a subsequent paper (Ledoux et al., in prep.), we will address the properties of the DLA absorber.
3.5 Unconfirmed candidates
Most of the candidates that we did not confirm are faint in the narrow-band images and/or have low EWs (see Fig. 4). These candidates could either have been missed by the slitlets, be too faint for the follow-up spectroscopy (due to the bad seeing we did not reach the planned detection limit), or simply not be LEGOs. As seen in Fig. 3, the unconfirmed candidates tend to have redder colours (B(AB)R(AB) = 0.9–1.8) than the confirmed candidates (see Fig. 3). The confirmed emission-line sources detected in the broad bands indeed have blue colours (typically B(AB)R(AB)0.8). However, the fact that one of the confirmed candidates, LEGO2138_31, has colours and flux very similar to the unconfirmed candidates makes it plausible that at least some of these will be confirmed with deeper spectroscopy under better seeing conditions. This we plan to check with future observations.
3.6 Interloopers
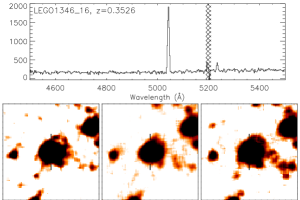
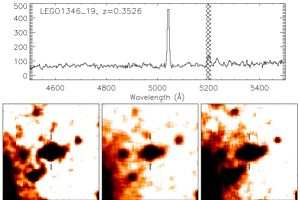
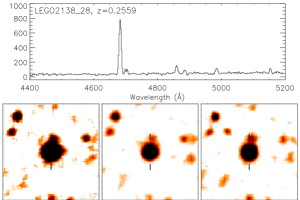
Four of our colour selected candidates are objects at lower redshifts with other emission lines in the narrow filters (three [O ii] emitter and a faint (R(AB)=23.9) AGN with C iv in the narrow filter. Similar AGNs are common as found e.g. in the Chandra Deep Field South (Mainieri, private communication). Subtraction of the Point-Spread-Function of the AGN reveals no obvious host galaxy and we conclude that the host galaxy must be either very faint or very compact. The Interloopers are all characterized by small observed EWs ( Å), bright continuum magnitudes, and the presence of other lines in the spectra. Their spectra are shown in Fig. 9.
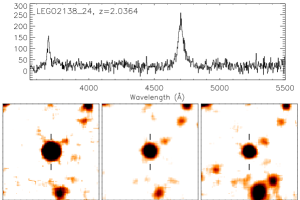
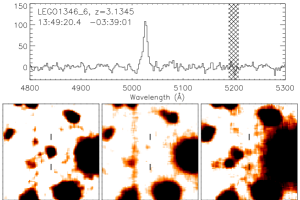
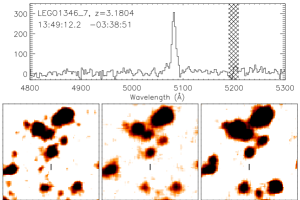
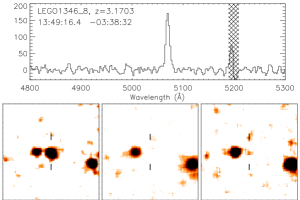
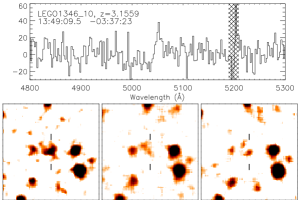
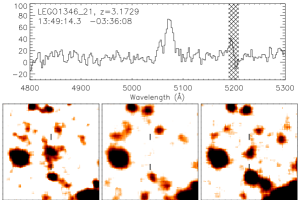
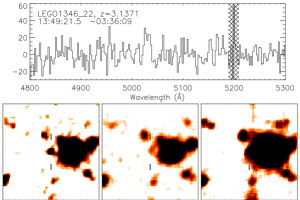
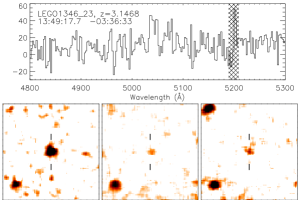
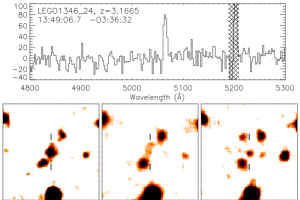
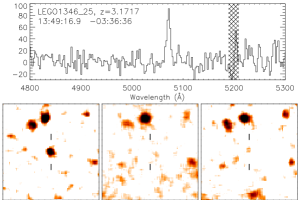
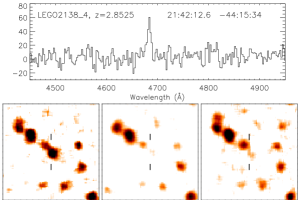
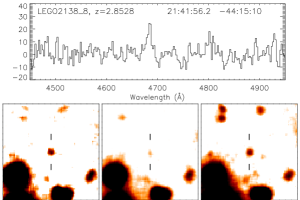
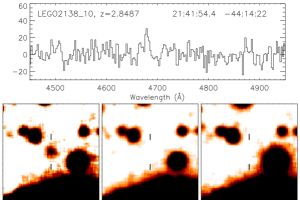
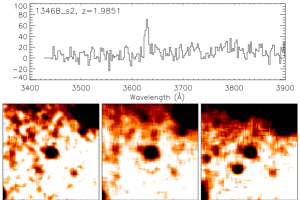
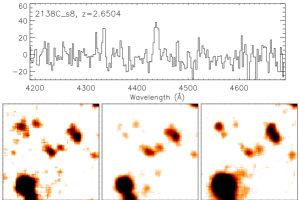
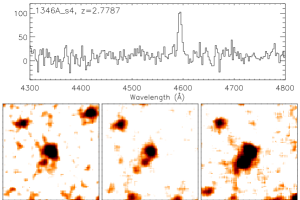
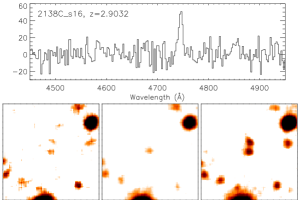
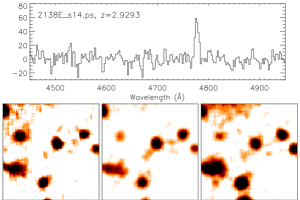
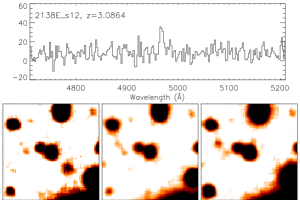
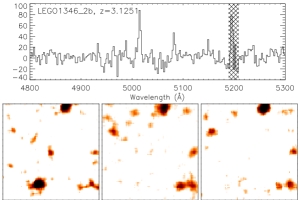
3.7 Serendipitously detected LEGOs at other redshifts
In each mask about half of the available 19 slitlets could be used on candidates. The remaining slitlets were placed either on stars to check the slit alignment, on faint galaxies, or on regions of blank sky. We have carefully analyzed all the 2D-spectra for other emission line sources that could be serendipitously detected LEGOs at other redshifts (see e.g. Manning et al. 2000 for other such cases). In addition to a number of [O ii] emitters we detect a significant number of emission line sources that are most likely Ly emitters based on their extremely faint continua and the lack of other lines in the spectra. The spectra and images of these are shown in Fig. 10. One of the sources, called LEGO1346_2b, a is a neighbour to the z=3.1301 LEGO1346_2 and has a redshift within the narrow filter used for the BRI 13460322 field, z=3.1251. However, in the narrow-band image it is fainter than our 5 cut. The serendipitously detected LEGOs have redshifts ranging from 1.98 to 3.47.
4 Discussion
The main result of this paper is that the selection method we have applied has proven to work. Clearly, deep narrow-band imaging combined with follow-up MOS spectroscopy is an efficient method to build up a significant sample of spectroscopicallly confirmed high-redshift galaxies below the flux-limit in ground based surveys for LBGs. Compared to selecting U-dropout galaxies from deep HST images such as the Hubble Deep Fields or the Chandra Deep Fields this technique is much cheaper and can be applied over much larger fields securing that large samples can be built with fairly modest amounts of observing time. Obviously, we only select objects with strong emission lines and samples selected based on the Ly will therefore not be complete to the continuum limit of the survey. For the bright LBGs in ground based surveys only 20–30% are Ly emitters with a rest-frame EW above 20 Å. The fraction of strong Ly emitters could be larger at the faint end of the luminosity function. However, Steidel et al. (2000) found that the fraction of Ly emitters was not significantly higher at the faint end of a sample of LBGs and narrow-band selected galaxies at z=3.09. Shapley et al. (2003) also argue that a constant fraction of Ly emitters down to is consistent with the data when selection effects are taken into account.
It is interesting to ask how the LEGOs compare with the LBGs at the bright end of the luminosity function. Given the importance of dust for the escape of Ly emission from galaxies the naive expectation would be that Ly emitters are drawn from the younger, less chemically evolved and in general faint end of the population of high-redshift galaxies (Fynbo et al. 2001; Malhotra & Rhoads 2002). Contrary to this expectation, Shapley et al. (2001) suggest, based on rest-frame optical properties of LBGs, that the Ly emitting sub-sample of the LBGs are the oldest objects among the Lyman-break selected galaxies. In this scenario LBGs start out in a dusty burst phase for 50–100 Myr followed by a more quiescent phase with less extinction for several hundred Myr up to a Gyr. However, most of the Ly emitters in our samples are too faint to be included in the LBG samples and it is therefore likely that the properties of the Ly emitting LBGs are different from LEGOs in general.
During most of the previous decade Ly emission was considered an inefficient survey method for high-redshift galaxies due to a number of unsuccessful surveys (e.g. Prichet 1994 and references therein). It is now clear that the first surveys for Ly emitters were unsuccessful mainly because they reached significantly too shallow detection limits. The theoretical expectation was that todays large ellipticals formed in a fast, monolithic collapse (e.g. Patridge & Peebles 1967). In the hierarchical picture of galaxy formation the high-redshift galaxies are smaller and hence fainter than expected when the first surveys were planned.
The main advantage of LBG surveys is that they probe a very large volume and hence provide a large number of galaxies per field. However, there is a number of studies that are most efficiently done with LEGOs as probes: i) LEGOs can be used to probe the faint end of the luminosity function (Fynbo et al. 2001); ii) LEGOs can be detected and spectroscopically confirmed at both lower (Fynbo et al. 1999, 2002) and higher redshifts (Dey et al. 1998; Ellis et al. 2001; Venemans et al. 2002; Hu et al. 2002; Taniguchi et al. 2003) than is currently possible with techniques based on the continuum; iii) the large space density reachable with surveys for LEGOs allows a detailed study of the underlying large scale structure and to probe the environments of other high-redshift objects such as radio galaxies (Kurk et al. 2000; Venemans et al. 2002), Gamma Ray Burst host galaxies (Fynbo et al. 2002) or QSO absorbers (e.g. Møller & Warren 1993, Francis et al. 1995; and this paper).
The optimal way to proceed with Ly surveys seems to be the use of large area cameras on 8-m class telescopes. First results regarding the luminosity function and clustering properties of LEGOs using the Suprime Camera (Miyazaki et al. 2002) on SUBARU has been reported by (Ouchi et al. 2003), however that survey is not as deep as the survey presented here and it targets a higher redshift (z=4.86). A narrow-band image targeting z=3 LEGOs to the same depth as in the present survey, but obtained with the Suprime Camera will provide of order 500 candidates per field. Furthermore, it is mandatory that candidates based on narrow-band imaging are subsequently confirmed (or rejected) based on spectroscopy to make sure that conclusions based on surveys of LEGOs can be trusted. A major reason for the success of the Lyman-Break surveys is the spectroscopic confirmation of most of their candidates. Studies of LEGOs should follow this good example. Furthermore, the measurement of several hundred redshifts in one field can be used to map out the underlying filamentary structure (Møller & Fynbo 2001) and even provide an independent measurement of the cosmological constant (Weidinger et al. 2002).
Acknowledgments
We thank our referee C. Steidel for comments that help us improve the discussion and the Paranal staff for excellent support during the visitor run in July 2002. JPUF and CL gratefully acknowledge the receipt of an ESO research fellowship. We acknowledge helpful discussions with Bruno Leibundgut, Nicolas Bouche, Masami Ouchi and Vincenzo Mainieri. JPUF gratefully acknowledge support from the Carlsberg Foundation.
References
- (1) Adelberger, K.L., Steidel C.C., Shapley, A.E., & Pettini, M. 2003, ApJ, 584, 45
- (2) Adelberger K., & Steidel C.C. 2000, ApJ 544, 218
- (3) Bertin, E., Arnouts, S. 1996, A&AS, 117, 393
- (4) Charlot, S., & Fall, S.M. 1993, ApJ, 415, 580
- (5) Cowie, L.L., & Hu, E.M. 1998, AJ, 115, 1319
- (6) Dey, A., Spinrad, H., Stern, D., Graham, J.R., & Chaffee, F.H. 1998, ApJL, 498, L93
- (7) D’dorico, V., Petitjean, P., & Cristiani S. 2002, A&A, 390, 13
- (8) Ellis, R., Santos, M.R., Kneib, J.-P., & Kuijken, K. 2001, ApJL, 560, L119
- (9) Fontana, A., D’Odorico, S., Poli, F., et al. 2000, AJ, 120, 2206
- (10) Francis, P.J., & Hewett, P.C. 1993, AJ, 105, 1633
- (11) Francis, P.J., Woodgate, B.E., Warren, S.J., et al. 1995, ApJ, 457, 490
- (12) Fukugita, M., Shimasaku, K., & Ichikawa, T. 1995, PASP, 107, 945
- (13) Fynbo, J.P.U., Møller, P., & Warren, S.J. 1999, MNRAS, 805, 849
- (14) Fynbo, J.P.U., Thomsen, B., & Møller, P. 2000, A&A, 858, 457
- (15) Fynbo, J.P.U., Møller, P., & Thomsen, B. 2001, A&A 374, 443
- (16) Fynbo, J.P.U., Møller, P., & Thomsen, B., et al. 2002, A&A 388, 425
- (17) Grosbøl, P., Banse, K., & Ballester, P. 1999, ASP Conf. Ser. 172: Astronomical Data Analysis Software and Systems VIII, vol. 8, p. 151
- (18) Haehnelt, M.G., Steinmetz, M., & Rauch, M. 2000, ApJ 534, 594
- (19) Hu, E.M., Cowie, L.L., McMahon, R.G., et al. 2002, ApJ, 568, 75
- (20) Kudritzki, R.-P., Méndez, R.H., Feldmeier, J.J., et al. 2000, ApJ, 536, 19
- (21) Kurk, J.D., Röttgering, H.J.A., Pentericci, L., et al. 2000, A&A, 358, L1
- (22) Landolt, A.U. 1992, AJ, 104, 340
- (23) Ledoux, C., Bergeron, J., & Petitjean, P. 2002, A&A, 385, 802
- (24) Miyazaki, S., Komiyama, Y. Sekiguchi, M., et al. 2002, PASJ, 54, 833
- (25) Malhotra, S., & Rhoads, J.E. 2002, ApJL, 565, L71
- (26) Manning, C., Stern, D., Spinrad, H., & Bunker, A. J. 2000, ApJ, 537, 65
- (27) Møller, P., & Warren, S.J. 1993, A&A 270, 43
- (28) Møller P., & Warren S.J. 1998, MNRAS 299, 661
- (29) Møller, P., & Fynbo, J.U. 2001, A&A, 372, L57
- (30) Møller, P., Warren, S.J., Fall, S. M., Fynbo, J.U., & Jakobsen, P. 2002, ApJ, 574, 51
- (31) Ouchi, M., Shimasaku, K., Furusawa, H., et al. 2003, ApJ, 582, 600
- (32) Papovich, C, Dickinson, M., & Ferguson, H.C. 2001, ApJ, 559, 620
- (33) Pascarelle, S.M., Windhorst, R.A., & Keel, W.C. 1998, AJ, 116, 2659
- (34) Pentericci, L., Kurk, J. D., Röttgering, H. J. A., et al. 2000, A&A, 261, L25
- (35) Pettini, M., Smith, L.J., King, D.L., & Hunstead, R.W. 1997, ApJ, 486, 665
- (36) Poli, F., Menci, N., Giallongo, E., et al. 2001, ApJ, 551, 45
- (37) Poli, F., Menci, N., Giallongo, E., et al. 2001, ApJ, 554, 127
- (38) Prochaska, J.X., & Wolfe, A.M. 2002, ApJ, 566, 68
- (39) Roche, N., Lowenthal, J., & Woodgate, B. 2000, MNRAS, 317, 937
- (40) Schaerer, D. 2003, A&A, 397, 527
- (41) Schaye, J. 2001 , ApJL, 559, 1
- (42) Shapley, A. E., Steidel, C. C., Adelberger, K. L., Dickinson, M., Giavalisco, M., & Pettini, M. 2001, ApJ, 562, 95
- (43) Shapley, A. E., Steidel, C. C., Pettini, M., & Adelberger, K.L. 2003, ApJ, 588, 65
- (44) Steidel, C.C., Giavalisco, M., Pettini, M., Dickinson, M., & Adelberger, K. 1996, ApJL, 462, L17
- (45) Steidel, C.C., Adelberger, K., Giavalisco, M., Dickinson, M. & Pettini, M. 1990, ApJ, 519, 1
- (46) Steidel, C.C., Adelberger, K., Shapley, A.E., et al. 2000, ApJ, 532, 170
- (47) Stern, D., Bunker, A., Spinrad, H., & Dey, A. 2000, ApJ 537, 73
- (48) Storrie-Lombardi, S., Irwin, M.J., & McMahon, R.G. 1996, MNRAS, 282, 1330
- (49) Taniguchi, Y., Ajiki, M., Murayama, T., et al. 2003, ApJL, 585, in press
- (50) Valls-Gabaud, D. 1993, ApJ, 419, 7
- (51) Vanzella, E., Cristiani, S., Arnouts, S., et al. 2002, A&A, 396, 847
- (52) Venemans, B.P., Kurk, J.D., Miley, G.K., et al. 2002, ApJL, 569, L11
- (53) Weidinger, M., Møller, P., Fynbo, J.P.U., Thomsen, B., & Egholm, M.P. 2002, A&A, 391, 13
- (54) Wolfe, A.M., Turnshek, D.A., Smith, H.E., & Cohen, R.D. 1986, ApJS, 61, 249