EXPERIENCES WITH AIRBORNE AND GROUND-BASED POLARIMETRY
Abstract
Polarimetry in the far-infrared and submillimeter has been valuable in tracing magnetic fields in bright Galactic Clouds. We discuss the techniques we have developed and trends we have found in polarization column density, and wavelength. The polarization spectrum has proven to be more interesting than had been anticipated. It is potentially valuable in explaining grain alignment and in characterizing dust species. One can expect the infrared cirrus to be a much simpler environment than the molecular clouds that have heretofore been explored at multiple wavelengths. Although cirrus observations must deal with low signals and wide extent, it is becoming possible to measure accurately the spectral energy distribution from mid-infrared to microwave frequencies and it should soon become feasible to determine the polarization spectrum over the same range.
1 INTRODUCTION
Our experiences with airborne and ground-based polarimetry have been primarily with observations of bright Galactic clouds. It is possible that some of those experiences will be relevant to CMB polarimetry. What is certain is that instruments and observations for CMB polarimetry will be valuable for those of us investigating magnetic fields and dust in the Galaxy. What we can say is how we minimize the effects of atmospheric fluctuations and what variations in polarization we observe with column density and wavelength. Almost everything in the first part of this presntation you can find in a Primer on Far-Infrared Polarimetry (Hildebrand et al. 2000).
The second part of the presentation will be about requirements for more powerful instruments in the future: about resolution, area coverage, sensitivity, and observing techniques for more difficult goals such as determining the nature of the IR cirrus.
2 TECHNIQUES AND TRENDS
2.1 Atmospheric Fluctuations
We begin with the problem of fluctuations in atmospheric transmission and emission. What the Primer does not say is that our first attempt to do far-infrared polarimetry was a failure. What we did was simply to rotate an analyzer in front of a photometer. My advice to anyone who is serious about polarimetry is: Don’t follow that bad example. Don’t build a photometer, put a widget in front, and expect to get a first class polarimeter. If you are observing from the ground or an aircraft, your efforts will go largely toward coping with atmospheric fluctuations. Some very talented observers have developed tricks for reducing the effects of those fluctuations (e.g. Jeness, Lightfoot, & Holland 1998), and I hasten to acknowledge that the SCUBA polarimeter at the JCMT which does follow that bad example is the most productive polarimeter there is at 850 . It just isn’t as nearly as good a polarimeter as it could be.
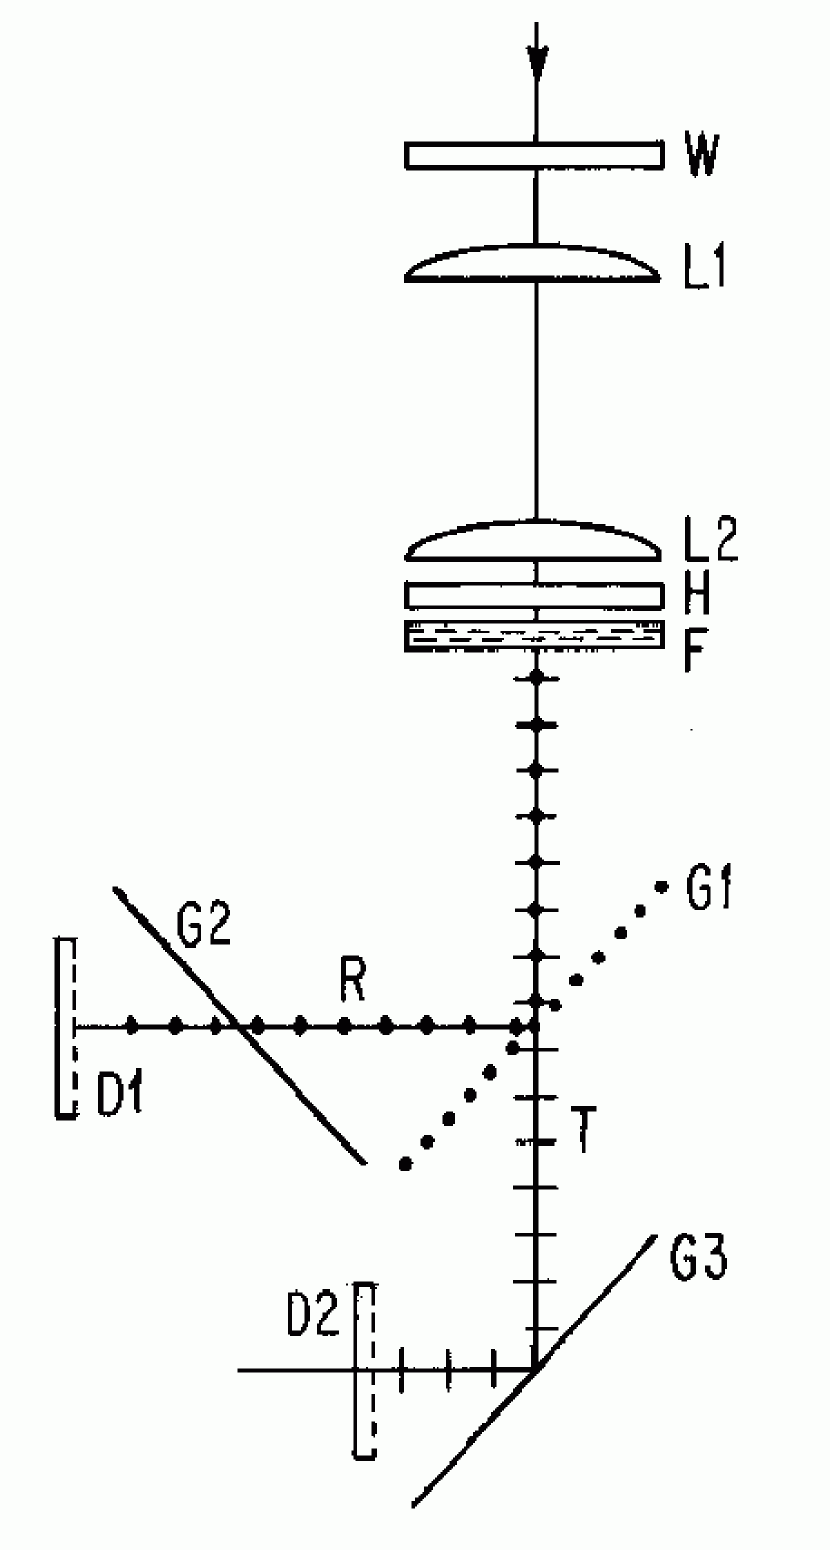
If you want a first class instrument to operate within the earth’s armosphere, follow instead our next example. Build a real polarimeter that detects two components of polarization simultaneously. That can be done the way DASI does it or the way Planck will do it. The way we do it at far-IR and submillimeter wavelengths is to put inside the cryostat a half-wave plate followed by a polarizing beam splitter and to provide detector arrays for the beams reflected and transmitted by the beam splitter. The principle of the apparatus is shown in Figure 1.
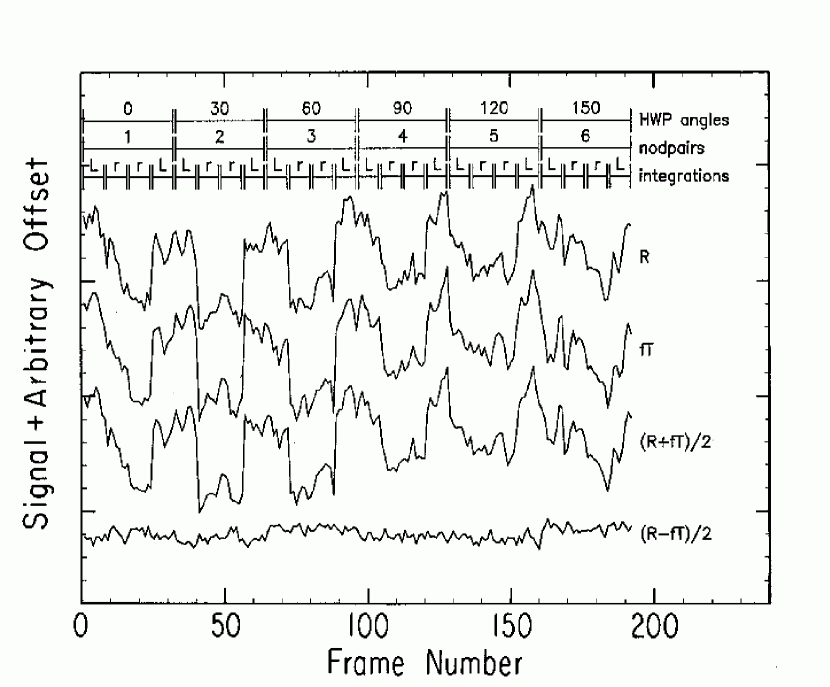
If you chop between points on and off of an object and then, more slowly, nod the telescope so as to put that object first in one beam and then in the other, what you would like to see for each component is a square wave. What you actually see for a faint source is a square wave greatly distorted by fluctuations in the transmission and emission of the atmosphere. Figure 2 shows a strip chart record for 5 minutes of observations of IRC+10216. The flux from this source is ten times the photon-noise-limited NEFD and comparable to the atmospheric fluctuations on 1 minute time scales. Since the fluctuations affect both components simultaneously, they are reduced by more than an order of magnitude when you take the difference of the signals over the sum. The correlation in the noise between the two components is evident. Notice the correlated drifts in the baseline as well as the spikes appearing in each nod pair. The drifts are much larger over a period of an hour. Keep in mind that the radiation reaching the instrument comes primarily from the atmosphere and telescope, not from the object of interest.
Fluctuations in transmission affect the two components by equal factors. Fluctuations in emission affect the components by equal increments and hence are not completely removed when taking the difference in the two components over the sum. The analysis system for faint sources observed over long periods must take that into account.
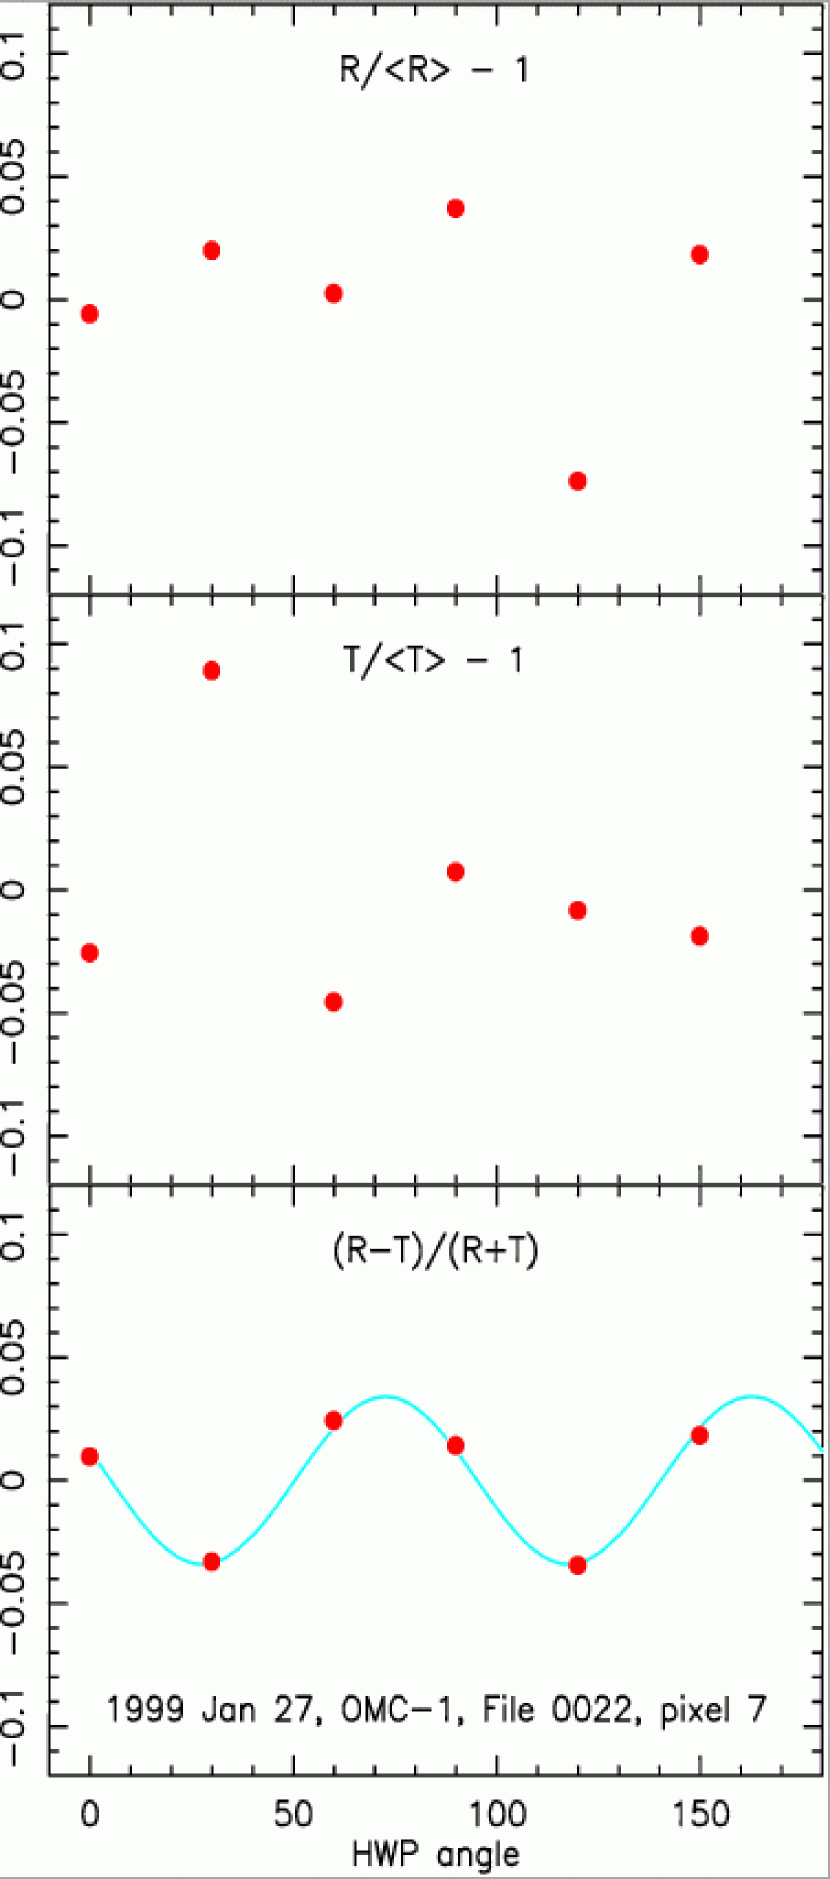
If the source is polarized the amplitude of the square wave should be modulated as you turn the halfwave plate. You can try analyzing the results using only one component at a time. For a faint unpolarized source, the signals for the individual components vary erratically as shown in the top two panels of Figure 3. If instead you do it properly, taking the difference over the sum, a sinusoidal variation giving the amplitude and phase of the polarization appears as shown in the bottom panel.
If your apparatus is in a balloon at 120,000 ft., it will float with the atmosphere and the problem of rapid fluctuations will be much less severe, but long-term drifts will still be a problem.
2.2 Degrees of Polarization vs Optical Depth
We have published an archive of results from airborne polarimetry at 60 and 100 (Dotson et al. 2000). Examples of our ground-based observations from the Caltech Submillimeter Observatory (CSO) at 350 are shown in Figure 4. These maps were made with 32-pixel dector arrays where the performance of the arrays was far below the current state of the art and were made at a wavelength where the degree of polarization is near a minimum (Fig. 6A). Nevertheless significant detections were found at nearly every point. The flux density contours are derived from the sums of the reflected, , and transmitted, , signals.
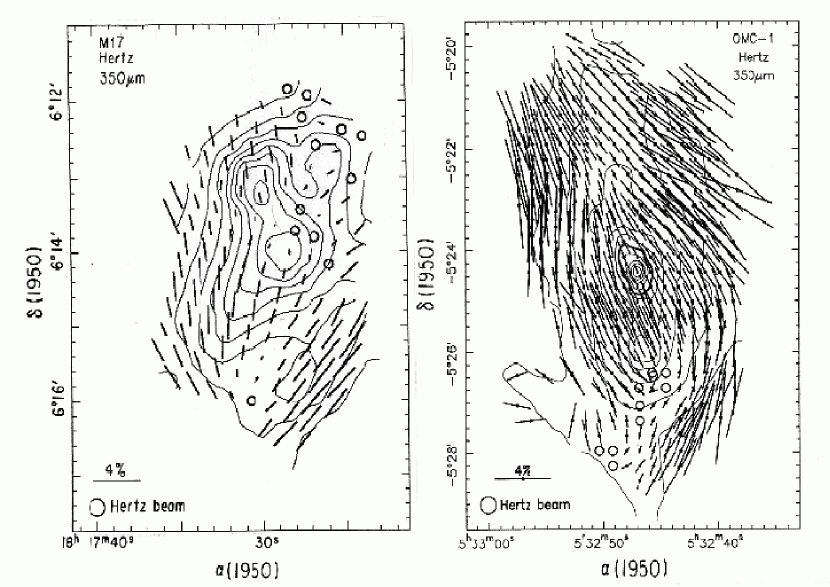
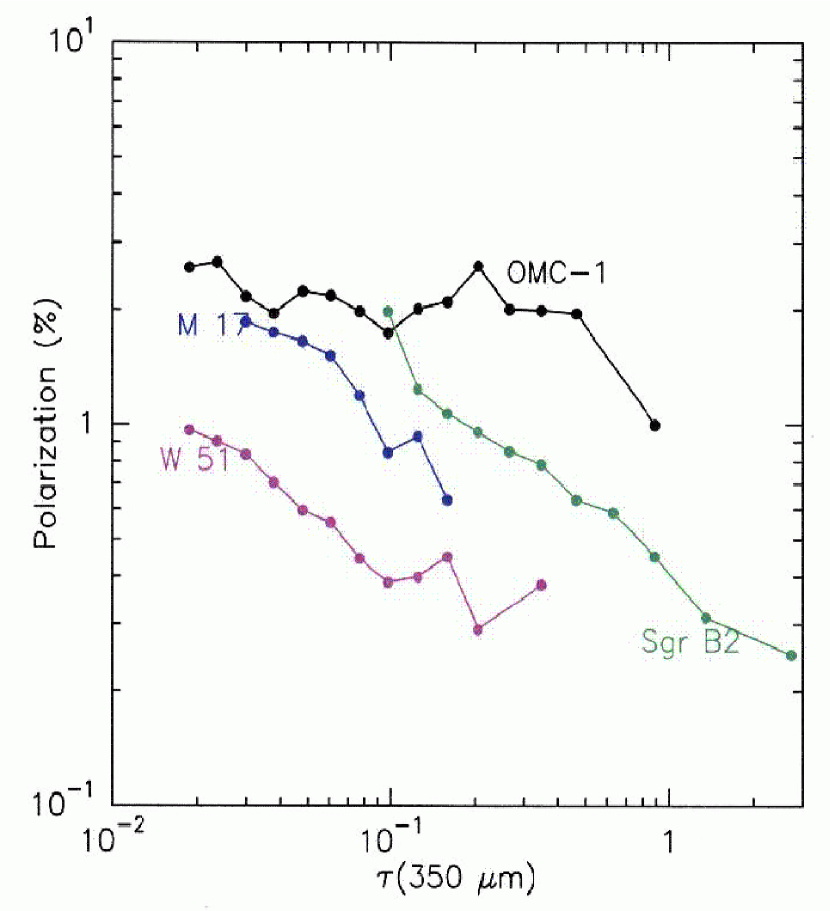
Notice that the degree of polarization, denoted by the length of the vectors in Figure 4, tends to increase toward the lower contours. Figure 5 shows the effect for several molecular clouds. One expects a drop in the degree of polarization at high optical depths due to opacity, but the polarization starts to drop at lower optical depths due to turbulence in the aligning field, as described by Terry Jones at this workshop (see also Jones, Klebe, & Dicke 1992) and, in addition, may increase as if, as we suspect, the conditions for grain alignment are more favorable at low column densities.
2.3 Wavelength-Dependence
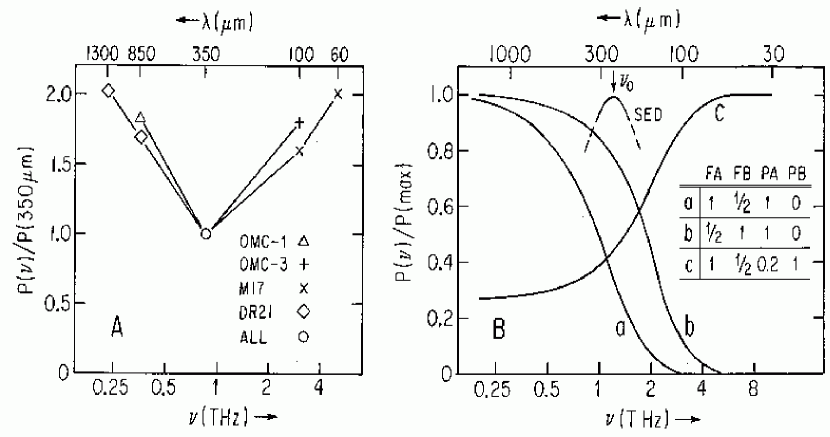
In molecular clouds we find a substantial dependence of polarization on wavelength (Hildebrand et al. 1999; Hildebrand et al. 2000; Hildebrand 2002) in the range 60 to 1300 (Fig. 6A). We interpret wavelength-dependence as evidence that different populations of dust are sampled at different wavelengths, either because domains within a cloud are at different temperatures and have environments more or less favorable to grain alignment, or because grain species within the clouds have different polarizing powers and emissivities.
Molecular clouds are inherently complex. They contain embedded stars, clumps opaque to stellar radiation, surfaces exposed to the interstellar radiation field, and often adjacent HII regions. Their polarization spectra reflect that complex structure. One can expect the polarization spectra of the infrared cirrus to be much simpler if in those clouds all grains are in the same environment. If we adopt the dust temperatures and spectral indices in the two-component model of high latitude cirrus by Finkbeiner, Davis, and Schlegel (1999), then we can use the polarization spectrum and spectral energy distribution to determine the relative abundances, polarizing powers, and spectral indexes of the components. Figure 6B gives examples.
3 FUTURE POLARIMETERS
3.1 Multiple Passbands
The -dependence of shown in Figure 6A is a recent discovery (Hildebrand et al. 1999; 2000; Vaillancourt 2002) based on results from three different instruments, one of which had to be reconfigured to reach 60 (Dowell 1997). To characterize the dust emission in the diffuse Galactic foreground one needs spectral energy distributions and polarization spectra over a wider range of wavelengths than is likely to be spanned by single instruments. The analysis calls for development of additional polarimeters with multiple passbands over the range 50 to 3 . Data from the WMAP archive (Bennett et al. 2003) show the value of multiple passbands at microwave frequencies (Lagache (2003). An important result of microwave observations is that there are large variations in the spectrum from point to point (Finkbeiner, et al. 2002; de Oliveira-Costa et al. 2002).
3.2 Sensitivity: Polarimetry of IR-Cirrus
With Hale, a new polarimeter on SOFIA, we expect a sensitivity at 100 of at 100 and should thus be well within range not only for photometry but also for polarimetry assuming a few per cent. High latitude cirrus clouds are often as bright as a few times 10 , a difficult but probably manageable level. A complication will be that one cannot put the reference beams in cirrus-free regions. It will be necessary to record fluctuations in polarization angle as in microwave background observations. One must be content with measuring power spectra in the degree and angle of polarization taking into account the large-scale magnetic field along the Galactic arms. Fosalba et al. (2002) have measured the angular power spectrum, , of starlight polarization for the Galactic plane (. They find where . High latitude cirrus tend to be closer and hence the power spectra should have reduced high frequenciy components.
3.3 Array Size, Beam Size
No detector arrays for the first round instruments on SOFIA come close to filling the useful focal plane with diffraction-limited and background-limited detectors. But multiplexed read-out systems are reducing the volume required for cold electronics. It may be feasible to install two arrays, each with 1000 TES pixels into the same volume now occupied by one (384-pixel) array of semi-conductor bolometers. No large multiplexed arrays have yet been proven, but expert groups are working at the problem and one can anticipate success in the next year or two.
Our polarimeters, Mark I, Stokes, and Hertz, (Dragovan 1986; Platt et al. 1994; Schleuning et al. 1997; Dowell et al. 1998) have not had diffraction-limited beams. Hertz at the CSO, has 20 arcsec beams but with a proposed upgrade it will have 8 arcsec beams. Hale on SOFIA will have 20 arcsec beams at 200 , 10 arcsec beams at 100 , and 5 arcsec beams at 50 . These may be smaller than are interesting for cosmic background observations but not too small for compact objects such as Sgr A* and protostellar cores.
4
Summary
Our experiences and recommendations relevant to this workshop can be summarized as follows:
1. Minimize effects of atmospheric fluctuations: Observe two components simultaneously. (Figs. 2 & 3)
2. increases as decreases (Figs. 3 & 4).
3. (Fig 6A). We expect variations in IR cirrus unlike those in molecular clouds (Fig 6B)
4. Provide multiple passbands - Calibrate both flux density and polarization measurements
5. To the extent possible, fill the focal plane with diffraction-limited and background-limited pixels.
6. For extended objects (e.g. CMB, IR cirrus), measure angular power spectra in and in the polarization angle.
7. To characterize the polarized dust emission of the cosmic foreground, measure the spectral energy distribution and polarization spectra of IR cirrus over at least the range 60 to a few mm.
4.1 Acknowledgements
I am grateful to my student, Larry Kirby, for help in preparing this manuscript. I thank my former students Jackie Davidson, Jessie Dotson, Darren Dowell, Mark Dragovan, Giles Novak, David Schleuning, and John Vaillancourt for their contributions to the airborne and ground-based work summarized here. I thank Darren Dowell for Figures 2, 3, and 5. Figures 1 and 2 are reproduced with permission from Hildebrand et al. 2000, PASP, 112, 1215. This work has been supported by NSF Grants AST-9987441 and AST-0204886.
5 REFERENCES
-
Bennett, C. L., Hill, R. S., Hinshaw, G., Nolta, M. R., Odegard, N., Page, L., Spergel, D. N., Weiland, J. L., Wright, E. L., Halpern, M., Jarosik, N., Kogut, A., Limon, M., Meyer, S. S., Tucker, G. S., & Wollack, E., 2003, Submitted to ApJ
-
de Oliveira-Costa A., et al. 2002, ApJ, 567, 363
-
Dotson, J. L., Dowell, C. D., Schleuning, D. A., & R. H. Hildebrand. 2000, ApJS, 128, 335 - 370
-
Dowell, C. D. 1997 ApJ, 487, 237
-
Dowell, C. D., Hildebrand, R. H., Schleuning, D. A., Vaillancourt, J. E., Dotson, J. L., Novak, G., Renbarger, T., & Houde, M. 1998, ApJ, 504, 588
-
Draine, B. T. & Lazarian, A. 1998 in Microwave Foregrounds Ed’s, Angelica de Oliveira-Costa and Max Tegmark. Astronomical Society of the Pacific Conf. Series Vol 181
-
Draine, B. T., and Lazarian, A. 1998a, ApJ, 494, L19
-
Draine, B. T., and Lazarian, A. 1998b, ApJ, 508, 157
-
Dragovan, M. 1986, ApJ, 308, 270
-
Finkbeiner, D. P., Davis, M., & Schlegel, D. J. 1999, ApJ, 524,867
-
Finkbeiner, D. P.,Schlegel, D. J., Frank, C., & Heiles, C. 2002, ApJ, 566, 898
-
Fosalba, P., Lazarien, A., Prunet, S., & Tauber, J. A. 2002, ApJ, 564, 762
-
Hildebrand, R. H., Dotson, J. L., Dowell, C. D., Schleuning D. A., & Vaillancourt 1999, ApJ, 516, 834
-
Hildebrand, R. H., Davidson, J. A., Dotson, J. L., Dowell, C. D., Novak, G., and Vaillancourt. J. E. 2000, PASP, 112, 1215. See Errata 2000, PASP, 112, 1620
-
Hildebrand, R. H. In “Astrophysical Spectropolarimetry” Ed: J. Trujillo-Bueno, F., Moreno-Insertis, and F. Sanches. Cambridge University Press (2002). pp 265 – 302.
-
Jenness, T., Lightfoot, J. F., & Holland, W. S. 1998, Proc. SPIE, 3357, 548
-
Jones, T. J., Klebe, D. K., & Dickey 1992, ApJ, 389, 602
-
Lagache, G. 2003. A&A, In press. arXiv:astro-ph/0303335 v1 14 Mar 2003
-
Platt, S. R., Dotson, J. L., Dowell, C. D., Hildebrand, R. H., Schleuning, D. A. & Novak, G. 1994, in Proc. Airborne Astronomy Symposium on the Galactic Ecosystem: From Gas to Stars to Dust. ed. M. R. Haas, J. A. Davidson, and E. F. Erickson. PASP
-
Schleuning, D. A., Dowell, C. D., Hildebrand, R. H., Platt, S. R., & Novak, G. 1997, PASP 109, 307
-
Vaillancourt, J. E. 2002, ApJS, 142, 53