Parameterization of the antiproton inclusive production cross section on nuclei
Abstract
A new parameterization of the inclusive production cross section in proton-proton and proton-nucleus collisions is proposed. A sample of consistent experimental data sets measured on nuclei, from 12 GeV up to 400 GeV incident energy, have been used to constrain the parameters. A broader energy domain is covered for the reaction and with a simplified functional form used in the fits. The agreement obtained with the data is good. The results are discussed.
pacs:
13.85.Ni Inclusive production with identified hadronsI Introduction
An accurate description of the inclusive antiproton production cross section in proton-nucleus collisions, necessarily relies on the empirical approach to the experimental data since theoretical calculations can provide at best approximate values in the current stage of the theory. The aim of the present work was to develop a handy analytical parameterization for the description of the inclusive production cross section in proton-proton () and proton-nucleus () collisions on the basis of the existing body of data, updating the former works on the subject.
The motivations of the work have their origin in the needs of Cosmic Ray (CR) physics where a good knowledge and a good description of the inclusive production cross section is a key requirement for a detailed understanding of the production and propagation of secondary galactic and atmospheric antiprotons. The component of the CR flux is an important window for cosmology. The main contribution to this flux originates from the interaction of the high energy CR flux with the interstellar matter (ISM) in the galaxy. These s are called secondary galactic. In addition to the secondary products, a primary component could exist, undergone for example, by the dark matter neutralino annihilation JU94 or by the evaporation products of primordial black holes BA00 , both being of major physical and astrophysical interest. Such signatures could be obtained only if the basic processes of galactic and atmospheric production cross section in and collisions are known with a good enough accuracy over a momentum range extending from around threshold up to a few hundreds of GeV where the CR flux becomes vanishingly small.
The approach used here closely follows the forms used by Kalinovskii, Mokhov and Nikitin KMN – referred to as KMN in the following – for the description of the cross section. The functional form used in this reference has been modified in order to reproduce a much larger sample of data sets over a much larger dynamical range and for a larger range of nuclear mass, than in the original work. This work extends a previous effort covering a more limited domain of incident momentum and of nuclear mass HU02 ; HU03 .
II Inclusive cross sections in hadron collisions
In high energy hadron collisions the final state is often complex, many particles being produced in the collision. The inclusive single particle production cross section is a quantity of interest in many physics studies, for a reaction , where is the particle of interest and where represents all the other particles produced in any quantum final state allowed in the collision. The invariant inclusive single particle distribution is defined by:
| (1) |
where is the triple differential cross section for detecting particle within the phase-space volume element . is the total energy of , while and are the longitudinal and transverse components of , respectively. The rapidity variable is often used to describe the dependence of the cross section because of its interesting properties in Lorentz transformations BYK . To obtain two last expression in (1), an azimuthal symmetry of the differentiel cross section was used. It is also convenient to introduce the following dimensionless variables:
| (2) |
where is the Feynman scaling variable and the radial scaling variable (which depends only on the radial distance from the kinematic boundary TA76 ), with and being the longitudinal momentum of the particle and its maximum possible value in the center of mass () frame respectively, while similarly and are the total energy of the inclusive particle and its maximum possible value in the frame respectively. The latter can written as , with being the minimum possible mass of the recoiling particle in the considered process and the total energy. Note that for any nuclear collision, the kinematical variables used here will always be expressed in the nucleon-nucleon () rather than in the nucleon-nucleus frame, since the frame is the relevant physical system, the incident nucleon energies being on the scale of 10 GeV while the average binding energy of the nucleon in the nucleus is about 8 MeV. Bound nucleons can be considered as free particles for the incident protons.
A parameterization of the inclusive production cross section can be guided by some general phenomenological features of hadron collisions (See CO84 ; HO73 for the general Physics context).
-
•
All experimental hadronic production cross sections show a strong exponential decrease in transverse momentum, the exponential slope being more or less incident energy and recoil mass dependent.
-
•
Hadronic scaling: The inclusive distribution of particle , is to a good approximation, a function only on and (or ) at the high energy limit . Furthermore, a large number of slow particles is produced (low values), the distribution decreasing rapidly to zero as , like . This form can be explained by the counting rules in parton model.
These features are predicted qualitatively by the Regge poles phenomenology and the parton model.
-
•
For a given , the inclusive distribution of produced particles is (to a good approximation for collisions) symmetric in the rapidity space with , where is the rapidity of the in the laboratory frame (Lab), or in the frame . A forward-backward symmetry of the cross section is expected from first principles (symmetry of the wave function and of the interaction) for the system (In collisions however, the absorption of low energy particles in the nuclear medium may distort the natural symmetry). In the central region where , the inclusive distribution consists of a plateau which width increases slowly with the incident energy. This plateau reduces to a simple maximum over the energy range considered here. The inclusive distribution rises again in the fragmentation region where for particles which can be produced diffractively but it is not the case for and the inclusive distribution falls simply in the fragmentation region.
III Parameterization of the cross section
Following the approach proposed in KMN , the former phenomenological features of hadron collisions have been used to constrain the parameters of a functional form describing the inclusive production cross section, which could reproduce all the relevant experimental data available from and collisions. The data used are listed in Table 1. The measurements on nuclear targets cover basically the whole range of nuclear mass, from proton to lead, over a range of incident energies from 12 GeV up to 400 GeV, matching the useful range for CR studies.
The KMN parameterization used previously KMN is in very poor agreement with the data listed in Table 1, and a reexamination of the analytical approach, better constrained by recent data was necessary. The larger incident energy domain used here required some energy dependence to be introduced in the parameterization following the general features described above as (loose) guidelines.
In this study, the inclusive cross section will be expressed as a function of the three variables, , and (see for example TA76 for the relevance of the choice of these variables):
| (3) |
The following functional form used to describe the production cross section is an evolved version of the KMN formula:
| (4) | |||||
where is the target mass. The total inelastic cross section for collisions was borrowed from LE83 :
| (5) |
where is the incident kinetic energy in MeV.
The 10 parameters - have been fitted to the set of experimental data listed in Table 1 by a standard minimization procedure using the code MINUIT MINUIT .
In relation (4), the term originates from the hadronic scaling properties, namely, the quark counting rules of the parton model of hadronic interactions CO84 (see Sect. II). It was found empirically in this study, that a significantly better result is obtain if the exponent is energy dependent. The factor multiplying the coefficient was found to give the best result. The term is induced by the Regge regime CO84 . The last factor of relation (4) accounts for the transverse momentum dependence of the cross section (see Sect. II). The analysis of the experimental data (Table 1) showed that the term of angular dependence is dominant at low energy, GeV, while the term dominates at high energies, GeV. The dependence has been introduced to allow the transition from the to the dependence. The target mass dependence was accounted for by the factor , with an energy dependent exponent introduced for the same reason as above, at variance with the constant exponent used in the KMN parameterization. The energy dependence used (linear in ) accounts for the experimental increase of this coefficient with the incident energy found using the KMN approach. For incident energies GeV, this coefficient becomes negative.

In Sect. 2, it was mentioned that one of the features of the inclusive distribution is its symmetry in the rapidity space. By construction our parameterization (relation (4)) satisfies this symmetry property since it depends only on , and . This is illustrated in Fig.1 which shows the fit to the 23.1 GeV/ cross section data versus particle rapidity (right) and particle momentum (left). The maximum of the cross section corresponds to particle production with velocity zero in the frame, i.e., traveling with the velocity in the laboratory. The corresponding value of this momentum in the Lab is: . Since the cross section distribution is symmetric in the rapidity space, the upper branch of rapidity with respect to the , completely determines the values of cross section along the lower branch. This is true as well in the Lab frame where the values of the cross section for determine the values below this momentum. In the case of the figure this means that a fit to the experimental values of the cross section above GeV/ also determines the values of the cross section below with the same level of accuracy. Fitting the data from about 2.1 up to 3.2, also determines the cross section down to 0.65, i.e., down to 0.65 GeV/c, the validity of the fit extending likely significantly below this value. This is an important point since experimental cross section data are usually scarce below about 1 GeV, and since the production cross section for these low energy particles is very important because s originating from neutralino (dark-matter) annihilation JU94 or from the evaporation of primordial black holes BA00 , are expected within this energy range.


| Experience | Target | or | kinematical range | |
|---|---|---|---|---|
| GeV/ (GeV) | GeV/ | mrad | ||
| Y.Sugaya et al | C, Cu, Al, Pb | 12 | : 1.02.5 | 89 |
| KEK-PS 1998 SU98 | ||||
| G.J.Marmer et al | Be, Cu | 12.3 | : 0.820, 1.030 | 0, 0.17, 10 |
| ANL 1969 MA69 | ||||
| T.Abbott et al | Al | 14.6 | : 00.3 | |
| BNL 1993 AB93 | : 1.01.6 | |||
| J.V.Allaby et al | , Be, Al, Cu, Pb | 19.20 | : 4.518.3 | 12.570 |
| CERN 1970 AL70 | ||||
| D.Dekker et al | , Be, Pb | 18.8, 23.1 | : 412 | 0, 100 |
| CERN 1965 DE65 | ||||
| T.Eichten et al | Be, Al, Cu, Pb | 24 | : 418 | 17-127 |
| CERN 1972 EI72 | ||||
| P.I.P.Kalmus et al | Be | 2426 | : 0.62.5 | 310 |
| CERN 1971 KA71 | ||||
| J.M.Snow et al | Pt | 28.4 | : 0.6060.730 | 00.17 |
| BNL 1985 SN85 | ||||
| D.S.Barton et al | , C, Cu, Al, Ag, Pb | 100 | : 3088 | |
| FNAL 1983 BA83 | : 0.3, 0.5 | |||
| J.R.Johnson et al | 100, 200, 300 | : 0.251.5 | ||
| FNAL 1978 JO78 | ||||
| W.F.Baker et al | Be | 200, 300 | : 23197 | 3.6 |
| FNAL 1974 BA74 | ||||
| J.W.Cronin et al | Be, Ti, W | 300 | : 0.766.91 | 77 |
| FNAL 1975 CR75 | ||||
| D.Antreasyan et al | , , Be, Ti, W | 200, 300, 400 | : 0.776.91 | |
| FNAL 1979 AN79 | ||||
| K.Guettler et al | : 0.10.3 | |||
| CERN 1976 GU76 | ||||
| P.Capiluppi et al | : 1.510 | 80350 | ||
| CERN 1974 CA74 |
IV Results for nuclear targets
The data used in the fit procedure are summarized in Table 1. The fit sample included measurements from 12 GeV up to 400 GeV incident proton Lab energy on nuclear targets going from Deuterium up to Pb nuclei, and for momentum transfers up to 6.91 GeV/. For collisions, the incident energy extended from about 6 up to 63 GeV.
| parameter | |||||
|---|---|---|---|---|---|
| value(error) | 0.16990(4) | 10.28(13) | 2.269(7) | 3.707(27) | 0.009205(2) |
| parameter | |||||
| value(error) | 0.4812(14) | 3.3600(2) | 0.063940(73) | 0.1824(15) | 2.4850(6) |
| system | parameterization | per point |
|---|---|---|
| KMN KMN | 80.0 | |
| this work (4) | 5.3 | |
| Tan and Ng TA82 | 28.1 | |
| this work (6) | 3.6 |
The per point obtained with the parameterized relation (4) is 5.32 (Table 3) for 654 experimental points (see list in Table 1). The values of the parameters obtained in the fit are given in Table 2 together with error. The correlation coefficients between the parameters determined in the search are given in appendix. The results for nuclear targets (A2) are shown on Figs 2 to 6 where the data points are compared with the calculated values are given in appendix. The values of the per point of each set are given in the figures. In each case, some basic informations (Authors, beam energy, target nuclei, and per point obtained for the considered set) are given on the figures. In all the figures, the top distribution corresponds to the measured cross section, while each next distribution below has been multiplied by a 10-1 factor with respect to the previous one, for the legibility of the figure.
As it can be seen on the figures, the quality of the fits varies from fair to excellent. A poor fit is obtained however for the 24–26 GeV data from KA71 , the calculations underestimating the data by a factor of about 2. Nevertheless, this set has been kept in the fit procedure since its contribution is small and not hardly affects the results (which is not the case for the data listed in Table 4). To the opposite, outstandingly good fits have been obtained consistently and simultaneously for the CERN data from AL70 ; EI72 in the 20–25 GeV incident energy range, and for the high energy and large momentum transfer data from CR75 ; AN79 .
Table 3 compares the values of the per point obtained in the present study, with that obtained using the KMN relation KMN for the same data. The latter is seen to be more than one order of magnitude larger than the value obtained using (4). This gives the scale of the improvements achieved by the present study on the issue.
These results demonstrate the ability of the proposed parameterization to describe the inclusive production cross section on nuclei over the quoted ranges of incident energy, momentum transfer, and target mass, with a good accuracy.
| Experience | target | / | kinematical range | |
|---|---|---|---|---|
| (GeV/) | (GeV/) | (mrad) | ||
| Yu.M.Antipov et al | Al | 70 | : 1060 | 0 |
| IHEP 1971AN71 | ||||
| V.V.A.Abramov et al | C, Al, Cu, Sn, Pb | 70 | : 0.994.65 | 160 |
| IHEP 1984 AB84 | ||||
| W.Bozzoli et al | Be, Al, Pb | 200 | : 2037 | 0 |
| CERN 1978 BO78 | ||||
| I.G.Bearden et al | Be, S, Pb | 450 | : 48.5 | 37, 131 |
| CERN 1998 BE98 | : 0.111.28 |
IV.1 Data discarded from the selection


The data listed in Table 4 were not included in the fit sample, because of their obvious inconsistency with the other data. This is illustrated on Figs. 7 and 8 where they are compared to the best fit calculations obtained in the previous step on the selected sample. As it can be seen, the difference between data and calculated values amounts up to about one order of magnitude. The ratio goes from 2 to 10 for the Serpukhov experiments AB84 ; AN71 . For AN71 , it is about 5, and consistent with a simple normalization problem.
A larger and more surprising disagreement is found with some recent CERN data from NA44 BE98 , in particular for the measurements in the small rapidity bin. Note also that the parameterization (6) describes quite well the data from AN79 obtained on the same targets as BE98 over a wider kinematical region (see Fig. 6).
The cross section data from BO78 appearing in the table, were given in the original works in units of the corresponding production cross section measured at the same momentum. Although the absolute value could be obtained using the known cross section, the results were considered too inaccurate however, and discarded from the selected sample.
IV.2 Analysis of the data
| parameter | |||||||
|---|---|---|---|---|---|---|---|
| value(error) | 3.4610(20) | 4.340(20) | 0.007855(3) | 0.5121(27) | 3.6620(5) | 0.023070(1) | 3.2540(77) |


This reaction is the dominant contribution to the secondary production induced by Cosmic Rays, since the interstellar gas is mainly constituted of hydrogen gas. It is thus important to obtain as accurate a description as possible for the cross section.
Considering separately the collision data in Table 1, the parameterization (4) gives for the best fit a value of the per point of 7.08. For the same data, the well known parameterization of Tan and Ng TA82 gives a value of 28.1. In addition, this latter parameterization is valid only for GeV/ and is not able to reproduce the large data such as those from CR75 and AN79 where GeV/. Note also that Tan and Ng’s parameterization contains 8 parameters for GeV GeV/) and 17 for GeV.
However, in the course of the study, it appeared that some of the parameters of relation (4) had no incidence on the resulting fits. The parameterization (4) has then been revisited and simplified from some of its parameters irrelevant for this particular reaction and from other parameters which turned out to be ineffective in the minimization procedure, resulting in the following functional form for inclusive production cross section :
| (6) | |||||
In comparison with relation (4), the dependence with the mass of the target has been removed since the only proton target is considered in this case. In addition, the energy dependent factors in front of and in (4) have been also removed because of their ineffectiveness in the minimization procedure.
The parameters to have been adjusted by the same minimization procedure as previously MINUIT , to the set of experimental data listed in Table 1 restricted to collisions. With formula (6), the per point obtained for the best fit is 3.59, for 228 experimental point, instead of 7.08 with relation (4). The values of the fit parameters obtained with (6) are given in Table 5. The correlation coefficients between the parameters determined in the search are given in appendix. Note that the values of the coefficients and , and , respectively, are of the same order of magnitude. This was expected since they describe the same physics in the relations (4) and (6).
Figs. 9 and 10 show the data analyzed, compared with the best fit results obtained for the whole and data sets from Table 1, using relation (4) (dashed line) and with those obtained for the data only using relation (6) (solid line). The simplified form (6) clearly provides a significantly better account of the measured cross sections, the value obtained being better by a factor of about 2 (about 3.6 against about 7).
V Antiproton mean multiplicity
In this section, the antiproton mean multiplicity, defined as
| (7) |
and depending only on , has been computed by means of relations (4) and (6) and compared with the experimental data in collision AN73 . Note that the original data from AN73 have been corrected from the single-diffractive contribution to the total inelastic cross section GI01 . The corrected antiproton mean multiplicity should thus be somewhat smaller than the measured values (by 15–20%).
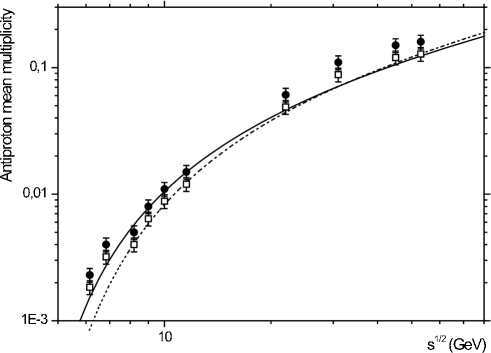
The results, shown on Fig. 11, are in good agreement with the experimental data. Note that below 15 GeV/, the results given by the relation (4) and (6) become significantly different (about a factor 2 at the maximum). As expected, the simplified form (6) gives a little bit better results since the experimental data are from collisions.
VI Conclusion
The parameterization of the inclusive production cross section on nuclei has been revisited by investigating a broad collection of data sets available, covering a large dynamical domain of incident energy and of momentum transfer, for a broad range of nuclear masses. Good results have been obtained but for a small sample of data sets inconsistent with the other data. The experimental inclusive production cross sections can be reproduced to within a few tens of percent over this range, i.e., for incident energies from 12 GeV up to 400 GeV, and for target mass . Theses results constitute a significant improvement with respect to the former KMN parameterization, decreasing by a factor of about 15 the value of the per point obtained using the latter. A simplified version of the functional form has been developed for collisions giving also good results up to very high energies, much beyond the range dictated by the Cosmic Ray Physics requirements which motivated the study. This also constitutes an improvement, consistent with the data on nuclei, of the Tan and Ng formula used so far as a standard in the calculations.
The parameterisations (4) and (6) are also able to reproduce the experimental antiproton mean multiplicity measured in collision with a good accuracy.
A point to be emphasized is that because of the symmetry of the cross section in the rapidity space, the fitted range in the Lab momentum of the particle, usually measured above the rapidity, also determines the cross section at low momenta, a range of major importance for Cosmic Ray antiprotons where accuracy is extremely important.
Acknowledgements.
The authors are grateful to Michael Murray for helpful discussions on the NA44 data.VII Appendix
The symmetrical matrix (8) and (9) give respectively the correlation coefficients for the parameters and of equations (4) and (6) respectively.
In relation (4), the coefficients and appear to be strongly correlated (correlation coefficient 0.961), as it could be expected from their functional dependence. On the contrary, coefficient and are not correlated (correlation coefficient 0.232), since effective in different energy ranges (see Sect. III). The same remarks apply to the coefficients .
| (8) |
Correlation coefficients for the parameters given in Tables 2.
| (9) |
Correlation coefficients for the parameters given in Tables 5.
References
- (1) see for example G. Jungman et al., Phys. Rev. D. 49, 2316 (1994).
- (2) A. Barrau et al., A&A 288, 676 (2002)
- (3) A.N. Kalinovskii, M.V. Mokhov, and Yu.P. Nikitin, Passage of high-energy particules through matter, American Institute of Physics, 1989.
- (4) C.Y. Huang and M. Buénerd report ISN-01-18, March 2001; C.Y. Huang PhD thesis, University of Grenoble, Mai 2002.
- (5) C.Y. Huang, L. Derome, and M. Buénerd, submitted to Astropart. Phys.
- (6) E Byckling and K. Kajantie, Particle kinematics, Wiley Interscience, 1973
- (7) F.E. Taylor et al., Phys. Rev. D. 14, 1217 (1976).
- (8) P.D.B.Collins and A.D.Martin, Hadron Interaction, Adam Hilger Ltd, Bristol, 1984
- (9) D. Horn and F. Zachariasen, Hadron Physics at Very High Energy, W.A. Benjamin, Inc. Advances Book Program, Massachusetts, 1973
- (10) J.R. Letaw et al., Astropart. J. Suppl. 51, 271 (1983).
- (11) F. James MINUIT Fonction Minimisation and Errore Analysis, CERN, Program Library Long Writeup D506, 1998.
- (12) Y. Sugaya et al., Nucl. Phys. A 634, 115 (1998).
- (13) G.J. Marmer et al., Phys. Rev. 179, 1294 (1969).
- (14) T. Abott et al., Phys. Rev. D. 47, 1351 (1993).
- (15) J.V. Allaby et al., CERN-70-12 Nuclear Physics Division (1970).
- (16) D. Dekker et al., Phys. Rev. 51, 271 (1965).
- (17) T. Eichten et al., Nucl. Phys. B44, 333 (1972).
- (18) P.I.P. Kalmus et al., CERN-71-25 Nuclear Physics Division (1971).
- (19) J.M. Snow et al., Phys. Rev. D. 32, 11 (1985).
- (20) D.S. Barton et al., Phys. Rev. D. 22, 2580 (1983).
- (21) J.R. Johnson et al., Phys. Rev. D. 17, 1292 (1978).
- (22) W.F. Baker et al., Phys. Lett. B51, 303 (1974).
- (23) J.W. Cronin et al., Phys. Rev. D. 11, 3105 (1975).
- (24) D. Antreasyan et al., Phys. Rev. D. 19, 764 (1979).
- (25) K. Guettler et al., Nucl. Phys. B116, 77 (1976).
- (26) P. Capiluppi et al., Nucl. Phys. B79, 189 (1974).
- (27) Yu.M. Antipov et al., Phys. Lett. B34, 164 (1971).
- (28) V.V. Abramov et al., Z. phys. C, 205 (1984).
- (29) W. Bozzoli et al., Nucl. Phys. B144, 317 (1978).
- (30) I.G. Bearden et al., Phys. Rev. C. 57, 837 (1998).
- (31) L.C. Tan and L.K. Ng et al, Phys. Rev. D.26, 1179 (1982).
- (32) R.P. Duperray, K.V. Protasov, A.Yu. Voronin Eur. Phys. J. A16, 27 (2003)
- (33) R.P. Duperray, K.V. Protasov, L. Derome and M.Buénerd, submitted to Eur. Phys. J. /nucl-th 0301103
- (34) R.P. Duperray et al., ICRC2003 Conf. Proc., Tsukuba (Japan), July 30 - Aug. 7, 2003.
- (35) M. Antinucci et al., Lettere Al Nuovo Cimento 6, 121 (1973).
- (36) G. Giacomelli et al., Il Nuovo Cimento 24C, 575 (2001).