The Vela Pulsar in the Near-Infrared††thanks: Based on observations collected at the European Southern Observatory, Paranal, Chile (ESO Programme 66.D-0568).
We report on the first detection of the Vela pulsar in the near-infrared with the VLT/ISAAC in the Js and H bands. The pulsar magnitudes are and . We compare our results with the available multiwavelength data and show that the dereddened phase-averaged optical spectrum of the pulsar can be fitted with a power law with , assuming the color excess based on recent spectral fits of the emission of the Vela pulsar and its supernova remnant in X-rays. The negative slope of the pulsar spectrum is different from the positive slope observed over a wide optical range in the young Crab pulsar spectrum. The near-infrared part of the Vela spectrum appears to have the same slope as the phase-averaged spectrum in the high energy X-ray tail, obtained in the keV range with the RXTE. Both of these spectra can be fitted with a single power law suggesting their common origin. Because the phase-averaged RXTE spectrum in this range is dominated by the second X-ray peak of the pulsar light curve, coinciding with the second main peak of its optical pulse profile, we suggest that this optical peak can be redder than the first one. We also detect two faint extended structures in the 11 vicinity of the pulsar, projected on and aligned with the south-east jet and the inner arc of the pulsar wind nebula, detected in X-rays with Chandra. We discuss their possible association with the nebula.
Key Words.:
Infrared: general – pulsars: individual: Vela pulsar – stars: neutronshib@astro.ioffe.rssi.ru
1 Introduction
The Vela pulsar was firmly identified in the optical range by the detection of optical pulsations with the radio pulsar period (Wallace et al. (1977); Manchester et al. (1978)). The identification has been further confirmed by measuring the proper motion and parallax of the radio pulsar and its optical counterpart (Legge (2000); Caraveo et al. (2001)), by broad-band photometry revealing peculiar colors of the counterpart typical for the optical emission of rotation powered pulsars (Lasker (1976); Mignani & Caraveo (2001) and refs. therein), and by the high polarization of the optical emission (Wagner & Seifert (2000)). The Vela pulsar is an intermediate age, yr, isolated neutron star (NS). Its parameters are listed in Table 1.
In comparison with older pulsars detected in the optical range (see, e.g., Mignani et al. (2000)), the Vela pulsar with V= 236 is brighter by at least stellar magnitudes. However, available spectral information on its optical emission has been limited to broad-band UBVRI photometry (Mignani & Caraveo (2001)), which suggests a flat optical spectrum typical for young Crab-like pulsars. This is in contrast to the middle-aged, yr, pulsars PSR B065614 and Geminga whose broad-band spectra are less monotonous, and to the strong excess in the near infrared (IR) part of the spectrum of PSR B065614 (Koptsevich et al. (2001)). This may be an evidence of spectral evolution of the optical emission with pulsar age. The young Crab pulsar shows no excess in the IR. Thus, the extension of the spectrum of the Vela pulsar towards the IR is useful to determine whether the optical properties of this pulsar are closer to those of younger or middle-aged NSs, and to get additional constraints on the pulsar spectral evolution with age.
The Vela pulsar has also been studied in the high energy range, from soft X-rays to -rays (e.g., Pavlov et al. 2001b ; Harding et al. (2002) and refs. therein). Its multiwavelength spectrum is presumably nonthermal with different slopes in different high energy ranges. An exception is the soft X-ray range where a strong excess over a power law111Hereafter PL, . background is believed to be due to the thermal emission from the surface of the NS (Ögelman et al. (1993); Pavlov et al. 2001b ). Different slopes imply different nonthermal radiation mechanisms at work in the magnetosphere of the pulsar (e.g., synchrotron, curvature, inverse Compton scattering radiation, etc.). These mechanisms are involved in different ways in the two competing models for the non-thermal emission of pulsars, the “polar cap” model (e.g., Daugherty & Harding (1996)) and the “outer gap” model (e.g., Cheng et al. (1986); Romani (1996)).
| Observed | Derived | |||||||||||||
|---|---|---|---|---|---|---|---|---|---|---|---|---|---|---|
| , | , | |||||||||||||
| ms | mas yr-1 | mas | cm-3 pc | Myr | G | erg s-1 | pc | |||||||
| 89 |
|
|
0.011 | |||||||||||
| a Proper motion, parallax, and parallax-based distance (Caraveo et al. (2001)) | c Dispersion measure |
| b Galactic coordinates | d Dynamical age |
It is not yet clear which of these competing models best represents the observations, and which radiation mechanisms are actually responsible for the observed emission in each band. In this respect, observations in the IR are important to get additional constraints on these mechanisms and models. For instance, in the polar cap model IR photons, as well as optical ones, can be produced by inverse Compton scattering of softer photons by primary and/or pair cascade relativistic particles in the magnetosphere.
A symmetrical Crab-like pulsar wind nebula (PWN) with a torus and jet structure has recently been detected in X-rays with the Chandra observatory around the Vela pulsar (Helfand et al. (2001); Pavlov et al. 2001b ; Pavlov et al. 2001a ). Being fainter than the Crab PWN, the Vela nebula has not yet been detected in the optical range, perhaps because the pulsar field is crowded by background stars. Some of the structures of the Crab PWN, identified in the optical, appear brighter in the near-IR range (Sollerman & Flyckt (2002)), showing a PL spectrum with a negative slope close to that observed in X-rays. There are indications that the X-ray Vela PWN has a PL spectrum of a similar slope (Gotthelf & Olbert (2002)). In this context, deep imaging of the Vela pulsar field in the near-IR might be more promising than imaging in the visual range for detection of the Vela PWN and for studying the mechanisms of the interaction between the relativistic pulsar wind and the ambient matter.
Here we report on the first detection of the Vela pulsar in the near-IR Js and H bands, obtained with the VLT. The observations, data reduction, astrometry, and photometry are described in Sect. 2. The results are discussed in Sect. 3 in conjunction with the data available in other spectral bands, and summarized in Sect. 4.
2 Observations and data analysis
2.1 ISAAC observations and data reduction
The field of the Vela pulsar was observed during three nights, December 14 and 15, 2000, and January 5, 2001 with the Infrared Spectrometer And Array Camera222See http://www.eso.org/instruments/isaac/ for details on the instrument, filters and observational technique. (ISAAC) attached to the Antu Telescope (UT1) of the European Southern Observatory’s Very Large Telescope (ESO VLT). A log of the observations is given in Table 2. In the SW (Short Wavelength) imaging mode, the Rockwell Hawaii HgCdTe 10241024 array detector was used. The pixel size on the sky was 0147 and the field-of-view was 2525. The observations were performed in the Js and H bands in jitter mode, with a jitter box size of 20′′. The Js filter is being established as the new standard broadband filter at m by most major observatories (Keck, Gemini, Subaru, ESO), and is photometrically more accurate than the classical J because it is not cut off by atmospheric absorption (Simons & Tokunaga (2002); Labbè et al. (2003)). The detector integration times (DITs) were 45 s and 13 s in the Js and H bands, respectively. Each observation was built up by a number of DITs per exposure (NDITs), where we used 4 NDITs for the Js band and 6 NDITs for the H band. The number of exposures (NEXP) in each observational block (ObsID) was 13 in Js and varied from 12 to 26 in the H band. Total exposure times (NDITDITNEXP summed over all ObsIDs) were thus 7020 s and 8268 s in the Js and H bands, respectively.
| Band | Date | Timea | Exposure | Airmass | Seeingb |
| UT | UT | s | arcsec | ||
| Js | 14.12.00 | 7:45 | 2340 | 1.072 | 0.7 |
| 15.12.00 | 6:33 | 2340 | 1.084 | 0.6 | |
| 7:18 | 2340 | 1.069 | 0.5 | ||
| H | 15.12.00 | 8:03 | 1014 | 1.076 | 0.5 |
| 8:29 | 1092 | 1.094 | 0.5 | ||
| 8:54 | 936 | 1.118 | 0.7 | ||
| 05.01.01 | 6:20 | 2028 | 1.073 | 0.5 | |
| 7:05 | 2028 | 1.103 | 0.4 | ||
| 7:51 | 1170 | 1.150 | 0.4 |
| a Refers to the first image of the ObsID. | ||
| b Full width at half maximum of the stellar profile. |
The data were reduced with the Eclipse333See http://www.eso.org/projects/aot/eclipse/. and NOAO IRAF software. Dark and flatfield images were prepared using standard Eclipse recipes. Then each ObsID was considered separately. Image offsets were determined using the geomap routine and four field stars. The sky background level was determined and the images were summed using the routine jitter with the parameters RejectHalfWidth = 7, RejectMin = 2, RejectMax = 4, which were chosen based on the resulting image statistics. The parameters of the fully reduced images for each ObsID are summarized in Table 2. Finally, offsets between these images were determined and the images were combined. Parts of the resulting images444Images are available in FITS format at http://www.ioffe.ru/astro/NSG/obs/vela-ir/. containing the pulsar are shown in Fig. 1. Contour maps of these images are also presented in this figure. Isophotes of the contour maps correspond to the levels (in counts) above the background , where is the mean sky value near the pulsar, is the sky standard deviation per pixel, and .
2.2 Astrometry and morphology of the pulsar field
For astrometrical referencing of the VLT images we used the HST/WFPC2 image obtained on January 15, 2000 (Caraveo et al. (2001)). The pulsar is clearly detected in this image. Positions of 11 reference stars from the image were used to construct the coordinate transformation between the HST and VLT images with the IRAF routines geomap/geoxytran. The rms errors of the transformation were less than one third of the ISAAC pixel size in both RA and Dec. The pulsar position in the ISAAC images at the epoch of the VLT observations was calculated using the pulsar pixel coordinates in the HST image and the pulsar proper motion (Caraveo et al. (2001)). This position is marked by a cross in the contour plots of the Js images in Fig. 1. The pulsar counterpart is clearly detected with the offsets 555Hereafter the numbers in parentheses are uncertainties referring to the last significant digit quoted, for example, , . and 001(2) in RA and Dec, respectively, from this position. The errors account for the centering uncertainties in the ISAAC images, coordinate transformation and the pulsar proper motion uncertainties.
Three point-like objects, o1, o2, and o3, are detected in the 6″6″ vicinity of the pulsar. They are marked in the H-band contour plot in Fig. 1, and their offsets from the pulsar position are listed in Table 3. The faintest object o1 is detected only in the H band.
An extended structure is seen in the 15 vicinity south of the pulsar. The structure is more pronounced in the H band, but can also be marginally detected in the Js image, although with a different shape. The examination of the structure in each ObsID shows that its shape varies from one ObsID to another. To discriminate the pulsar from the extended structure, the IRAF/DAOPHOT software was used to construct a point spread function (PSF) in both bands using 10 field stars. The pulsar spatial profile was fitted with this PSF and subtracted from the images. The subtracted images are presented in Fig. 1.
The extension of the structure in the Js band is aligned with the south-east counter-jet from the pulsar detected in X-rays with the Chandra observatory (Helfand et al. (2001); Pavlov et al. 2001a ). The X-ray counter-jet is directed opposite to the pulsar proper motion marked by an arrow in the Js contour plot in Fig. 1. It extends up to ″ from the pulsar. The ISAAC structure can be a near-IR signature of the X-ray jet in the 2″ vicinity of the pulsar. However, visual inspection of the 2″ vicinity of the pulsar in the Chandra/HRC image does not reveal any such structure. It may be hidden in the complicated pulsar PSF profile of the HRC image.
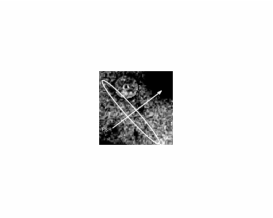
We found in the ISAAC images also a hint of a faint thin elongated structure, overlapping with the central part of the inner arc of the Vela PWN in the Chandra/ACIS images (Pavlov et al. 2001a ). The structure is seen within the ellipse in Fig. 2. It is aligned approximately perpendicular to the pulsar proper motion direction, as is the X-ray arc, and its offset from the pulsar is 31 along this direction. The structure is detected at only level and only in the Js band (see Sect. 2.3 for details). However, inspection of each separate ObsID image (see Table 2) shows that the structure is absent only in the first Js image, which has the worst seeing, but it is present in the two other images.
To search for the detected extended structures in the images in adjacent bands we examined also the archival RI band images of the pulsar field, obtained with the VLT/FORS666Based on ESO programme 63.P-0002. on April 12, 1999 (Wagner & Seifert (2000)), and in the F675W (overlaps with R) and F814W (overlaps with I) bands, obtained with the HST/WFPC2777Based on observations made with the NASA/ESA Hubble Space Telescope, obtained from the data archive at the Space Telescope Institute. STScI is operated by the association of Universities for Research in Astronomy, Inc. under the NASA contract NAS 5-26555. on March 19, 2000 and on March 15, 2000, respectively (Mignani & Caraveo (2001)). The reduced images are shown in Figs. 3 and 4. The pulsar is reliably detected in all bands, while the extended structures and o1 are not seen in any of them. The extended structure near the pulsar could not be seen even after the pulsar PSF was subtracted in the RI bands (Fig. 3). The object o2 is seen in both HST bands (integrated exposure time 2600 s), but it is only barely visible in the VLT I band and not detected in the short R band exposure (300 s). This object and the extended structures are also not visible in the HST/WFPC2/F555W image (Caraveo et al. (2001)). This means that the detected extended structures, as well as o1, are red objects. To conclude whether these objects are associated with the pulsar nebula or they are background objects, additional observations are required. A change in brightness of these objects would strongly support their association with the highly variable structure of the PWN, as has been observed in X-rays (Pavlov et al. 2001a ). Note that wisp structures have been detected and studied close to the Crab pulsar in X-rays and in the optical (Hester et al. (2002)), and in the IR (Sollerman & Flyckt (2002)). In X-rays and in the optical, the observations show that the wisps vary in flux on a time scale of about one day.
2.3 Photometry
The photometric zeropoints for the ISAAC observations, and , were derived using images of the standard star FS13, observed on December 15, 2000. The J band catalog magnitude of FS13 (Hawarden et al. (2000)) was used for the Js band. Differences in zeropoints between different ObsIDs were estimated comparing magnitudes of 6 field stars. The differences proved to be no larger than 1% in the Js and 2% in the H bands, and were accounted for only in the resulting photometric error budget. The average Paranal atmospheric extinction of 0.06 mag airmass-1 was used in both bands888See http://www.eso.org/instruments/isaac/imaging_stan dards.html. The fluxes of point-like objects were measured in apertures with diameters closest to mean seeing values (see Table 2), i.e., 4 pix in Js and 3 pix in H. Aperture corrections for the magnitudes were determined using 3 field stars. These stars, as well as the aperture diameters, were chosen to minimize the uncertainties of aperture corrected magnitudes of the faint pulsar, in both filters simultaneously.
An additional check of the photometry was performed using the IR-survey 2MASS999http://irsa.ipac.caltech.edu/. Since the region of the Vela pulsar is not yet released in the archive catalog, we performed photometry of 10 stars present in the J and H bands of the 2MASS “Quicklook Images” and in our ISAAC images. Their comparison shows that magnitude discrepancies are and . The discrepancy in the J band can be partly attributed to the difference in throughput of the J and Js filters. Although photometry on the 2MASS “Quicklook Images” is not recommended because of their poor quality, we regard the obtained coincidence at the 1 level as a confirmation of the accuracy of our photometric referencing of the ISAAC data.
The pulsar magnitudes, determined with aperture photometry, are and . In addition, the pulsar profile was fitted with the PSF constructed using IRAF/DAOPHOT. The PSF-fitted magnitudes are and . They differ by 1 from the aperture photometry magnitudes. This difference may be attributed to the contamination of the pulsar counts measured with the aperture photometry by the extended structure near the pulsar. We therefore consider the PSF-fitted magnitudes more reliable. Using these magnitudes and the flux zeropoints by van der Bliek et al. (1996), the measured fluxes from the pulsar are Jy and Jy. We performed aperture photometry of the nearby objects o1, o2, and o3, which are marked in Fig. 1. The results of the photometry are summarized in Table 3.
We also measured the surface brightness of the extended source in the 15 vicinity of the pulsar. It was measured on the images with the pulsar subtracted over the area (2.4 arcsec2, the same in both bands) which covers the brightest parts of the structure. The surface brightnesses are 22.98(5) mag arcsec-2 or 1.08(5) Jy arcsec-2, and 21.51(7) mag arcsec-2 or 2.66(16) Jy arcsec-2, in the Js and H bands, respectively. The surface brightness of the second structure projected at the PWN inner arc (see Fig. 2) in the Js band is 25.8(7) mag arcsec-2 or 0.08(4) Jy arcsec-2, and the respective upper limit in the H band is 24.44 mag arcsec-2 or 0.18 Jy arcsec-2.
| Object | Offset | H | Js | I | HST/F814W | R | HST/F675W | ||||||||||||||||||||||||
|---|---|---|---|---|---|---|---|---|---|---|---|---|---|---|---|---|---|---|---|---|---|---|---|---|---|---|---|---|---|---|---|
| PSR | - |
|
|
|
|
|
|
||||||||||||||||||||||||
| o1 |
|
|
|
- |
|
- |
|
||||||||||||||||||||||||
| o2 |
|
|
|
- |
|
- |
|
||||||||||||||||||||||||
| o3 |
|
|
|
|
|
|
|
Since no photometric standards were observed during the night of the VLT observations in the RI bands, the photometric equations were determined from the Landolt standards101010Fields of PG1323085, PG1633099, and PG1657078 (Landolt (1992))., observed on the night before:
Here and are the Cousins magnitudes, and are the instrumental magnitudes. The ambient conditions monitor111111Available at http://archive.eso.org/asm/ambient-server shows that the average atmospheric extinction coefficient during the observations of the standards was in the range 0.1400.155 mag/airmass, and at the time of the pulsar field observations it was 0.150 mag/airmass. Since the difference between them is negligible compared to the uncertainties of the equations presented above, we used these equations for the photometric referencing of our observations without corrections for the extinction variations between the nights. The aperture corrections were done using a PSF constructed from 4 field stars. The measured pulsar magnitudes, and , correspond to the fluxes Jy and Jy, using the magnitude-flux conversion zero-points provided by Fukugita et al. (1995). The flux/magnitudes of the pulsar and o3 are shown in Table 3.
Pipeline-provided zeropoints and pivot wavelengths were used for the flux calibration of the HST observations ( erg cm-2 s-1 Å-1 / 7995 Å and erg cm-2 s-1 Å-1 / 6717 Å in the F814W and F675W bands, respectively). Aperture photometry was performed for the pulsar and the objects o2 and o3. Aperture corrections were derived from a nearby relatively bright star. The measured pulsar flux (see Table 3) in the F814W band is consistent with the published one (Mignani & Caraveo (2001)), while the flux in the F675W band is apparently 25% higher. Both fluxes are compatible with the less accurate VLT fluxes in the RI bands described above. We measured also the fluxes of the nearby objects o2 and o3 and estimated 3 upper limits of the object o1 in the HST bands.
In Table 3 we also present dereddened magnitudes and fluxes for the pulsar and o1 using (, ). This corresponds to the column density cm-2, derived from the combined PL NS-atmosphere spectral fit of the Vela pulsar X-ray data obtained with the Chandra observatory (Pavlov et al. 2001b ). The extinction value is consistent with the new distance to the Vela supernova remnant (SNR) of pc (Cha et al. (1999)), and with the highest value over the Vela SNR cm-2 () found for its southern part (Lu & Aschenbach (2000)).
The colors of the brightest stellar object in the pulsar vicinity, o3, suggest that it could be a main sequence K5-K7 star at a distance of kpc, assuming . This is a much higher extinction than we have adopted for the pulsar, but it is consistent with the maximum possible Galactic extinction in the Vela direction, ( cm-2; e.g., Schlegel et al. (1998)). The colors of the fainter object o2 are roughly consistent with a cooler and even more distant main sequence star (of spectral type M0) at kpc (). The object o1 is too red to be consistent with any ordinary Galactic star. It may be associated with the pulsar nebula. It may also be a background extragalactic object, as could also the objects o2 and o3. We discuss this further in Sect. 3.4.
3 Discussion
3.1 Multiwavelength spectrum of the Vela pulsar
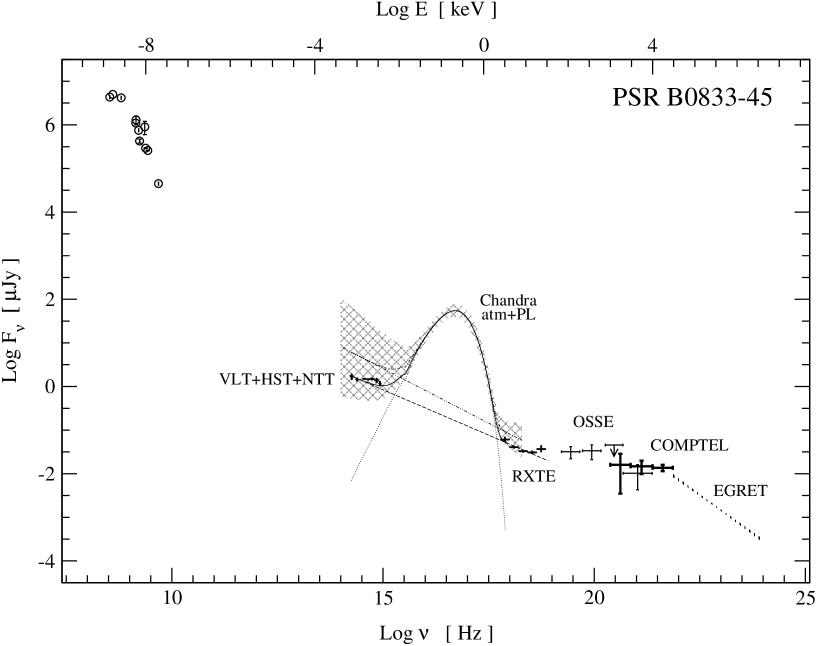
In Fig. 5 we have combined our IR data with the available phase-averaged multiwavelength fluxes of the Vela pulsar including the radio (EPN121212European Pulsar Network (EPN) archive available at http://www.mpifr-bonn.mpg.de/div/pulsar/data.; S. Johnston, 2002, private communications), the optical (Mignani & Caraveo (2001)), X-rays from the Chandra (Pavlov et al. 2001b ), hard X-rays from the RXTE (Harding et al. (2002)) and OSSE (Strickman et al. (1996)), and -rays from the COMPTEL (Schönfelder et al. (2000)) and the EGRET (Kanbach et al. (1994)). Here we present unabsorbed fluxes dereddened with the color excess applied to both the optical and X-ray regions. The VLT data in the RI bands are omitted since they are compatible with the more accurate HST fluxes in the respective F675W and F814W bands (cf. Table 3).
While the pulsar flux generally decreases with increasing frequency, one can resolve several nonthermal spectral components with different slopes in different spectral ranges. They are presumably of the pulsar magnetospheric origin. An excess in soft X-rays is attributed to the thermal emission from the surface of the NS (Ögelman et al. (1993); Pavlov et al. 2001b ).
3.2 Phase averaged spectra of the pulsar in the optical and X-rays
As was noted by Pavlov et al. (2001b), Mignani & Caraveo (2001), Harding et al. (2002), and seen from Fig. 5, the optical emission of the Vela pulsar is likely to be of nonthermal origin and the optical data are roughly compatible with the low energy extension of the X-ray PL spectral component dominating in the keV range. This may suggest a similar nature of the optical and the high energy X-ray emission. However, as seen from Fig. 5, because of the limited statistics of the available Chandra data in the keV range, the extension of the PL component inferred from the Chandra X-ray fit is much less certain than the near-IR and optical data.
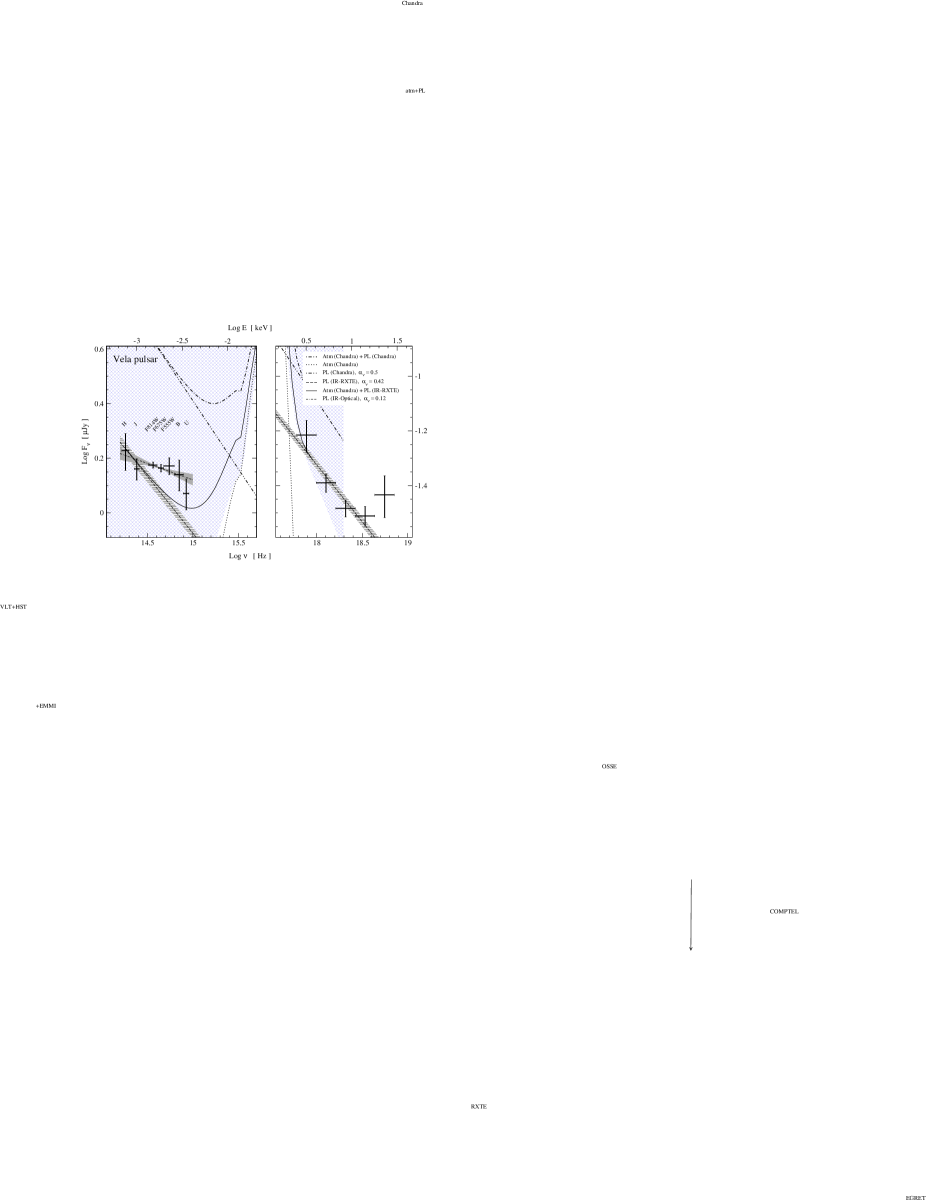
At the same time, the RXTE data, being compatible with the Chandra results, appear to be less uncertain. A difference in normalization of the PL components detected with Chandra and RXTE can be seen in Fig. 5. It may be due to the fact that only the pulsed component is detected by RXTE (Harding et al. (2002)). But the Chandra observations, representing the total flux from the pulsar including an “off-pulse” component, show that the pulsed fraction in the RXTE range can be as high as 80% (Sanwal et al. (2001)) and the contribution of the off-pulsed component may not strongly affect the spectral shape. Excluding the 5th most energetic RXTE band, which is likely related to a flatter spectral component dominating in the OSSE and COMPTEL ranges (see Fig. 5), the RXTE spectrum can be fitted with a PL with the spectral index . Although this fit is statistically inconsistent ( per dof), it reflects the spectral slope in the RXTE range: the best fit line lies within a narrow stripe-shaped region shown at the right panel of Fig. 6. Its extension to the optical range overlaps with the optical spectrum. A similar behavior was observed for the middle-aged pulsar PSR B065614 (Koptsevich et al. (2001)). But the slope of the optical broad-band spectrum as a whole appears to be significantly flatter, per dof, see the left panel of Fig. 6), and it is not possible to fit all optical and RXTE data with a single PL. We note also deviations from the single power law IR-Optical fit at about 1 level seen in the Js and U bands.
Such behavior of the phase-averaged optical spectrum suggests that it can be a combination of several spectral components dominating at different phases of the pulsar light curve, as it is seen in the RXTE range (Harding et al. (2002)). This can only be proven by deep time-resolved photometry. To our knowledge, no such data have been obtained yet for the Vela pulsar. The most recent “white-light” time-resolved photometry reveals three peaks in the pulsar light curve in the optical range (Gouiffes (1998)). In contrast to that, up to 5 peaks were registered in the RXTE bands, and their PL spectra have significantly different indices and intensities. The second RXTE peak consists of two components, soft and hard, and coincides with the second optical peak (Harding et al. (2002)). The second hard peak dominates the whole phase-averaged spectral flux, except for the 5th RXTE band, where the first peak with a positive spectral slope contributes significantly, providing a smooth connection to the spectral data in the OSSE range (cf. Fig. 5). The first RXTE peak coincides with the first -ray peak.
The measured fluxes in the Js and H bands may imply that the pulsar spectrum could be steeper in the IR than in the optical, as was also observed for the middle-aged pulsar PSR B065614 (Koptsevich et al. (2001)). Deeper observations of Vela in the H band are needed to state this possible similarity with greater confidence. What is more obvious is that the spectral slope in the near-IR is compatible with the RXTE slope. Combining the first four RXTE bands with the Js and H bands gives a consistent PL fit with ( per dof) shown by a dashed line in Figs. 5 and 6. The optical bands show a flux excess over this fit.
To better match the whole optical range we combined this nonthermal component with the thermal NS atmosphere component describing the soft X-ray part of the Chandra data (Pavlov et al. 2001b , combined HRCASIC fit). The combined model spectrum is shown by solid lines in Figs. 5 and 6. However, the atmosphere component decreases the residuals significantly only in the U and the softest RXTE bands, by contributions from the Rayleigh-Jeans and Wien tails of the thermal emission, respectively. The rest of the optical bands still show a significant excess over the combined atmosphere PL model. Based on that, we can speculate that the 2nd peak is responsible for the phase averaged emission in both the RXTE and near-IR ranges, while the excess in BVRI is mainly produced by another phase and/or spectral component.
Deeper Chandra observations of the Vela pulsar in the high energy tail of its X-ray emission are needed to perform more accurate phase averaged spectral analysis of the optical and X-ray data. The high spatial resolution of Chandra should avoid the possible uncertainty of the RXTE fluxes which do not properly account for the off-pulsed component of the pulsar emission. In this context, we can assume that the contribution of this component just increases the RXTE fluxes by a factor of (+0.2 in Log scale) in all bands to match the Chandra best PL fit line (double-dot-dashes in the right panel of Fig. 6). In this case, the low energy extension of the RXTE PL component would only overlap with the upper part of the B band error-bar, and would suggest a spectral break of the nonthermal component near the UB bands. On the other hand, if the current Chandra best PL fit is closer to reality, the break between the optical and X-ray slopes of the nonthermal component would be near 50 eV, i.e., in the EUV range. We consider these as alternative hypotheses to be tested by future observations.
3.3 Optical spectrum of the Vela pulsar and spectral evolution of the pulsar optical emission
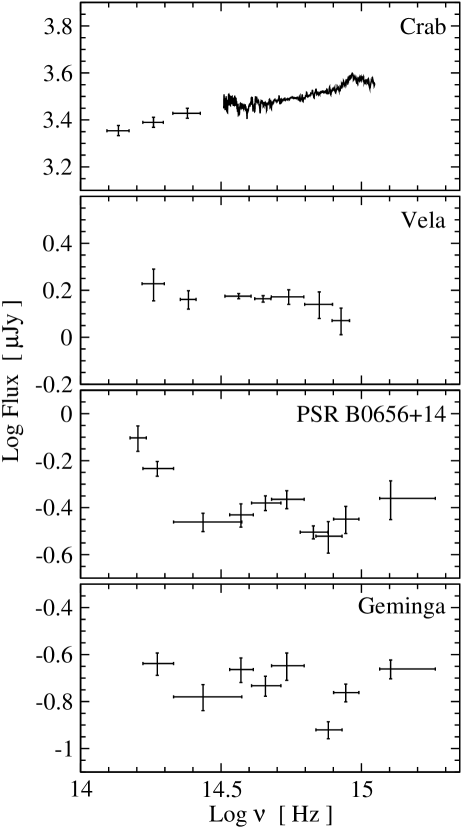
The near-IR data extend significantly the broad-band optical spectrum of the Vela pulsar towards longer wavelengths. This allows a detailed comparison with the properties of other pulsars observed in the near-IR. In Fig. 7 we compare the optical-IR part of the spectrum of the Vela pulsar with the available phase-averaged optical and near-IR spectra of other pulsars of different ages.
Our photometry of the Vela pulsar in the HST/F675W and VLT/R bands does not confirm a dip in this range (Mignani & Caraveo (2001)). Moreover, changing the extinction from (Manchester et al. (1978)) to the most recent value changes the average spectral index in the optical from (Mignani & Caraveo (2001)) to . This is different from the most recently estimated positive slope of the spectrum of the younger ( yr) Crab pulsar, which shows a monotonous flux increase from the IR to the FUV range (Sollerman et al. (2000); Sollerman (2003)).
Spectra of the middle-aged pulsars PSR B065614 and Geminga have dips near around UB bands, and the spectrum of PSR B065614 has a strong increase in the near-IR. We see signs of these features also in the Vela spectrum, although at a low significance level. The spectrum of PSR B065614 increases significantly towards the IR (Koptsevich et al. (2001)), contrary to the spectrum of the Crab pulsar.
3.4 Extended structures
Our IR observations allowed us to detect faint extended structures 15 SE and 1 NW of the pulsar. These are projected on the SE counter-jet and on the inner arc of the PWN detected in X-rays (Helfand et al. (2001); Pavlov et al. 2001a ). We also see a point-like object o1 12 NW of the pulsar, projected on the NW X-ray PWN jet. All these objects are red and have no reliable counterparts in the optical bands. It is difficult to conclude whether these features are associated with the PWN or they are background objects.
Observations of the much more energetic Crab PWN show that some of its structures are brighter in the IR than in the optical range. For instance, the knot structure, which is only 06 SE of the Crab pulsar, is more luminous in the IR and has a much steeper spectrum () than the Crab pulsar itself (Sollerman (2003)). This is consistent with the spatially averaged PL X-ray spectrum of the Crab PWN (Gotthelf & Olbert (2002)). Some of the Crab wisps are also better resolved in the IR. Based on that, and on the faintness of the Vela PWN as compared with the Crab one, it would not be too surprising if the Vela PWN could be detected more easily in the near-IR than in the optical.
In this context, the measured flux in the H band, and our 3 detection limits in the Js, HST/F814W and HST/F675W bands of the point-like object o1 resembling the Crab knot, suggest . Thus, its spectrum is much steeper than that of the Crab knot and also steeper than a spatially averaged X-ray spectrum of the Vela PWN with (Gotthelf & Olbert (2002)). We are not aware of any reasonable physical mechanism for such a strong change of the spectral index from X-rays to the optical range, and we therefore believe that o1 is likely to be a distant highly absorbed extragalactic object.
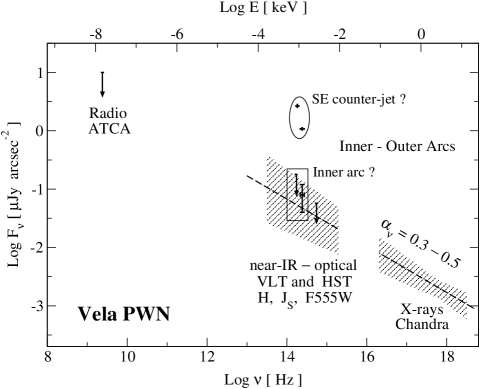
On the contrary, as seen from Fig. 8, the surface brightness in Js and its upper limit in H of the IR inner arc shown in Fig. 2 are compatible with the low energy extension of the time and spatially averaged X-ray spectrum of the Vela-PWN inner and outer arcs. The X-ray arc spectrum can be fitted with a PL with and unabsorbed energy integrated brightness ergs s-1 cm-2 arcsec-2 in the keV range (Kargaltsev et al. (2002); Mignani et al. (2003)). We consider this, and the positional coincidence of the inner IR and X-ray arcs as arguments in favor of the first detection of a counterpart of the Vela PWN in the near-IR range. The IR brightness of the structure is also consistent with the deepest optical upper limit of 0.057 Jy obtained recently in the HST/F555W band (Mignani et al. (2003)). If it is a real counterpart of the inner arc with the spectral slope described above, only slightly deeper observations, presumably at longer wavelengths, would allow a detection of this PWN structure.
The extended IR source closest to the pulsar, and apparently projected on the SE X-ray counter-jet, is an order of magnitude brighter than expected from an extrapolation of the X-ray spectrum into the near-IR/optical range (Fig. 8). Its IR spectrum is also much steeper, , than the spectrum of the PWN further away from the pulsar. As in the case of o1, this does not argue in favor of it being associated with the PWN. It could, however, be that the inner jet structure is brighter and has a steeper spectrum, because of possible instabilities of the relativistic particle flow from the pulsar as well as higher radiative losses at shorter distances from the pulsar. Although the upper limit on the optical flux from the IR source agrees with an extrapolation of the flux in the Js and H bands (see Fig. 8), we emphasize that the optical and near-IR images are from different epochs. As mentioned in Sect. 2.2, the emission of the regions close to the Crab pulsar varies on a short time scale, and future comparison between optical and near-IR emission in the vicinity of the Vela pulsar would benefit from simultaneous observations in these wavelength ranges.
In X-rays the Vela PWN shows high variability of its jet and arc-like structures in position, intensity, and hardness ratio (Pavlov et al. 2001a ). Thus, further deep observations of the pulsar field in the near-IR and in the optical would be useful to search for the variability and to prove or reject the association of the detected extended structures SE and NW of the pulsar and o1 with the PWN. Observations of the Vela pulsar in the KL bands would be valuable to investigate the possible increase of its flux towards the IR range. Finally, time resolved photometry and spectral information on the emission of different optical peaks of the pulsar pulse profile would be crucial to understand to which extent nonthermal optical radiation of the Vela pulsar is of the same origin as the nonthermal spectral component seen in the high energy tail of its X-ray spectrum, or whether it is generated by different radiation mechanisms.
4 Summary
Here we provide a summary of our most important results.
-
1.
We have, for the first time, detected the Vela pulsar in the near-IR in the Js and H bands.
-
2.
Our IR fluxes combined with the available broad-band optical data confirm the nonthermal origin of the pulsar emission in IR-optical range. The combined phase-averaged unabsorbed IR-optical spectrum is fitted with a single PL with a negative slope. This is in contrast to a positive slope of the unabsorbed spectrum of the younger Crab pulsar.
-
3.
The IR-optical spectrum and the phase-averaged PL spectral component detected in the high energy tail of the pulsar X-ray emission cannot be fitted with a single PL. This suggests either a spectral break in the NUV-EUV range, or the presence of an additional spectral component with a flatter spectrum dominating in the optical range. In the latter case, the IR and the X-ray spectrum can be fitted with a single PL suggesting the same origin of the nonthermal pulsar emission in the second pulse of the pulsar pulse profile in both the X-ray and IR ranges.
-
4.
We detected two faint objects in the 15 vicinity of the pulsar. They are projected on the SE counter-jet and the NW jet of the Vela PWN detected in X-rays. Both of them are extremely red and have no counterparts in the optical range. Their IR fluxes are apparently inconsistent with the expected IR brightness of the PWN obtained by extrapolation of its X-ray spectrum into the IR range. Finding variability of the objects would strongly support their association with the highly variable PWN.
-
5.
A thin extended structure aligned with the inner arc of the X-ray PWN is marginally seen in the Js band. Its brightness is consistent with the X-ray PWN spectrum. However, its reality and association with the PWN structure need to be confirmed at higher significance level by deeper observations.
Acknowledgements.
We are grateful to Soroush Nasoudi-Shoar for initial help with data reductions, to Simon Johnston for providing us with unpublished data on the radio spectrum of the Vela pulsar, to Alice Harding and Mark Strickman for tabulated results of the RXTE observations of the Vela pulsar, to Stefan Wagner for providing us with unpublished VLT data in the I band, to George Pavlov and Roberto Mignani for discussions and for access to the paper on the search for the optical counterpart of the Vela PWN prior to publication, and to the referee Stephen Eikenberry for comments which allowed us to clarify better several points in text. ABK and YAS are grateful to Stockholm Observatory and the Royal Swedish Academy of Sciences, and ABK to the University of Washington, for hospitality. This work has been partially supported by the RFBR grants 02-02-17668, 03-02-17423, and 03-07-90200, the Royal Swedish Academy of Sciences and the Swedish Research Council. PL is a Research Fellow at the Royal Swedish Academy of Sciences supported by a grant from the Wallenberg Foundation.References
- Caraveo et al. (2001) Caraveo, P. A., De Luca, A., Mignani, R. P., et al. 2001, ApJ, 561, 930
- Cha et al. (1999) Cha, A. N., Senbach, K. R., & Danks, A. C. 1999, ApJ, 499, L45
- Cheng et al. (1986) Cheng, K. S., Ho, C., & Ruderman, M. A. 1986, ApJ, 300, 500
- Daugherty & Harding (1996) Daugherty, J. K. & Harding, A. K. 1996, ApJ, 458, 278
- Fomalont et al. (1992) Fomalont, E. B., Goss, W. M., Lyne, A. G., et al. 1992, MNRAS, 258, 497
- Fukugita et al. (1995) Fukugita, M., Shimasaku, K., & Ichikawa, T. 1995, PASP, 107, 945
- Gotthelf & Olbert (2002) Gotthelf, E. V. & Olbert, C. M. 2002, in Proceedings of the 270. WE-Heraeus Seminar on Neutron Stars, Pulsars and Supernova Remnants, Physikzentrum Bad Honnef, Germany, Jan. 2002, eds. W. Becker, H. Lesch, & J. Trümper, MPE Report 278, 159 (astro-ph/02085169)
- Gouiffes (1998) Gouiffes, C. 1998, in Neutron Stars and Pulsars, eds. N. Shibazaki, N. Kawai, S. Shibata & T. Kifune (Univ. Acad. Press: Tokyo), 363
- Harding et al. (2002) Harding, A., Strickman, M. S., Gwinn, C., et al. 2002 ApJ, 576, 376
- Hawarden et al. (2000) Hawarden, T. G., Leggett, S. K., Letawsky, M. B., et al. 2000, MNRAS, 325, 563
- Helfand et al. (2001) Helfand, D. J., Gotthelf, E. V., & Halpern, J. P. 2001, ApJ, 556, 380
- Hester et al. (2002) Hester, J. J., Mori, K., Burrows, D., et al. 2002, ApJ, 557, L49
- Kanbach et al. (1994) Kanbach, G., Arzoumanian, Z., Bertsch, D., et al. 1994, A&A, 289, 855
- Kargaltsev et al. (2002) Kargaltsev, O., Pavlov, G. G., Sanwal, D. et al. 2002, in Neutron Stars in Supernova Remnants, ASP Conf. Ser., 271, eds. P. O. Slane & B. M. Gaensler (ASP: San Francisco), 181
- Komarova et al. (2002) Komarova, V. N., Shibanov, Yu. A., Zharikov, S. V., et al. 2002, in Proc. of the Workshop Pulsars, AXPs and SGRs observed with BeppoSAX and other observatories, in press
- Koptsevich et al. (2001) Koptsevich, A. B., Pavlov, G. G., Zharikov S. V., et al. 2001, A&A, 370, 304
- Labbè et al. (2003) Labbè, I., Franx, M., Rudnick, G., et al. 2003, AJ, 125, 1107
- Landolt (1992) Landolt, A. 1992, AJ, 104, 340
- Lasker (1976) Lasker, B. M. 1976, ApJ, 203, 193
- Legge (2000) Legge, D. 2000, in Pulsar Astronomy – 2000 and Beyond, eds. M. Kramer, N. Wex, & N. Welebinski, ASP Conference Series, 202, 141
- Lewis et al. (2002) Lewis, D., Dodson, R., McConnell, D., et al. 2002, in Neutron Stars and Supernova Remnants, ASP Conf. Ser., 271, eds. P. O. Slane & B. M. Gaensler (ASP: San Francisco), 191
- Lu & Aschenbach (2000) Lu, F. J. & Aschenbach, B. 2000, A&A, 362, 1083
- Manchester et al. (1978) Manchester, R. N., Lyne, A. G., Goss, W. M., et al. 1978, MNRAS, 184, 159
- Mignani & Caraveo (2001) Mignani, R. P. & Caraveo, P. A. 2001, A&A, 376, 213
- Mignani et al. (2000) Mignani, R. P., Caraveo, P. A., & Bignami, G. F. 2000, ESO Messenger, 99, 22
- Mignani et al. (2003) Mignani, R., De Luca, A., Kargaltsev, O., et al. 2003, A&A, submitted
- Ögelman et al. (1993) Ögelman, H., Finley, J. R., & Zimmerman, H. U. 1993, Nature, 361, 136
- (28) Pavlov, G. G., Karagaltsev, O. Y., Sanwal, D., et al. 2001a, ApJL, 554, L189
- (29) Pavlov, G. G, Zavlin, V. E., Sanwal, D., et al. 2001b, ApJL, 552, L129
- Romani (1996) Romani, R. W. 1996, ApJ, 470, 469
- Sanwal et al. (2001) Sanwal, D., Pavlov, G. G., Karagaltsev, O. Y., et al. 2001. in Neutron Stars in SNRs, ASP Conference Series, eds. P. O. Slane & B. M. Gaensler (astro-ph/0112164)
- Schlegel et al. (1998) Schlegel, D. J., Finkbeiner, D. P., Davis, M. 1998, ApJ, 500, 525
- Schönfelder et al. (2000) Schönfelder, V., Bennett, K., Blom, J. J., et al. 2000, A&AS, 143, 145
- Simons & Tokunaga (2002) Simons, D. A. & Tokunaga, A. 2002, PASP, 114, 169
- Sollerman (2003) Sollerman, J. 2003, A&A, submitted
- Sollerman & Flyckt (2002) Sollerman, J. & Flyckt, V. 2002, ESO Messenger, 107, 32
- Sollerman et al. (2000) Sollerman, J., Lundqvist, P. Lindler, D., et al. 2000, ApJ, 537, 861
- Strickman et al. (1996) Strickman, M. S., Grove, J. E., Johnson, W. N., et al. 1996, ApJ, 460, 735
- Taylor et al. (1993) Taylor, J. H., Manchester, R. N., & Lyne, A. G. 1993, ApJS, 88, 529
- van der Bliek et al. (1996) van der Bliek, N. S., Manfroid, J., & Bouchet, P. 1996, A&ASS, 119, 547
- Wagner & Seifert (2000) Wagner, S. J. & Seifert, W. 2000, in Pulsar Astronomy – 2000 and beyond, ASP Conference series, eds. M. Kramerr, N. Wex, & N. Welebinski, ASP Conference Series, 202, 315
- Wallace et al. (1977) Wallace, P. T., Peterson, B. A., Murdin, P. G., et al. 1977, Nature, 266, 692