11email: girardi,rigoni,mardiros,mezzetti@ts.astro.it
Morphology and luminosity segregation of galaxies in nearby loose groups
We study morphology and luminosity segregation of galaxies in loose groups. We analyze the two catalogs of groups which have been identified in the Nearby Optical Galaxy (NOG) sample, by means of hierarchical and percolation “friends-of-friends” methods (HG and PG catalogs, respectively). In the first part of our analysis we consider 387 and 436 groups of HG and PG, respectively, and compare morphology– (luminosity–) weighted to unweighted group properties: velocity dispersion, mean pairwise distance, and mean groupcentric distance of member galaxies. The second part of our analysis is based on two ensemble systems, one for each catalog, built by suitably combining together galaxies of all groups (1584 and 1882 galaxies for HG and PG groups, respectively). We find that earlier–type (brighter) galaxies are more clustered and lie closer to the group centers, both in position and in velocity, than later–type (fainter) galaxies. Spatial segregations are stronger than kinematical segregations. These effects are generally detected at the 3–sigma level. Luminosity segregation is shown to be independent of morphology segregation. Our main conclusions are strengthened by the detection of segregation in both hierarchical and percolation catalogs. Our results agree with a continuum of segregation properties of galaxies in systems, from low–mass groups to massive clusters.
Key Words.:
Galaxies: clusters: general – Galaxies: fundamental parameters – Galaxies: evolution – Cosmology: observations1 Introduction
Groups and clusters of galaxies are complex systems involving a variety of interacting components (galaxies, X–ray emitting gas, dark matter). Their investigation offers a rare opportunity to link many aspects of astrophysics and cosmology and, in particular, to clarify the interplay between dark and baryonic matter.
As for galaxies, different populations, i.e. families of galaxies with different morphology – color – spectral type – luminosity, show different distributions in projected position and LOS velocity. These phenomena, known as segregation effects, provide a way for exploring the connection between the distributions of dark matter and galaxies.
Segregation phenomena are well studied in galaxy clusters. Since the first studies (e.g., Oemler oem74 (1974); Moss & Dickens mos77 (1977); Dressler dre80 (1980), Dressler et al. dre97 (1997)), a long sequence of analyses has shown that galaxies of early morphological type (red color – low star formation rate) are more concentrated in regions of higher projected density and lie closer to the cluster center both in position and in velocity than galaxies of late morphological type (blue color – high star formation rate), cf. Biviano et al. (biv02 (2002)) and references therein. Evidence for luminosity segregation is also found, although only very luminous, possibly early–type galaxies, seem really to be segregated from the rest of the population (e.g., Biviano et al. biv92 (1992); Stein ste97 (1997); Biviano et al. biv02 (2002)).
Observational evidence that in galaxy surveys the clustering strength depends on morphology, luminosity, and colors (e.g., Benoist et al. ben96 (1996); Hermit et al. her96 (1996), Guzzo et al. guz97 (1997); Norberg et al. nor01 (2001)) suggests that segregation phenomena in galaxy systems might be connected with the large–scale–structure formation, perhaps in the context of biased galaxy formation or in the hierarchical growth of structure via gravitational instability.
Alternatively and/or additionally, some environmental effects could play an important rôle in segregation phenomena (e.g., White whi83 (1983); Richstone ric90 (1990); Moss mos01 (2001)). In fact, after a fast stage of violent relaxation, when the dynamics is controlled by a collective potential (Lynden-Bell lyn67 (1967)), galaxy systems should undergo a secondary relaxation phase, characterized by a longer time scale. In this second phase, several physical effects could modify member galaxies as regards their internal properties, as well as their distribution in space and in velocity. Some of these environmental effects, such as ram pressure stripping (Gunn & Gott gun72 (1972)) and galaxy harassment (Moore et al. moo96 (1996)), are less effective in group environments, where the X–ray temperature and global potential are smaller than in clusters. On the contrary, galaxy–galaxy interactions, such as close tidal encounters or mergers, and dynamical friction should be particularly significant in poor groups, where the velocity dispersion is lower than in clusters (e.g., Sarazin sar86 (1986); Richstone ric90 (1990); Makino & Hut mak97 (1997)).
In this context, differences in the segregation effects between groups and clusters would suggest that the system environment is fundamental in transforming galaxies at the present epoch. On the contrary, no difference might rather suggest that galaxy properties are influenced by initial conditions at the time of galaxy formation, maybe through the hierarchical growth of structures.
Unfortunately, observational difficulties prevented the researchers from giving a precise description of segregation effects in poor galaxy systems.
The only strongly supported effect in groups is the spatial segregation of galaxies of different morphological type (color – spectral type), which is the best known effect in clusters. Pioneering investigations were performed by Ozernoy & Reinhard (oze76 (1976)), Bhavsar (bha81 (1981)), and de Souza et al. (des82 (1982)). The first systematic results using groups with redshift information come from the study of Postman & Geller (pos84 (1984)). Through the analysis of groups in the CfA Redshift Survey and in the Catalog of Nearby Galaxies they showed that the relationship between galaxy morphology and local density, as found for rich clusters, extends down to groups. The presence of morphological segregation in groups of the CfA survey was also confirmed by Mezzetti et al. (mez85 (1985)) and Giuricin et al. (giu88 (1988)), who computed the mean groupcentric distance and the mean pairwise distance of the members in each individual group for different galaxy populations. Further segregation evidence comes from the analysis of the groups identified in the Southern Sky Redshift Survey (Maia & da Costa mai90 (1990)).
Recent works support the existence of morphology segregation phenomena, too. Mahdavi et al. (mah99 (1999)) analyzed 20 well sampled groups finding that galaxies of different spectral types are segregated in space. Tran et al. (tra01 (2001)) made a deep analysis of six X–ray detected groups finding that bulge–dominated galaxies decreases with increasing radius, similar to the morphology–radius relation observed in clusters. Carlberg et al. (2001b ) analyzed groups at intermediate redshift () identified within the CNOC2 (Canadian Network for Observational Cosmology’s field galaxy redshift survey) and found the presence of color gradients, i.e. the galaxies are redder toward the group center, in the most massive groups. Domínguez et al. (dom02 (2002)) analyzed the 2dF Group Catalog and found that the fraction related to low star–formation galaxies depends on the local density and the group–centric radius in the most massive ( 40) groups.
Kinematical segregation of galaxies of different morphological types is found in galaxy clusters (e.g., Stein ste97 (1997); Biviano et al. biv02 (2002)), but it is a smaller effect with respect to spatial segregation. In fact, the most different population seems to be the 10% of galaxies with strong emission lines – ELGs – which have considerably larger global velocity dispersion than other galaxy populations (de Theije & Katgert det99 (1999); Biviano et al. biv97 (1997)). The question is still open for groups: galaxies of different spectral types seem to differ in the value of of velocity anisotropy, but not in the value of the global velocity dispersion (Mahdavi et al. mah99 (1999)).
As for luminosity segregation in galaxy clusters, low levels of significance are found both in position and in velocity. In fact, this kind of segregation concerns only very few luminous galaxies or only early–type galaxies (e.g., Biviano et al. biv92 (1992); Stein ste97 (1997); Adami et al. ada98 (1998)) Biviano et al. biv02 (2002)). As for groups, the results are generally obtained by comparing luminosity–weighted and unweighted properties of galaxy groups. Ozernoy & Reinhard (oze76 (1976)) found that the effect of luminosity weighting is to increase the harmonic radius and to lower the velocity dispersion in comparison with the unweighted values. Further analyses of more recent group catalogs do not come on a common conclusion. Giuricin et al. (giu82 (1982)) claimed that the virial parameters are largely insensitive to weighting procedures, suggesting that group galaxies are in a status of velocity equipartition, while Mezzetti et al. (mez85 (1985)) found that virial radii are affected by weighting. Recent evidence for luminosity segregation in space and in velocity comes from the study of Magtesyan & Movsesyan (mag95 (1995), 303 groups), but with small significance ().
In this framework, we analyze the presence of segregation effects in galaxy groups identified in the Nearby Optical Galaxy Catalog (NOG, Giuricin et al. giu00 (2000), hereafter G00), which samples the local Universe. The advantage of using NOG groups is threefold: 1) the amount of morphological information available for nearby galaxies; 2) the presence of many low–mass local groups in this all–sky catalog; 3) the availability of two alternative catalogs of groups identified in the same galaxy catalog using two different algorithms. On the other side, these groups suffer from the problem plaguing traditional catalogs, i.e. the poor statistics available for each group. In view of this problem, we have devoted some effort to combining the data of many groups.
The paper is organized as follows. We describe the data sample and compute the main physical group quantities in Sect. 2. We devote Sect. 3 and Sect. 4 to the detection and analysis of the segregation effects. We discuss our results and draw our conclusions in Sect. 5.
Unless otherwise stated, we give errors at the 68% confidence level (hereafter c.l.).
A Hubble constant of 100 km s-1 Mpc-1 is used throughout.
2 Data sample and group properties
We analyze the galaxy loose–groups identified in the NOG catalog by G00. NOG is a complete apparent–magnitude catalog (corrected total blue magnitude ), with an upper distance limit (cz6000 km s-1), and collects optical galaxies, basically extracted from the Lyon–Meudon Extragalactic Database (LEDA; c.f. Paturel et al. pat97 (1997)). NOG covers about of the sky , and is quasi-complete in redshift (). Almost all NOG galaxies () have a morphological classification as taken from LEDA, and parameterized by (the morphological–type code system of RC3 catalog – de Vaucouleurs et al. dev91 (1991)) with one decimal figure.
G00 identified NOG groups by means of both the hierarchical and the percolation “friends–of–friends” methods. In particular, they employed two variants of the percolation method, which gave very similar catalogs of groups. Here we use the P2 catalog obtained with the variant where both the distance link parameter and the velocity link parameter scale with distance (Huchra & Geller huc82 (1982)), which is the most frequently used method of group identification in the literature. As for the hierarchical method, G00 basically followed the procedure adopted by Gourgoulhon et al. (gou92 (1992)).
The final hierarchical and percolation catalogs contain 475 and 513 groups with at least three members, respectively (hereafter HG and PG). The HG and PG catalogs turn out to be substantially consistent as far as the distribution of members in groups is concerned (see G00 for more details).
The availability of these two alternative samples of groups identified in the same galaxy catalog is of great advantage in our study. In fact, owing to the small number of galaxies for each group, one must rely on members as assigned by the group-selection algorithm, rather than using refined methods to reject interlopers as performed in clusters or very well sampled groups (e.g., 12 groups of Zabludoff & Mulchaey 1998a ; 20 groups of Mahdavi et al. mah99 (1999)). In particular, the resulting group properties may depend on the choice of the group-selection algorithm and its free parameters (e.g., Pisani et al. pis92 (1992); Frederic fre95 (1995); Ramella et al. ram97 (1997)). In fact, in the case of the NOG catalog, although the HG and PG groups have a large overlap in their members, the surviving difference in membership leads to differences in their main properties (cf. Table 1 and Fig. 1). In this context, our conclusions regarding segregation effects, where the main properties are used in an explicit way or in rescaling parameters (cf. Sects. 3 and 4, respectively), will be strengthened by their detection in both hierarchical and percolation catalogs.
| Sample | ||||||||
|---|---|---|---|---|---|---|---|---|
| km s | Mpc | |||||||
| HG | 387 | 2017 | 4 | 0.012 | 3.48 | |||
| HG5 | 148 | 1216 | 6 | 0.010 | 3.98 | |||
| PG | 436 | 2262 | 4 | 0.012 | 1.61 | |||
| PG5 | 168 | 1375 | 6 | 0.010 | 1.81 |
We remove from our analysis groups with km s-1 , because when the velocity becomes low its random component dominates and the velocity is no longer a reliable indication of the distance. In this way we reject most galaxies associated with the Virgo cluster too, i.e. the clumps A and B, the cloud W’ and the Southern Extension SE as identified by G00 in accordance with Binggeli et al. (bing87 (1987)) and Binggeli et al. (bin93 (1993)). Moreover, we remove the more distant parts of Virgo (M and W clouds), as well as all groups identified by G00 as known clusters (cf. their Tables 5 and 7). Obviously, we do not consider groups where the correction for observational velocity errors (cf. below) leads to a negative value of the velocity dispersion of member galaxies. Our final samples, HG and PG, contain 387 and 436 groups with at least three members for a total of 2017 and 2262 galaxies, respectively. Of the HG groups, 350 comprise members (in particular 155 have members), 31 groups comprise members, and 6 groups have members. Of the PG groups, 394 comprise members (in particular 185 have members), 36 groups comprise members, and 6 groups have members.
Out of the above groups, 148 and 168 groups have members for a total of 1216 and 1375 galaxies (HG5 and PG5, respectively). The physical reality of very poor groups has often been discussed in the literature. In particular, the efficiency of the percolation algorithm has been repeatedly checked, showing that an appreciable fraction of the poorer groups, those with members, might be false (i.e. represent unbound density fluctuations), whereas the richer groups almost always correspond to real systems (e.g., Ramella et al. ram89 (1989); Ramella et al. ram95 (1995); Mahdavi et al. mah97 (1997); Nolthenius et al. nol97 (1997); Diaferio et al. dia99 (1999)). Throughout the paper we apply our analysis to these statistically more reliable groups, too.
We take from G00 the data available for galaxy positions, redshifts (in the Local Group rest frame), corrected total blue magnitudes, and morphologies. For each group, we compute the main physical quantities.
We calculate the mean group velocity by using the biweight estimator (Beers et al. bee90 (1990)). We also compute the biweight group center by the mean of member positions, , i.e. we perform the biweight mean-estimator of member right-ascensions and declinations, separately. The group size is then given by , which is the (projected) distance of the most distant galaxy from the group center.
The main property of a galaxy system is the LOS velocity dispersion, . In fact, the virial radius , which defines the region where the matter overdensity is (for a CDM cosmology), scales with , and the mass in the virialized region () scales with (e.g., Carlberg et al. car97 (1997); Girardi et al. gir98 (1998); Antonuccio-Delogu et al. ant02 (2002)). We estimate by using the biweight estimator for groups with and the gapper estimator for groups with (Beers et al. bee90 (1990)). We apply the relativistic correction and the usual correction for velocity errors (Danese et al. dan80 (1980)). In particular, for each galaxy, we assume a typical velocity error of km s-1 based on the average errors estimated in the RC3 catalog from optical and radio spectroscopy (de Vaucouleurs et al. dev91 (1991)).
As for , we adopt the definition by Girardi et al. (gir98 (1998)), recovered by using the observational King-modified galaxy distribution of nearby clusters:
| (1) |
The use of an isothermal distribution leads to a similar value (cf. our with the definition by Carlberg et al. car97 (1997)).
Another important group quantity is the projected radius , which is twice the harmonic radius and is often used in the computation of the virial mass (e.g., Binney & Tremaine bin87 (1987); Girardi et al. gir98 (1998)):
| (2) |
where the factor is the deprojection factor adequate for spherical systems, and the mass is that contained within the sampled region, i.e. for . This approach to mass estimate is similar to that computed in other group catalogs (e.g., Ramella et al. ram02 (2002), and refs. therein), see also Girardi & Giuricin (gir00 (2000)) for related discussions.
The radius is defined as:
| (3) |
where are the projected mutual galaxy distances, and is the number of group members within the sampled region. The value of depends on the relative galaxy distribution, and the extension of the sampled region, i.e. the region occupied by the galaxies used in the computation.
Table 1 lists the median values (and confidence intervals) of the above group properties for the HG and PG catalogs. The confidence intervals are computed following the procedure111For the median of an ordered distribution of values the confidence intervals and , corresponding to a probability , can be obtained from . described by Kendall & Stuart (ken79 (1979), eq. 32.23) and first proposed by Thompson (tho36 (1936)). Values for groups with are shown, too.
Median values of are comparable to typical values quoted in the literature (cf. Table 4 of Tucker et al. tuc00 (2000), – note that their deprojected corresponds to ).
As for , the HG value is of the PG value (cf. also Pisani et al. pis92 (1992) for a similar result). Indeed, it has been suggested that the drawback of percolation methods is the inclusion in the catalogs of possible non–physical systems, like a long galaxy filament aligned close to the line of sight, which give large velocity-dispersion estimates, while the drawback of hierarchical methods is the splitting of galaxy clusters into various subunits, which give small velocity–dispersion estimates (e.g., Gourgoulhon et al. gou92 (1992)). The resulting difference in the distribution of velocity–dispersion estimates is outlined in Fig. 1. Our value of PG lies within the range of values reported by Tucker et al. (tuc00 (2000)), which are computed for percolation catalogs, and that of HG is comparable with results for the hierarchical catalog of Tully (tul87 (1987)).

Note that NOG groups are sampled well outside , in agreement with the conclusion of Girardi & Giuricin (gir00 (2000)) about groups by Garcia (gar93 (1993)). This characteristic is common in traditional catalogs of loose groups and in fact, Carlberg et al. (2001a ) introduced a variant of the friends–of–friends algorithm in such a way as to consider only central, possibly virialized regions of CNOC groups. In Sect. 4 we will consider only central group regions, too.
3 Detection of segregation
To detect possible segregation effects in velocity we compare several estimates of velocity dispersions (cf. also Biviano et al. biv92 (1992)). The unweighted velocity dispersion is defined as:
| (4) |
where is the velocity of the i-th galaxy corrected for cosmological effects, , and is the correction term which accounts for the measurement errors (see, e.g., Danese et al. dan80 (1980)).
To check for possible luminosity segregation, we use the luminosity-weighted velocity dispersion:
| (5) |
where is the apparent galaxy blue luminosity; the groupcentric-distance–weighted velocity dispersion:
| (6) |
where is the projected galaxy distance from its group–center; and the luminosity–groupcentric-distance–weighted velocity dispersion:
| (7) |
where the effects of luminosity– and groupcentric-distance–weighting are coupled.
Moreover, we introduce the morphology-weighted velocity dispersion, :
| (8) |
where is a weight related to the galaxy morphology: for early–type galaxies and for late–type galaxies, i.e. galaxies with and with . The choice of a factor of four of difference in the weights is suggested by the typical difference in ratios for early– and late–type galaxies (e.g., Bahcall et al. bah95 (1995)).
To detect possible spatial segregation effects, we consider the (projected) mean distance of members from the center of the group:
| (9) |
and the (projected) mean pairwise separation of the members:
| (10) |
and the respective weighted quantities:
| (11) |
| (12) |
| (13) |
| (14) |
We use the Sign and Wilcoxon Signed-ranks tests (hereafter referred to as S– and W–tests, e.g. Siegel sie56 (1956)) to compare weighed and unweighted estimates of each quantity we compute below. S– and W–tests are nonparametric tests which investigate the median difference between pairs of scores from two matched sample of a certain size. The W–test differs from the S–test in that the magnitude of score differences within pairs is taken into account, rather than simply the direction of such differences.
We find that each weighted quantity is smaller than the respective unweighted quantity. The S– and W–tests recover a strong significant difference with the exception of , for which only a partial significance is generally found (cf. Table 2). These results agree with the scenario where earlier–type (brighter) galaxies are more clustered and lie closer to the group center both in position and in velocity than later–type (fainter) galaxies. Moreover, galaxies which are close to the group center move slowly.
These results are confirmed when only statistically more reliable groups are considered ( members, HG5 and PG5 samples).
| HG: 387 systems | HG5: 148 systems | PG: 436 system | PG5: 168 systems | |||||
|---|---|---|---|---|---|---|---|---|
| X–Y | ||||||||
| – | 99.9 | 99.9 | 99.9 | 99.9 | 99.9 | 99.9 | 99.9 | 99.9 |
| – | 99.9 | 99.9 | 98.2 | 98.8 | 99.9 | 99.9 | 98.2 | 99.9 |
| – | 99.9 | 99.9 | 99.9 | 99.9 | 99.9 | 99.9 | 99.6 | 99.9 |
| – | 83.8 | 95.0 | 97.4 | 99.0 | 92.8 | 96.7 | 97.1 | 96.0 |
| – | 99.9 | 99.9 | 99.9 | 99.9 | 99.9 | 99.9 | 99.9 | 99.9 |
| – | 99.9 | 99,9 | 99.9 | 99.9 | 99.9 | 99.9 | 99.9 | 99.9 |
| – | 99.9 | 99.9 | 99.9 | 99.9 | 99.9 | 99.9 | 99.9 | 99.9 |
| – | 99.9 | 99.9 | 99.9 | 99.9 | 99.9 | 99.9 | 99.9 | 99.9 |
Table 2 lists each comparison between weighted and unweighted quantities and gives the percent significance of the difference according to the S– and W–test ( and , respectively).
From a quantitative point of view: the typical amount of the difference between weighted and unweighted quantities is small, at most (in the case of vs. ). Thus, any segregation effect has a little relevance in the computation of global group quantities. On the contrary, we stress that, as regards the connection between galaxy evolution and environment, the rôle of the above segregation effects is very important and could help to clarify many points. This explains the attempt of the next Section and previous analyses to stack together many groups.
4 Analysis of segregation
4.1 Ensemble groups
Here we analyze the behavior of relations between interesting galaxy properties. Unfortunately, owing to the small number of group members, we cannot address this question by analyzing each individual group. Therefore, we build two ensemble systems, one for each examined catalog, HG and PG, by combining together galaxies of all groups. The procedure of stacking groups of various sizes and masses into an ensemble system requires that individual galaxy quantities are properly scaled.
The magnitudes are normalized to the magnitude of the third-ranked galaxy, in each group by using (cf. also Biviano et al. biv92 (1992)). Here the median value of corresponds to a blue corrected absolute magnitude of log. We use this normalization to take into account possible biases introduced by the intrinsic nature of the NOG group catalog. In fact, members of more distant groups identified in an apparent magnitude galaxy survey are, on average, more intrinsically luminous.
The rest frame LOS velocities are normalized to the global value of velocity dispersion of each group. For each galaxy we consider the absolute quantity . Note that the standard estimate strongly correlates with the robust estimate (at the c.l.); thus the results are not affected by the particular choice of velocity–dispersion estimate.
In studies of galaxy clusters, projected groupcentric-distances are generally rescaled with , whose estimate is proportional to (cf. Sect. 2). However, the question is less obvious for galaxy groups.
Mahdavi et al. (mah99 (1999)) pointed out that, in the case of poor systems, the possible source of errors on the observationally estimated could be much larger than in the case of clusters. In fact, uncertainties typical of groups, such as their dynamical status and galaxy distribution, add to large uncertainties in the estimate of velocity dispersions, connected to the small number of group members.
Moreover, owing to their different nature, distance and velocity variables are treated in different ways in the group identification algorithms. Thus, if the use of to rescale velocities is fully self–consistent, the use of a quantity proportional to might be not the best choice for rescaling distances.
To further investigate the question, we consider three possible alternative factors for rescaling , i.e. using: 1) , 2) , and 3) no rescaling at all. We start from the theoretical prejudice that halo scale–invariance implies that the existence of very different kinds of galaxy distributions for low– and high– groups is an indication of a non–corrected scaling factor. Thus we consider the ensemble systems constructed from low– and high– groups (according to the median value of in Table 1) and we compare the two cumulative distributions of normalized groupcentric-distances through the Kolmogorov–Smirnov test (K–S test, e.g. Lederman led82 (1982)): they are always different, but the smallest amount of difference is found when using (according to the statistic D of the K–S test).
Thus, we choose to rescale groupcentric-distances with . However, we have verified that our main results are still valid in the case of the other two choices of normalization.
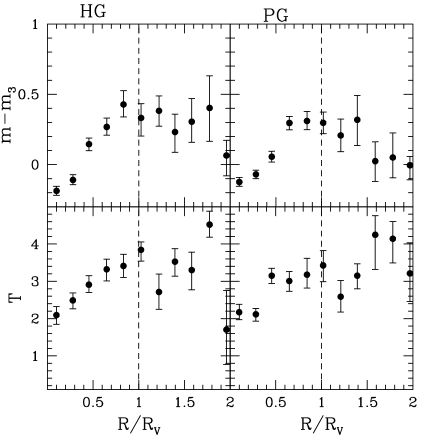
Fig. 2 shows the behavior of magnitude, and morphological–type vs. projected groupcentric distance. To be conservative, hereafter we consider only the group region within one , which contains enough galaxies to work with a large statistical data–base: – of the whole sample, i.e. 1584 and 1882 galaxies for the HG and PG catalogs, respectively. This radius corresponds to –3 for PG and HG respectively, and thus is not too much larger than the virialized region, i.e. where secondary relaxation–processes of some importance might operate.
4.2 Segregation effects
We consider the resulting relations for the two ensemble groups, HG and PG: the groupcentric-distance–magnitude relation (–); the groupcentric-distance–morphological type relation (–); the velocity–magnitude relation (–); and the velocity–morphological type relation (–). We analyze segregation effects in the framework of the Kendall rank correlation analysis, which is completely nonparametric (Kendall ken48 (1948); cf. also Siegel sie56 (1956)).
For each interesting relation vs. , we compute the Kendall coefficient, , and the respective significance of the correlation, .
When analyzing a correlation, there is always the possibility that this correlation is due to the association between each of the two physical properties and a third property connected to the selection effects of the catalog. Statistically, this problem may be attacked by methods of partial correlation. In partial correlation, the effects of variation by a third variable upon the relation between the and variables are eliminated. In practice, the correlation between the two interesting properties is found with the third variable kept constant. Thus we also compute the Kendall partial correlation coefficient, , which is a measure of the correlation between two data sets, and , independently of their correlation with a third data set, (Kendall ken48 (1948); cf. eq. 9.13 of Siegel sie56 (1956)):
| (15) |
where, as for the third variable, we consider both the group distance (), and the number of group–members (richness ). In fact, the distance is connected with the selection function of the group catalog, which is based on an apparent magnitude complete galaxy sample. Moreover, in such very poor systems () the normalized magnitude strongly correlates with , which in its turn is slightly correlated with both size and velocity dispersion (cf. Table 1).
| Sample | vs. | , | , | , | |
|---|---|---|---|---|---|
| HG Groups | – | 1584 | 0.19, 99.9 | 0.19, 99.9 | 0.13, 99.9 |
| – | 1558 | 0.07, 99.9 | 0.07, 99.9 | 0.09, 99.9 | |
| – | 1584 | 0.06, 99.9 | 0.05, 99.9 | 0.04, | |
| – | 1558 | 0.02, | 0.02, | 0.02, | |
| PG Groups | – | 1882 | 0.16, 99.9 | 0.16, 99.9 | 0.09, 99.9 |
| – | 1856 | 0.06, 99.9 | 0.06, 99.9 | 0.06, 99.9 | |
| – | 1882 | 0.06, 99.9 | 0.06, 99.9 | 0.03, | |
| – | 1856 | , | , | 0.00, |
For both the HG and PG catalogs, Table 3 shows the results for the ensemble groups constructed as described in Sect. 4.1. For each interesting relation vs. , we give the Kendall coefficient, , and the Kendall partial correlation coefficient, which takes into account the effect of the third variable, and . We also list the respective significance of the correlations, . The value of is recovered form the fact that the sampling distribution of is practically indistinguishable from the normal distribution (Kendall ken48 (1948); cf. eq. 9.11 of Siegel sie56 (1956)). Since the sampling distribution of is unknown, to compute and we adopt the bootstrap method performing 1000 bootstrap resamplings for each correlation.
The Kendall coefficients of the – and – correlations show no decrease when the or variables are taken into account (). Therefore the – and – relations are not biased by systematic effects.
As for the – and – relations, we find that , while is systematically smaller than although still giving significant correlation. Thus, we conclude that the – and – correlations are due to a combination of a true physical effect and a spurious one. The spurious one is due to our stacking of groups with different richness.
To support the above analysis, we also make Monte Carlo simulations performing a random shuffle of galaxy velocities, magnitudes, and morphological types within each individual group. This procedure, which leaves unchanged global group properties and modifies the group internal structure, should destroy any physical segregation effects and reveal the presence of spurious correlations. We construct the “simulated” ensemble–group by combining together the galaxies of groups resulting from Monte Carlo simulations. In particular, we perform 15 Monte Carlo simulations for each group in order to consider a large () number of galaxies and thus stabilize the resulting Kendall coefficient, . No significant correlation is found for – and – relations. When considering – and –, the simulated group shows a significant correlation, characterized by a smaller than the coefficient of the original data . Moreover, when using only groups with a fixed number of members 3, 4, 5, and 6 (groups with are statically poorly represented) the corresponding Monte Carlo simulated groups show no correlation at all. Thus, in agreement with Kendall partial correlation analysis, we conclude that – and – correlations are partially spurious due to our stacking of groups with different richness.
Hereafter, to take into accounts the richness effect, we consider as really physical meaningful the coefficient.
Having addressed the problem of possible biases, we can give our results about segregation effects, which are similar for both the HG and PG catalogs. Spatial correlations, in luminosity or morphology (–, –), are the strongest one (-). Luminosity segregation in velocity (–) is characterized by a small correlation coefficient (-), still significant. Morphological segregation in velocity (–) is not significant, in agreement with the fact that this is the faintest segregation detected in Sect. 3.


The interesting relations are better visualized in Figs. 3 and 4 for both all and rich groups. There, to take into account the spurious component in the – and – relations, we show our results rescaled to those of the corresponding simulated group, i.e. we normalize the (y-axis) values obtained for the real ensemble-group to the values obtained for the corresponding simulated-group with the same binning procedure. For the sake of homogeneity, we apply the same procedure to – and – relations.
4.3 Segregation and group richness
We analyze separately groups with and those with members. Tables 4 and 5 show the results of the correlation analysis.
| Sample | vs. | , | |
|---|---|---|---|
| HG | – | 577 | 0.10, 99.9 |
| – | 565 | 0.07, | |
| – | 577 | 0.00, | |
| – | 565 | , | |
| PG | – | 705 | 0.06, |
| – | 693 | 0.04, | |
| – | 705 | 0.02, | |
| – | 693 | 0.01, |
| Sample | vs. | , | , | , | |
|---|---|---|---|---|---|
| HG | – | 1007 | 0.13, 99.9 | 0.12, 99.9 | |
| – | 993 | 0.10, 99.9 | 0.09, 99.9 | ||
| – | 1007 | 0.06, | 0.05, | ||
| – | 993 | 0.05, | 0.05, | ||
| PG | – | 1177 | 0.09, 99.9 | 0.08, 99.9 | |
| – | 1163 | 0.10, 99.9 | 0.09, 99.9 | ||
| – | 1177 | 0.03, | 0.03, | ||
| – | 1163 | 0.00, | , |
The analysis of rich groups confirms the correlations found for the whole sample. In particular, the - correlation is now significant in the case of the HG catalog.

As for poor groups, they show fainter spatial segregation effects than rich groups and no kinematical segregation effects at all (cf. also Fig. 5). This result could be due 1) to the dilution effect of a significant number of spurious groups or 2) to some physical difference between poor and rich groups. The most relevant difference is probably the , which is, on average, smaller in poor than in rich groups (cf. Table 1). However, segregation effects are poorly or not dependent on (cf. Sect. 4.5); thus we are inclined to believe in the first hypothesis.
Hereafter, we consider only more reliable, rich groups.
4.4 Luminosity vs. morphology effects
It is well known that galaxies of different morphological types have different luminosity functions (e.g., Sandage et al. san85 (1985); Marzke et al. mar98 (1998)). In particular, very late–type galaxies strongly differ from other types having typically fainter magnitudes (e.g., Sandage et al. san85 (1985); Sandage san00 (2000)). In our case, morphological type and normalized magnitude correlate at the and c.l. for HG and PG, respectively.
The problem of the independence of morphology and luminosity segregations can be addressed by methods of partial correlation (cf. Sect. 4.2). Thus, for the four relations considered in Table 5 we estimate the Kendall partial rank correlation coefficient considering the effect of luminosity (morphology) in the relations involving morphology (luminosity). Table 5 lists the values of and , and the respective c.l.: they are similar to or just slightly smaller than the values of corresponding . We conclude that morphology and luminosity segregations are two independent effects.
Moreover, we consider early– and late–type galaxies separately (cf. Table 6). The - correlation is significant for both early– and late–type samples. The same is true for the - correlation in the HG case, but not in the PG case, where only the early–type sample shows a significant - correlation.
| vs. | , | , | ||
|---|---|---|---|---|
| HG Early–Types | HG Late-Types | |||
| – | 267 | 0.10, | 726 | 0.13, 99.9 |
| – | 267 | 0.07, | 726 | 0.05, |
| PG Early–Types | PG Late-Types | |||
| – | 344 | 0.08, | 819 | 0.08, 99.9 |
| – | 344 | 0.10, | 819 | , |
4.5 Segregation and velocity dispersion
The price to be paid for the large gain in statistics when using the above ensemble groups is that we average away possible distinctive behaviors. In particular, in the NOG sample, the value of velocity dispersion ranges from very low– systems up to systems with – km s-1 (cf. Fig. 1).
We consider the four quartiles of the distribution of –values, i.e. each with and groups for HG5 and PG5, respectively. The related ensemble systems contain 184–341 galaxies for HG5 and 223–371 galaxies for PG5. Fig. 6 shows the resulting Kendall coefficient for these ensemble systems. No systematic, general evidence of a connection between segregation properties and velocity dispersion is shown.

5 Summary & Discussion
We analyze 2x400 loose groups identified in the NOG catalog by using hierarchical and “friends–of–friends” percolation catalogs by G00.
Analyzing both catalogs we find similar results: earlier–type (brighter) galaxies are more clustered and lie closer to the group centers, both in position and in velocity, than later–type (fainter) galaxies. Spatial segregations are stronger than kinematical segregations. These effects are generally detected at the 3–sigma level, with the exception of morphological segregation in velocity (cf. Sects. 3 and 4.2). The significance of the last effect is generally lower than in the comparison between weighted and unweighted properties (cf. Sect. 3), and it is confirmed only for the HG rich ensemble–group (cf. Sect. 4.3).
Our main results are confirmed by the analysis of statistically more reliable rich groups (with at least five members, cf. Sect. 4.3). Results for poorer groups are possibly diluted by spurious systems.
The evidence of spatial morphology–segregation confirms previous results recovered by using directly morphology data or morphological indicators such as spectral types and colors (e.g., Postman & Geller pos84 (1984); Mahdavi et al. mah99 (1999); Tran et al. tra01 (2001); Carlberg et al. 2001b ; Domínguez et al. dom02 (2002)). The other kinds of segregation we detect are still poorly analyzed or debated questions for groups, but are studied in the context of galaxy clusters.
Recent observational efforts to increase the number of members of a few loose groups suggest that they are quasi–virialized system, at least in their central regions, and show a continuum of properties with respect to clusters, e.g., regarding the density profile of galaxy distribution, the behavior of velocity dispersion profiles, and the presence of substructures (Mahdavi et al. mah99 (1999); Zabludoff & Mulchaey 1998a , 1998b ). In this context, it is worth to attempt a more detailed comparison between our results for groups and those obtained for clusters.
In Fig. 7 we plot the relative fraction of ellipticals (), lenticulars (), and spirals+irregulars () for ensemble systems constructed from rich groups (). The qualitative behavior resembles that already found for clusters (e.g. Whitmore et al. whi93 (1993)): the fractions of ellipticals and lenticulars decline with radius and the fraction of late–type galaxies increases. For the sake of completeness we also plot cluster data by Whitmore et al. which correspond to (i.e. and for PG and HG, respectively, cf. Sect. 4.1). Due to the different depth of the catalogs, the possible inconsistencies in the morphological classification criteria, and the degree of uncertainty in the normalization radius we do not attempt a more quantitative comparison.

In agreement with cluster studies (e.g., Biviano et al. biv02 (2002)), we find significant evidence of both spatial and kinematical segregation of galaxies of different luminosity, and luminosity segregation seems to be related only to the most luminous galaxies. Fig. 8 directly compares the - relation for NOG groups to that for clusters by Biviano et al. (biv92 (1992)) who found that the – relation first rapidly increases and then flattens out at faint magnitudes. According to Biviano et al., this trend can be explained if galaxies brighter than have achieved the energy–equipartition status, maybe due to dynamical friction or galaxy merging, while fainter galaxies still lie in the velocity–equipartition status generated by violent relaxation. NOG groups show a less sharp increase in the region of bright galaxies with respect to clusters. A somewhat better agreement is obtained when considering only early–type galaxies, which might better represent the typical morphological content of those clusters. Another explanation is that the removing of late–type galaxies reduces the number of possible non–member galaxies highlighting better the true physical relation. Deeper samples for groups would be needed to verify the flatness of the relation at faint magnitudes.

In NOG groups we find that luminosity segregation is found independent of morphological segregation in agreement with the results from clusters (e.g., Adami et al. ada98 (1998); Biviano et al. biv02 (2002)). In clusters luminosity segregation is evident only for ellipticals and possibly lenticulars (e.g., Stein ste97 (1997); Biviano et al. biv02 (2002)). In groups we do not reach a definitive conclusion since we find that spatial luminosity segregation concerns both early– and late–type galaxies, while kinematical luminosity segregation seems confined to early–type galaxies (in the case of PG groups, cf. Sect. 4.4).
Recent results suggest that morphological segregation in space characterizes only massive groups, above some threshold value. In fact, Carlberg et al. (2001b ) found the presence of a color gradient only in groups with km s-1 , and Domínguez et al. (dom02 (2002)) detected spectral–type segregation only in groups with mass . Additional support to this idea is given by our analysis in Sect. 4.5, where the - relation is strengthened with increasing velocity dispersion (cf. pentagons in Fig. 6). However, no systematic, general evidence of a connection between segregation properties and velocity dispersion is shown and the question merits further investigations.
To sum up, as regards coarse aspects of morphology and luminosity segregation, our results are consistent with a continuum of properties of galaxies in systems, from low–mass groups to massive clusters. This result is in agreement with the early study by Postman & Geller (pos84 (1984)) on morphological segregation and, e.g., more recent results by Lewis et al. (lew02 (2001)) who found that environmental influences on galaxy star formation are not restricted to cluster cores, but are effective in groups, too.
Our results suggest that the segregation effects we analyze are mainly connected with the initial conditions at the time of galaxy formation. Alternatively, the mechanisms which influence galaxy luminosity and morphology should act in a similar way in groups and in clusters, or, at least, in the subunits forming clusters in the context of the hierarchical scenario.
In this framework, it is also worth discussing our results in connection to those coming from large–scale analyses, since a large fraction of galaxies is located in groups (, cf. Ramella et al. ram02 (2002)). Spatial segregation phenomena are generally studied through the galaxy–galaxy correlation function analysis. This kind of analysis is fully independent and complementary to our work, which concerns very small scales. As for NOG catalog, Giuricin et al. (giu01 (2001)) analyzed the redshift–space two–point correlation function of galaxies, finding that – on scales between and 10–20 Mpc – the strength of clustering is stronger for earlier and, independently, for more luminous galaxies, in agreement with most recent literature (cf. Giuricin et al. and refs. therein). The projected correlation function overcomes the problem of distortions of the clustering pattern induced by peculiar motions and allows to perform analysis down to smaller scales ( Mpc ). In particular, very recent studies of the 2dF Galaxy Redshift Survey show that the strength of the clustering of luminous galaxies increases with the galaxy luminosity and that luminosity and spectral–type segregations are independent effects (Norberg et al. nor01 (2001); nor02 (2002)). Thus, segregation phenomena, qualitatively in agreement with those detected in our study, are present out to very large scales. This could be another piece of evidence in favor of a mostly primordial origin for spatial segregation effects.
Acknowledgements.
We thank Andrea Biviano, Manuela Magliocchetti, Christian Marinoni, and Massimo Ramella for useful suggestions and discussions. We also thank an anonymous referee for a careful reading of the manuscript and suggestions which improved the paper. Work partially supported by the Italian Ministry of Education, University, and Research (MIUR, grant COFIN2001028932 ”Clusters and groups of galaxies, the interplay of dark and baryonic matter”), and by the Italian Space Agency (ASI).References
- (1) Adami, C., Biviano, A., & Mazure, A. 1998, A&A, 331, 439
- (2) Antonuccio-Delogu, V., Becciani, U., van Kampen, E., et al. 2002, MNRAS, 332, 7
- (3) Bahcall, N. A., Lubin, L. M., & Dorman, V. 1995, ApJ, 447, L81
- (4) Beers, T. C., Flynn, K., & Gebhardt, K. 1990, AJ, 100, 32
- (5) Benoist C., Maurogordato S., da Costa L. N., Cappi A., Schaffer R., 1996, ApJ, 472, 452
- (6) Bhavsar, S. P. 1981, ApJ, 246, L5
- (7) Binggeli, B., Popescu, C. C., & Tammann, G. A. 1993, A&AS, 98, 275
- (8) Binggeli, B., Tammann, G. A., & Sandage, A. 1987, AJ, 94, 251
- (9) Binney, J., & Tremaine, S. 1987, Galactic Dynamics (Princeton Univ. Press)
- (10) Biviano, A., Katgert, P., Mazure, et al. 1997, A&A, 321, 84
- (11) Biviano, A., Katgert, P., Thomas, T., & Adami, C. 2002, A&A, 387, 8
- (12) Biviano, A., Girardi, M., Giuricin, G., Mardirossian, F., & Mezzetti, M. 1992, ApJ, 396, 35
- (13) Carlberg, R. G., Yee, H. K. C., & Ellingson, E., et al. 1997, ApJ, 478, 462
- (14) Carlberg, R. G., Yee, H. K. C., Morris, S. L., et al. 2001a, ApJ, 552, 427
- (15) Carlberg, R. G., Yee, H. K. C., Morris, S. L., et al. 2001b, ApJ, 563, 736
- (16) Danese, L., de Zotti, G., & di Tullio, G. 1980, A&A, 82, 322
- (17) de Souza, R. E., Capelato, H. V., Arakaki, L., & Logullo, C. 1982, ApJ, 263, 557
- (18) de Theije, P. A. M. & Katgert, P. 1999, A&A, 341, 371
- (19) de Vaucouleurs, G., de Vaucouleurs, A., Corwin, et al. 1991, Third Reference Catalogue of Bright Galaxies (Berlin Heidelberg New York: Springer-Verlag) (RC3)
- (20) Diaferio, A., Kauffmann, G., Colberg, J. M., & White, S. D. M. 1999, MNRAS, 307, 537
- (21) Domínguez, M., Zandivarez, A. A., Martínez, H. J., et al. 2002, MNRAS, 335, 825
- (22) Dressler, A. 1980, ApJ, 236, 351
- (23) Dressler, A., Oemler, A. Jr., Couch, W. J., et al. 1997, ApJ, 490, 577
- (24) Frederic, J. J. 1995, ApJS, 97, 275
- (25) Garcia, A. M. 1993, A&AS, 100, 47
- (26) Girardi, M., & Giuricin 2000, ApJ, 540, 45
- (27) Girardi, M., Giuricin, G., Mardirossian, F., Mezzetti, M., & Boschin W. 1998, ApJ, 505, 74
- (28) Giuricin, G., P., Mardirossian, & F., Mezzetti, M. 1982, ApJ, 255, 361
- (29) Giuricin, G., Mardirossian, F., Mezzetti, M., Pisani, A., & Ramella, M. 1988, A&A, 192, 95
- (30) Giuricin, G., Marinoni, C., Ceriani, L., & Pisani, A. 2000, ApJ, 543, 178 (G00)
- (31) Giuricin, G., Samurović, S., Girardi, M., Mezzetti, M., & Marinoni, C. 2001, ApJ, 554, 857
- (32) Gourgoulhon, E. , Chamaraux, P., & Fouqué, P. 1992, A&A, 255, 69
- (33) Gunn, J. E. & Gott, J. R. I. 1972, ApJ, 176, 1
- (34) Guzzo, L., Strauss, M. A., Fisher, K. B., Giovanelli, R., & Haynes, M. P. 1997, ApJ, 489, 37
- (35) Hermit S., Santiago B. X., Lahav O., et al., 1996, MNRAS283, 709
- (36) Huchra, J. P., & Geller, M. J. 1982, ApJ, 257, 423
- (37) Kendall, M. 1948, Rank Correlation Methods (London: Griffin)
- (38) Kendall, M, & Stuart, A. 1979, in Advanced Theory of Statistics, ed. Buther & Tonner Ltd (p. 546-547)
- (39) Ledermann, W. 1982, Handbook of Applicable Mathematics (New York: Wiley), Vol.6.
- (40) Lewis, I., et al. 2002, MNRAS, 334, 673
- (41) Lynden-Bell, D. 1967, MNRAS, 136, 101
- (42) Magtesyan, A. P. & Movsesyan, V. G. 1995, Astronomy Letters, Vol. 21, No. 4, p. 429
- (43) Mahdavi, A., Böhringer, H., Geller, M. J., & Ramella, M. 1997, ApJ, 483, 68
- (44) Mahdavi, A., Geller, M. J., Böhringer, H., Kurtz, M. J., & Ramella, M. 1999, ApJ, 518, 69
- (45) Makino, J. & Hut, P. 1997, ApJ, 481, 83
- (46) Maia, M. A. G., & da Costa, L. N. 1990, ApJ, 352, 457
- (47) Marzke, R. O., da Costa, L. N., Pellegrini, P. S., Willmer, C. N. A., & Geller, M. J. 1998, ApJ, 503, 617
- (48) Mezzetti, M., Pisani, A., Giuricin, G., & Mardirossian, F. 1985, A&A, 143, 188
- (49) Moore, B., Katz, N., Lake, G., Dressler, A., & Oemler, A. 1996, Nature, 379, 613
- (50) Moss, C. 2001, in Galaxy Disks and Disk Galaxies, ASP Conference Series, Vol. 230. Edited by Jos G. Funes, S. J. and Enrico Maria Corsini. (San Francisco: Astronomical Society of the Pacific), p. 487
- (51) Moss, C. & Dickens, R. J. 1977, MNRAS, 178, 701
- (52) Nolthenius, R., Klypin, A., & Primack, J. R. 1997, ApJ, 480, 43
- (53) Norberg, P., Baugh, C. M., & Hawkins, Ed et al. 2001. MNRAS, 328, 64
- (54) Norberg, P., Baugh, C. M., & Hawkins, Ed et al. 2002. MNRAS, 332, 827
- (55) Oemler, A. J. 1974, ApJ, 194, 1
- (56) Ozernoy, L. M. & Reinhardt, M. 1976, A&A, 52, 31
- (57) Paturel, G., Andernach, H., Bottinelli, L., et al. 1997, A&AS, 124, 109
- (58) Pisani, A., Giuricin, G., Mardirossian, F., & Mezzetti, M. 1992, ApJ, 389, 68
- (59) Postman, M. & Geller, M. J. 1984, ApJ, 281, 95
- (60) Ramella, M., Geller, M. J., & Huchra, J. P. 1989, ApJ, 344, 57
- (61) Ramella, M., Geller, M. J., Huchra, J. P., & Thorstensen, J. R. 1995, AJ, 109, 1469
- (62) Ramella, M., Geller, M. J., Pisani, A. & da Costa, L. N. 2002, AJ, 123, 2976
- (63) Ramella, M., Pisani, A., & Geller, M. J. 1997, AJ, 113, 483
- (64) Richstone, D. 1990, in Cluster of Galaxies, ed. W. R. Oegerle, M. J. Fitchett, & L. Danly (Cambridge: Cambridge University Press), 231
- (65) Sandage, A., 2000, PASP112, 504
- (66) Sandage, A., Binggeli, B., & Tammann, G. A. 1985, AJ90, 1759
- (67) Sarazin, C. L. 1986, Reviews of Modern Physics, 58, 1
- (68) Siegel S. in Non-paramteric Statistics for the Behavioral Sciences, 1956, ed. McGraw-Hill
- (69) Stein, P. 1997, A&A, 317, 670
- (70) Thompson, W. R. 1936, Ann. Math. Statist., 7, 122
- (71) Tran, K. H., Simard, L., Zabludoff, A. I., & Mulchaey, J. S. 2001, ApJ, 549, 172
- (72) Tully, R. B. 1987, ApJ, 321, 280
- (73) Tucker, D. L., Oemler, A. Jr., Hashimoto, Y., et a. 2000 ApJS, 130, 237
- (74) White, S. D. M. 1983, Nature, 302, 756
- (75) Whitmore, B. C., Gilmore, D. M., & Jones, C. 1993, ApJ, 407, 489
- (76) Zabludoff, A. I. & Mulchaey, J. S. 1998a, ApJ, 496, 39
- (77) Zabludoff, A. I. & Mulchaey, J. S. 1998b, ApJ, 498, L5