A search for 85.5- and 86.6-GHz methanol maser emission
Abstract
We have used the Australia Telescope National Facility Mopra 22m millimetre telescope to search for emission from the (85.5-GHz) and (86.6-GHz) transitions of methanol. The search was targeted towards 22 star formation regions which exhibit maser emission in the 107.0-GHz methanol transition, as well as in the 6.6-GHz transition characteristic of class II methanol maser sources. A total of 22 regions were searched at 85.5 GHz resulting in 5 detections, of which 1 appears to be a newly discovered maser. For the 86.6-GHz transition observations were made of 18 regions which yielded 2 detections, but no new maser sources. This search demonstrates that emission from the and transitions is rare. Detection of maser emission from either of these transitions therefore indicates the presence of special conditions, different from those in the majority of methanol maser sources. We have observed temporal variability in the 86.6-GHz emission towards 345.010+1.792, which along with the very narrow line width, confirms that the emission is a maser in this source.
We have combined our current observations with published data for the 6.6-, 12.1-, 85.5-, 86.6-, 107.0-, 108.8- and 156.6-GHz transitions for comparison with the maser model of Sobolev & Deguchi (1994). Both detections and nondetections are useful for setting limits on the physical conditions in star forming regions which contain methanol maser emission. This has allowed us to estimate the likely ranges of dust temperature, gas density, and methanol column density, both for typical methanol maser sources and for those sources which also show 107.0-GHz emission. The gas temperature can also be estimated for those sources exhibiting masers at 85.5 and/or 86.6 GHz.
keywords:
masers – stars:formation – ISM: molecules – radio lines : ISM1 Introduction
More than 30 different transitions of methanol have been observed to exhibit interstellar maser emission. The maser transitions are empirically classified into two groups (named class I and class II) on the basis of their association with high-mass star formation regions [1991a]. Class II transitions are closely associated with signposts of high-mass star formation such as ultra-compact Hii regions, OH masers and strong far infra-red emission. Class I masers occur offset from star formation regions and are believed to be collisionally pumped at the interface between outflows and the parent molecular cloud [1991a].
In contrast to OH and masers, class II methanol maser emission is only found associated with high-mass star formation, making it a useful signpost of such regions. In particular the 6.6-GHz transition has been detected towards more than 550 sites throughout our Galaxy [1991b, 1992, 1995a, 1996, 1997, 1999, 2002]. More than 120 of the regions which exhibit 6.6-GHz maser emission also exhibit maser emission in the 12.1-GHz transition [1995b]. Approximately 175 known 6.6-GHz maser sources have been searched in the transition at 107.0 GHz, with maser emission detected towards 25 regions [1995, 1999, 2000, 2002]. In contrast, the scale of searches and the number of detections for the other 20 or so class II masing transitions have been very limited.
Sobolev & Deguchi [1994] developed the first theoretical model to successfully reproduce the high brightness temperatures that characterise strong class II methanol masers (referred to hereafter as the SD model). In the SD model the masers are pumped by infra-red radiation from warm dust close to the star forming region, where the gas phase abundance of methanol is greatly enriched following grain mantle evaporation. The SD model finds that the 6.6- and 12.1-GHz transitions produce strong maser emission over a wide range of physical conditions, providing an explanation as to why maser emission is common in these two transitions [1997a]. It also predicts weaker maser emission from a variety of methanol transitions [1997b], including all the transitions discovered previously [1984, 1985, 1989, 1993, 1995] and subsequently [1999, 2001].
There is considerable evidence that many of the class II methanol maser transitions are spatially coincident, arising from the same region. The 6.6- and 12.1-GHz methanol masers have been shown to be coincident at the milliarcsecond level towards a number of sources [1992, 1993, 2000]. The higher frequency weak maser transitions typically align in velocity with 6.6- and 12.1-GHz spectral features, but definitively proving that they are coincident is more difficult. However, recent BIMA observations of the 86.6- and 86.9-GHz masers in W3(OH) show that they are coincident with the strongest 107.0 GHz masers to within the 01 accuracy of the observations [2001]. These observations support the proposition that the class II methanol maser transitions are excited simultaneously, which if true means that their observation provides tight constraints for maser pumping models.
Many transitions become masers simultaneously in the SD model, so that when masers at several frequencies coincide, the best fitting model conditions can be estimated via multi-transition analysis. This provides a probe of the physical conditions in the maser region. The maser transitions which are strongly inverted only over a small range of model conditions are potentially much more useful for setting constraints on physical conditions than are the stronger, more ubiquitous maser transitions. For example in the modeling of Sobolev et al. the 85.5-GHz transition is predicted to be strongest for gas temperatures less than 50K and gas densities in the range – cm-3, while the 86.6-GHz transition favours higher temperatures and lower densities. The observations of W3(OH) by Sutton et al. [2001] detected maser emission from the same location in the 86.6-, 86.9- and 107.0-GHz transitions, but only thermal or quasi-thermal emission from the 85.5-GHz transition, consistent with a warm gas model. In contrast, towards the southern star forming region 345.010+1.792, 85.5- 86.6-, 86.9-, 107.0- and 108.1-GHz masers have all been detected from the same velocity range [1999, 2001].
Previous searches for the 85.5- and 86.6-GHz methanol maser transitions have been made towards 30 and 35 sources respectively [2001, 2001, 2002]. In this work we report the results of observations of a further 15 and 10 sources not previously searched for 85.5- and 86.6-GHz methanol maser emission respectively. Both weak maser and quasi-thermal emission have been detected, and it is not always easy to distinguish between the two in single dish observations. The 85.5-GHz emission is thought to be of maser origin in 345.010+1.792, 9.621+0.196, 29.95-0.02 and DR21(OH), while the 86.6-GHz emission shows maser characteristics towards W3(OH), 345.010+1.792 and W51-IRS1. The search described here forms part of a program to observe a number of the rarer methanol maser transitions in a consistent sample of sources, selected on the basis of their 107.0-GHz maser emission. Of the 25 known 107.0-GHz masers, 22 can be observed with the Mopra 22-m telescope, and we have searched for 85.5- and 86.6-GHz methanol masers towards those 107.0-GHz masers not targeted in previous surveys. Since only 4 of the 7 previous detections were associated with 107.0-GHz emission, this strategy will provide useful information for modelling the target sources, but does not encompass all candidates for new 85.5- and 86.6-GHz emission.
2 Observations and Data reduction
The observations were made between 2002 July 31 and August 13 using the Australia Telescope National Facility (ATNF) 22-m millimetre antenna at Mopra. At 86 GHz the FWHM antenna beamwidth was 39″. The sources were observed in position switching mode, with 229 seconds spent at the onsource position and 229 seconds offset by -1′ in declination. For the majority of sources this procedure was repeated 10 times giving a total onsource integration time of 38 minutes, which typically yielded an RMS of 0.7 Jy. Two different transitions were observed, the and transitions for which the adopted rest frequencies were 85.568084 GHz and 86.615578 GHz respectively [1995]. The data were collected using a 2-bit digital autocorrelation spectrometer configured with 1024 channels spanning a 64-MHz bandwidth. For an observing frequency of 86 GHz this configuration yields a natural weighting velocity resolution of 0.26 , or 0.44 after Hanning smoothing.
The antenna pointing was checked approximately every two hours through observations of nearby strong SiO masers and showed an RMS scatter of the order of 10″. The system temperature was determined by inserting an ambient temperature load which was assumed to have a temperature of 295K. The measured values varied between 210 and 300K during the observations depending upon the weather conditions and elevation. This method of calibration also corrects for atmospheric absorption [1981] and taking into account pointing inaccuracies the absolute flux density scale of the observations is believed to be accurate to 20 per cent. The amplitude scale was converted from antenna temperature to Jy assuming a sensitivity of 30 JyK-1. The data were processed using the spc reduction package. Quotient spectra were formed for each on/off pair of observations, which were then averaged together, a polynomial baseline fitted and subtracted and the velocity and amplitude scale calibrated.
An erroneous observing procedure meant that at each of 85.5- and 86.6-GHz three sources were observed with the telescope offset by +20″ in right ascension (approximately half the FWHM of the antenna beam at this frequency) from the nominal position. The upper limit listed in Tables 1 & 2 for the sources observed at an offset position has been set to 9 ( times the RMS noise level in the final spectrum as a conservative estimate of the detection limit.
3 Results
3.1 (85.5 GHz)
A total of 22 sources were observed at 85.5 GHz and these are listed in Table 1. With the exception of Orion KL each of these sources shows maser emission in the 6.6- and 107.0-GHz transitions. The observations of Orion KL were used to test the system performance and to aid comparison of the calibration with the results of Cragg et al. [2001] and Minier & Booth [2002]. Emission from the 85.5-GHz transition of methanol was detected towards 5 sources. The spectra of these sources are shown in Fig. 1. Three of the line profiles are broad (Orion KL, NGC6334F and 23.440-0.182) and so the emission is thermal, or quasi-thermal in origin. The emission from 345.010+1.792 is very strong and narrow, and as it aligns with the maser emission at other frequencies and is offset from the velocity range of the thermal emission in this source, it is clearly also masing in this transition. The 85.5-GHz emission towards 328.808+0.633 is narrow, but much weaker than 345.010+1.792 and so from these observations we cannot be certain that it is a maser in this transition. However, the velocity of the emission coincidences exactly with the velocity of the 107-GHz methanol maser in this source, adding support to the argument that 328.808+0.633 is an 85.5-GHz maser. The observation of 9.621+0.196 with 3-=1.5 Jy was not sufficiently sensitive to confirm the previous detection of this source with a peak flux density of 1.2 Jy [2001]. For modelling we have used the flux density measured by Cragg et al. rather than the current observations.
| Name | R.A.(J2000) | Dec.(J2000) | Integration | Flux Density | Velocity | FWHM |
|---|---|---|---|---|---|---|
| (h m s) | (∘ ′ ″) | Time (min) | (Jy) | () | () | |
| Orion KL | 05:35:14.5 | –05:22:30 | 57 | 25.0 | 9.2 | 2.6 |
| 11.8 | 8.3 | 9.4 | ||||
| 188.946+0.886 | 06:08:53.3 | +21:38:29 | 38 | 2.1 | ||
| 192.600–0.048 | 06:12:54.0 | +17:59:24 | 57 | 1.8 | ||
| 310.144+0.760 | 13:51:58.5 | –61:15:42 | 76 | 1.4 | ||
| 318.948–0.196 | 15:00:55.4 | –58:58:53 | 38 | 2.0 | ||
| 323.740–0.263 | 15:31:45.5 | –56:30:50 | 38 | 1.8 | ||
| 327.120+0.511 | 15:47:32.7 | –53:52:38 | 76 | 1.5 | ||
| 328.808+0.633 | 15:55:48.5 | –52:43:07 | 76 | 1.4 | -43.7 | 2.2 |
| 336.018–0.827 | 16:35:09.3 | –48:46:47 | 76 | 1.3 | ||
| 339.884–1.259 | 16:52:04.7 | –46:08:34 | 114 | 1.1 | ||
| 340.785–0.096 | 16:50:14.8 | –44:42:26 | 38 | 1.8 | ||
| 345.003–0.223 | 17:05:10.9 | –41:29:06 | 38 | 2.0 | ||
| 345.010+1.792 | 16:56:47.6 | –40:14:26 | 37 | 9.5 | -22.1 | 0.7 |
| 345.504+0.348 | 17:04:22.9 | –40:44:22 | 38 | |||
| 348.703–1.043 | 17:20:04.1 | –38:58:31 | 38 | 1.5 | ||
| NGC6334F | 17:20:53.4 | –35:47:01 | 37 | 6.5 | -8.3 | 5.9 |
| 353.410–0.360 | 17:30:26.2 | –34:41:46 | 38 | 2.1 | ||
| 9.621+0.196 | 18:06:14.7 | –20:31:32 | 38 | 1.5 | ||
| 12.909–0.260 | 18:14:39.5 | –17:52:00 | 34 | |||
| 23.010–0.411 | 18 34 40.3 | –09:00:38 | 38 | |||
| 23.440–0.182 | 18:34:39.2 | –08:31:24 | 19 | 7.5 | 100.7 | 12.1 |
| 35.201–1.736 | 19:01:45.5 | +01:13:35 | 91 | 1.1 |


Gaussian profiles have been fitted to each of the sources where emission was detected and parameters are listed in Table 1.
3.2 (86.6 GHz)
The 86.6-GHz transition was detected towards 3 of the 18 sites observed (see Table 2). The spectra of sources where emission was detected (with the exception of NGC6334F) are shown in Fig 2. Maser emission was only detected in one source, 345.010+1.792, with thermal emission detected towards Orion KL and NGC6334F. The observation of NGC6334F was at an offset position and is of poor quality compared to previously published spectra [2001], so we have not included it in Fig 2. Marginal narrow emission was detected near the velocity of the 107.0-GHz maser peak towards two other sources (323.740-0.263 & 339.884-1.259) each with a significance of approximately 4-.
| Name | R.A.(J2000) | Dec.(J2000) | Integration | Flux Density | Velocity | FWHM |
|---|---|---|---|---|---|---|
| (h m s) | (∘ ′ ″) | Time (min) | (Jy) | () | () | |
| Orion KL | 05:35:14.5 | –05:22:30 | 19 | 15.8 | 8.8 | 2.1 |
| 12.3 | 8.1 | 6.1 | ||||
| 188.946+0.886 | 06:08:53.3 | +21:38:29 | 34 | 2.4 | ||
| 192.600–0.048 | 06:12:54.0 | +17:59:24 | 34 | 2.2 | ||
| 310.144+0.760 | 13:51:58.5 | –61:15:42 | 38 | 2.1 | ||
| 318.948–0.196 | 15:00:55.4 | –58:58:53 | 38 | 2.2 | ||
| 323.740–0.263 | 15:31:45.5 | –56:30:50 | 76 | 1.9 | ||
| 327.120+0.511 | 15:47:32.7 | –53:52:38 | 38 | 2.2 | ||
| 339.884–1.259 | 16:52:04.7 | –46:08:34 | 34 | 2.4 | ||
| 340.054–0.244 | 16:48:13.9 | –45:21:44 | 34 | 2.3 | ||
| 340.785–0.096 | 16:50:14.8 | –44:42:26 | 34 | 1.9 | ||
| 345.010+1.792 | 16:56:47.6 | –40:14:26 | 28 | 16.4 | -22.0 | 0.3 |
| 10.1 | -21.2 | 0.9 | ||||
| 345.504+0.348 | 17:04:22.9 | –40:44:22 | 31 | 2.4 | ||
| 348.703–1.043 | 17:20:04.1 | –38:58:31 | 38 | 2.7 | ||
| NGC6334F | 17:20:53.4 | –35:47:01 | 38 | 4.0† | ||
| 353.410–0.360 | 17:30:26.2 | –34:41:46 | 38 | 2.0 | ||
| 9.621+0.196 | 18:06:14.7 | –20:31:32 | 38 | |||
| 12.909–0.260 | 18:14:39.5 | –17:52:00 | 38 | |||
| 23.440–0.182 | 18:34:39.2 | –08:31:24 | 38 | 4.1 |


4 Discussion
As well as assessing the prevalence of masers in the 85.5-GHz and 86.6-GHz transitions of methanol, this work sets constraints on maser modelling. According to models of maser pumping, the detection of methanol maser emission in a star formation region signals the presence of special physical conditions, probably associated with a particular evolutionary phase. The common 6.6- and 12.1-GHz methanol masers are excited for a wide range of model parameters and so do not tightly constrain the physical conditions within the region. In contrast, modelling suggests that many of the other, rarer methanol maser transitions are inverted over a more restricted range of parameters. The 85.5- and 86.6-GHz transitions each predominates over a different range of physical conditions [2001], making them potentially useful probes of gas temperature and density.
Table 3 summarises the flux densities in 7 methanol maser transitions of the 25 star forming regions currently known to harbour 107.0-GHz maser emission [2000, 1995]. For the 6.6-, 12.1-, 107.0-, 108.8- and 156.6-GHz transitions the flux densities cited are at the velocity of the 107.0-GHz peak and have been determined by eye from published spectra. For many of the sources detected at 108.8 and 156.6 GHz, thermal emission with no apparent maser component covers the velocity range of the 107.0-GHz peak. Where this occurs the upper limit listed in the table is marked with an asterisk and has been taken to be half the amplitude of the thermal emission at that velocity. This approach has also been used in cases where thermal emission was detected from other transitions. The most noticeable feature of Table 3 is that the 85.5-, 86.6-, 108.8- and 156.6-GHz transitions are all uncommon (in the presence of 6.6-, 12.1- and 107.0-GHz masers). By investigating the range of physical conditions favouring each of these weaker transitions, we are able to distinguish between common and uncommon conditions within high-mass star formation regions.
| Flux Density | |||||||||
| Source | Velocity | 6.6-GHz | 12.1-GHz | 85.5-GHz | 86.6-GHz | 107.0-GHz | 108.8-GHz | 156.6-GHz | references |
| () | (Jy) | (Jy) | (Jy) | (Jy) | (Jy) | (Jy) | (Jy) | ||
| W3(OH) | -43.3 | 3000 | 600 | 72 | 0.6 | 9 | 8,10,11 | ||
| 188.946+0.886 | 10.9 | 495 | 235 | 2.1 | 0.8 | 15.5 | 4.8 | 2 | 2,3,4,5,13 |
| 192.600-0.048 | 4.2 | 72 | 0.4 | 1.8 | 2.2 | 5.8 | 4.5 | 3 | 2,3,4,13 |
| 310.144+0.760 | -56 | 130 | 114 | 1.4 | 2.1 | 23 | 3 | 4 | |
| 318.948–0.196 | -34.2 | 780 | 180 | 2.0 | 2.2 | 5.7 | 2.4 | 2,3,4,13 | |
| 323.740–0.263 | -50 | 2000 | 500 | 1.8 | 1.9 | 12.5 | 5.4 | 4∗ | 2,3,4,13 |
| 327.120+0.511 | -89.8 | 25 | 5 | 1.5 | 2.2 | 9.2 | 2.8 | 2,3,4 | |
| 328.808+0.633 | -43.5 | 380 | 7 | 1.6 | 5.5 | 8∗ | 2,3,4,5,13 | ||
| 336.018–0.827 | -40 | 40 | 25 | 1.3 | 6 | 5.7 | 5∗ | 4,5,13,14 | |
| 339.884–1.259 | -39.0 | 1820 | 850 | 1.1 | 90 | 5.4 | 6 | 2,3,4,13 | |
| 340.054–0.244 | -62.8 | 0.3 | 1 | 2.3 | 2.9 | 2 | 2,3,4 | ||
| 340.785–0.096 | -105.9 | 144 | 43 | 1.8 | 1.9 | 6.1 | 2 | 2,3,4 | |
| 345.003–0.223 | -26.9 | 160 | 1 | 2.0 | 2.9 | 3.5 | 6∗ | 2,3,4,5,13 | |
| 345.010+1.792 | -21.7 | 330 | 300 | 11.2 | 13.8 | 82 | 7.5 | 18 | 2,3,4,13 |
| 345.504+0.348 | -17.7 | 174 | 4.7 | 4.7 | 2.4 | 2.3 | 4∗ | 2,3 | |
| 348.703–1.043 | -3.3 | 60 | 34.5 | 1.5 | 2.7 | 7.6 | 1.5 | 2,3,4 | |
| NGC6334F | -10.2 | 3300 | 1000 | 14.8 | 17∗ | 2,3,4,5 | |||
| 353.410–0.360 | -20 | 90 | 5 | 2.1 | 2.0 | 5.5 | 2 | 2,3,4 | |
| 9.621+0.196 | -0.5 | 100 | 10 | 1.5 | 22 | 3∗ | 2,3,4,5,13 | ||
| 12.909–0.260 | 39.5 | 317 | 11.5 | 3.8 | 5.5 | 3∗ | 2,3,4,5,13 | ||
| 23.010–0.411 | 75.9 | 405 | 28 | 5.2 | 5.1 | 2 | 2,3,4,5,13 | ||
| 23.440–0.182 | 97.2 | 23 | 9 | 4.1 | 4.4 | 2 | 2,3,4 | ||
| 35.201–1.736 | 42 | 560 | 25 | 1.1 | 24 | 4.8 | 4.6 | 2,3,4,5 | |
| Cep A | -2.2 | 1420 | 7 | 16 | 5.0 | 3 | 6,7,8,9,10 | ||
| NGC7538 | -56.3 | 346 | 200 | 17 | 1,8,9,12 | ||||
4.1 Variability in 345.010+1.792
The 85.5- and 86.6-GHz methanol masers in 345.010+1.792 were discovered by Cragg et al. [2001]. Our survey confirms the exceptional nature of this source, which remains the prime example of masers at these frequencies. Comparison of spectra for the same transitions obtained at different epochs or with different telescopes allows us to examine variability in these transitions, although this is complicated by uncertainties in the velocity and flux density calibration. Figure 3a shows the 85.5-GHz emission in 345.010+1.792 at 3 different epochs covering a period of 6 years. The single peaked line profile appears to have narrowed slightly over the period, but it is not possible to quantify the variability as some is likely to be due to calibration uncertainties. Figure 3b shows the 86.6-GHz emission in 345.010+1.792 at 3 epochs covering essentially the same time range as the 85.5-GHz observations. The 86.6-GHz transition shows a clear double peaked profile and comparison of the relative intensities of these two features shows significant changes over a 6 year interval. The amplitude calibration of the 1996 observations from Mopra was uncertain by as much as a factor of 2 [2001] and comparison of the 86.6-GHz spectrum of Orion KL from 1996 with that from the current observations shows the 1996 peak flux density to be lower by a factor of 1.8. The emission from Orion is thought to be quasi-thermal in origin and should therefore not vary, which suggests that the flux densities from the 1996 Mopra 86.6-GHz observations should be scaled in amplitude by a factor of 1.8. Note that all the spectra in Fig. 3 have been aligned with the peak emission velocity in observations made in October 2002 using the newly upgraded Australia Telescope Compact Array (ATCA) at 3mm (Minier, Burton & Wong, in prep). This required small, but significant shifts in some of the spectra, as detailed in the Figure caption, which can be attributed to an error in the AOS frequency calibration for the SEST 2000 observations, and intermittent errors in the velocity scale which are known to effect Mopra observations.
(a)

(b)

The very narrow line width, offset velocity from the thermal emission in other transitions towards this source and clear temporal variability provides conclusive evidence that the 86.6-GHz emission in 345.010+1.792 is a maser. It should also be noted that the strongest emission from the 85.5- and 86.6-GHz transitions are coincident in velocity to within 0.1 . The recent imaging of the 85.5- and 86.9-GHz methanol masers in 345.010+1.792 by Minier et al. has shown them to be spatially coincident at the arcsecond level at the same position (=16:56:47.56, =-40:14:26.3) as the 6.6-, 12.1- and 107.0 GHz masers.
4.2 Modelling
The observations reported here, combined with the search of Minier & Booth [2002], demonstrate that class II methanol masers at 85.5 and 86.6 GHz are weak ( Jy), and rarely detected at the sensitivity of the current experiment. We can use the results of maser modelling calculations to distinguish between conditions in those few sources which display masers at these frequencies, the remaining target sources with methanol masers at both 6.6 and 107.0 GHz, and the majority of 6.6-GHz methanol maser sources which lack millimetre wavelength maser counterparts.
We have used the model of Sobolev & Deguchi [1994] to map out the prevalence of the various class II methanol masers as a function of the model parameters representing physical conditions. Calculations involving this model were previously reported by Sobolev et al. [1997a, 1997b], Cragg et al. [2001], Sutton et al. [2001], and Cragg, Sobolev & Godfrey [2002]. Altogether 1131 energy levels of methanol (with torsional states for both A and E symmetry species) were included [1999]. The maser pumping is governed by infrared radiation from warm dust at temperature , which promotes the methanol molecules to their torsionally excited states. We assumed a dust filling factor of 0.5 and opacity , where is the frequency in Hz. This is consistent with the observations of De Buizer, Piña & Telesco [2000] that the optical depth at 9.7 m of mid-infrared emission associated with methanol masers can be as large as 1. Radiative transfer was treated in the large velocity gradient (LVG) approximation, augmented by a beaming factor , defined as the ratio of optical depths parallel and perpendicular to the line of sight. This represents the assumed elongation of the maser region towards the observer. In this treatment the maser amplification and hence the brightness is governed by , representing the column density of methanol along the line of sight divided by the line width of the emission. In terms of observable parameters, multiplying by the typical line width of a methanol maser (0.5 ) and the beaming factor gives the methanol column density. The parameter is referred to as the specific column density of methanol. The masers develop in gas of temperature and density , where the methanol molecules undergo collisions with molecular hydrogen. Collisional excitation rates are based on the model of Peng & Whiteoak [1993], which uses propensity rules derived from a small number of laboratory measurements. The masers amplify radiation from a background ucH ii region, here assumed to have brightness temperature K, and geometrical dilution 0.002. The model produces methanol masers in the absence of a background ucH ii region, but with lower brightness temperature in the centimetre wavelength masers than when the ucH ii region radiation is included.
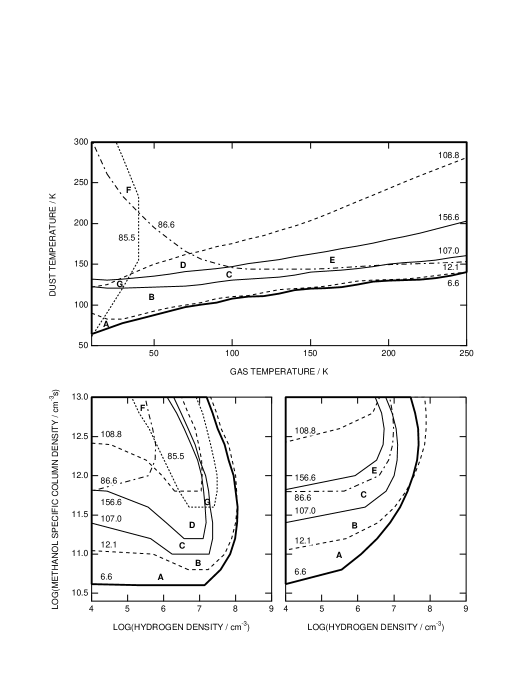
Figure 4 displays the results of model calculations in which , , and are systematically varied. Each plot shows the result of varying two of these parameters, while the other two are held constant, representing selected planes through the parameter space. Figure 4 displays a single contour for each of the maser transitions listed in Table 3 (6.6, 12.1, 85.5, 86.6, 107.0, 108.8, 156.6 GHz). The contour value is set at brightness temperature K. Thus the area enclosed by each contour represents combinations of model parameters which give rise to masers at that frequency which are strong enough to be readily observed. Note that the exponential maser amplification leads to a very rapid rise in maser brightness, with the 6.6-GHz maser attaining brightness temperatures K. This style of plot is useful for identifying regimes where different masers switch on simultaneously. Such plots can also be used to define limits on parameter values, while recognising that they represent only a partial exploration of the many dimensional phase space of the model.
The top panel of Fig. 4 shows the behaviour of the model as dust and gas temperatures are varied, with the gas density fixed at and methanol specific column density fixed at . Masers appear in the upper part of the plot, but disappear if the dust temperature is too low (insufficient pumping). All the masers investigated here, with the exception of the 86.6-GHz line, are more readily excited at lower gas temperatures. Under the conditions shown, the 6.6- and 12.1-GHz masers appear together, requiring K. The 107.0-, 156.6- and 108.8-GHz masers require K, and progressively greater dust temperatures in warmer gas. The 85.5-GHz maser is confined to low gas temperature, while the 86.6-GHz maser is favoured by higher gas temperatures, with the two appearing together only for dust temperatures K and gas temperatures K. De Buizer et al. [2000] measure dust temperatures in the range of 100-200K for the mid-infrared sources associated with strong 6.6-GHz methanol masers, consistent with the general findings of the modelling.
The lower panels of Fig. 4 show the behaviour of the model as methanol column density and gas density are varied, with the dust temperature fixed at K, for gas temperatures fixed at and 130 K in the left and right panels respectively. Masers appear above the threshold in the upper left parts of the plots, but disappear if the methanol column density is too low (insufficient amplification) or the gas density is too high (thermalisation of populations). The 6.6-GHz masers appear over the widest range of conditions, and are accompanied by masers at 12.1 GHz except at the lowest methanol column densities. The 107.0-, 156.6- and 108.8-GHz masers turn on in sequence as the methanol column density is increased, but do not extend to such high gas density as the centimetre wavelength masers. The 85.5-GHz maser is confined to low gas temperature and intermediate gas densities, while the 86.6-GHz maser has a somewhat complementary distribution, with the two appearing together only for large methanol column density.
The majority of class II methanol maser sources are characterised by centimetre wavelength maser emission at 6.6 and/or 12.1 GHz, without maser counterparts at millimetre wavelengths. Points marked ‘A’ in Fig. 4 are examples of model conditions producing masers above the threshold at 6.6 GHz only, while points marked ‘B’ produce 6.6- and 12.1-GHz masers simultaneously. The calculations suggest that these sources have dust temperatures K, but do not place limits on their gas temperatures. The gas density is , with methanol specific column density . It is likely that the percent of these sources which are detectable at 6.6 GHz but not at 12.1 GHz have lower values of methanol column density than the sources exhibiting both masers. The few sites known to exhibit masers at 12.1 GHz only are probably at the high gas density limit of the maser range.
In the following we assume that when masers at different frequencies are detected at matching velocities, they are simultaneously excited. Studies at high spatial resolution are required to confirm this by establishing whether or not the different masers are positionally coincident. In comparison with the centimetre wavelength maser sources, the 25 target sources which also have detectable masers at 107.0 GHz are likely to have slightly warmer dust temperatures, or to have slightly greater methanol column density, but do not exceed gas density . Points marked ‘C’ in Fig. 4 are examples of conditions producing masers above the threshold at 107.0 GHz, but not at the other millimetre wavelengths, as was observed for 18 of the 25 sources in Table 3. The 3 sources with masers at 156.6 GHz (but not at 85.5, 86.6 or 108.8 GHz) continue the trend to greater dust temperature and/or methanol column density. Points marked ‘D’ in Fig. 4 are examples of this combination. The remaining 4 sources with 85.5-, 86.6- and/or 108.8-GHz masers represent outliers in the population of maser sites.
We can estimate gas temperatures for these latter 4 sources: first roughly from the regions in Fig. 4 with appropriate combinations of masers, and subsequently with a more quantitative approach to fitting model calculations to observations. For example, W3(OH) with masers at 6.6, 12.1, 107.0 and 86.6 GHz (but not 85.5, 108.8 or 156.6 GHz) is likely to be an example of a warm gas source, with conditions resembling those of points ‘E’ in Fig. 4. This is confirmed by detailed modelling by Sutton et al. [2001] which obtained K. The exceptional source 345.010+1.792 shows maser emission in all 7 transitions, and if we assume these to coincide then Fig. 4 suggests a cool gas temperature, warm dust temperature and large methanol column density, as exemplified by the points marked ‘F’. Detailed modelling by Cragg et al. [2001] confirms this (Model B of that paper), but predicts accompanying maser action at 94.5 GHz which was not detected.
The sources 328.808+0.633 and 9.621+0.196 exhibit masers at 6.6, 12.1, 107.0 and 85.5 GHz (but not at 86.6, 108.8 or 156.6 GHz), although in both cases the 85.5-GHz maser is particularly weak. Fig. 4 suggests a cool gas temperature, with conditions resembling those of point ‘G’. We have undertaken new fitting of the model to observations, along the lines described in Cragg et al. [2001] and Sutton et al. [2001]. Table 4 displays a comparison between the maser observations in 328.808+0.633 and 9.621+0.196 and examples of cool gas models ( K) which partially account for them. The models illustrated in Table 4 predict strong masers at 6.6 and 12.1 GHz and weak masers at 85.5 and 107.0 GHz. The detection of very weak maser action at 85.5 GHz is consistent with these models, as are the nondetections at 86.6, 108.8 and 156.6 GHz. De Buizer et al. [2000] estimate the dust temperature in the region of 328.808+0.633 to be approximately 125K, in good agreement with the model in Table 4. However, they were unable to estimate a dust temperature for 9.621+0.196 due to the non-detection of mid-infrared emission towards this source. In both cases the calculated 12.1-GHz maser intensity is considerably greater than that observed.
In order to compare observed flux densities with calculated brightness temperatures, we must make an assumption about the size of the maser region. For the examples shown in Table 4, the size assumed is 60 milliarcseonds (mas) for 328.808+0.633 and 20 mas for 9.621+0.196, chosen to match the flux density observed at 6.6 GHz to the brightness temperature calculated for these particular models. The detailed study of milliarcseconds structures of methanol masers by Minier et al. [2002] found that at both 6.6 and 12.2 GHz the masers consist of a compact core (of the order of 0.5-3 mas in size) surrounded by a more extended halo with dimensions approximately an order of magnitude larger. The sizes we have assumed are therefore consistent with the dimensions of the halo component of the masers. One of the sources examined in detail by Minier et al. [2002] was 9.621+0.196 at 12.2 GHz. For the emission at -0.5 they measured a halo size of mas and a core of 2 mas.
The models presented above can account for the presence of different maser line combinations in the different sources, but do not agree quantitatively with all observations, as Table 4 illustrates. This may be due to insufficient exploration of the parameter space, or to deficiencies in the model. While the maser pumping is dominated by radiative processes, the 85.5- and 86.6-GHz masers in particular are sensitive to the gas density and temperature, and therefore to the collisional excitation rates, which are not accurately known for methanol. Some calculations with nonselective collisional excitation rates by Sobolev et al. [1997b] and Cragg et al. [2001] illustrate how the maser intensities at high gas densities can be affected by changes to the collision model. Until better collisional excitation rates become available for methanol, the density estimates from maser modelling will be subject to order-of-magnitude uncertainties.
The examples above illustrate how the combination of methanol maser transitions observed in a particular source can be used to identify plausible excitation conditions. This approach is particularly valuable for sources which exhibit masers in several transitions simultaneously. The majority of class II methanol maser sources, however, have been detected in only the 6.6- and/or 12.1-GHz transitions. While the model can identify minimum conditions of dust temperature and methanol column density required to excite these masers, together with an upper limit to the gas density, observations of these two lines alone are not enough to fully characterise the maser sites in these high-mass star forming regions. Nevertheless, the upper limits on nondetected lines provide a powerful constraint on the conditions in such sources, particularly when data is available for several lines sensitive to complementary factors. As further surveys are undertaken at a variety of methanol maser frequencies, it should be possible to refine quantitative estimates of physical conditions, both in the exceptional sources with masers at many frequencies, and in the others which are more typical of high-mass star formation regions.
Source Transition Frequency (GHz) (Jy) (K) (Jy) 328.808+0.633 6.6 380 3.89E+09 380 12.1 7 4.48E+08 146 85.5 1.6 8.98E+04 1.4 86.6 2.4 -1.83E+02 107.0 5.5 1.20E+05 3.0 108.8 6 -4.39E+01 156.6 8 2.11E+02 9.621+0.196 6.6 100 1.04E+10 100 12.1 10 1.85E+09 59.3 85.5 1.2 6.53E+05 1.0 86.6 2.3 -1.81E+02 107.0 22 5.44E+06 13.5 108.8 3 3.82E+03 156.6 3 4.95E+05 2.6
5 Conclusions
We have undertaken a search for the 85.5- and 86.6-GHz transitions of methanol towards 22 southern sources which exhibit 107-GHz methanol masers. These observations show that maser emission from both of these transitions is rare. We have examined the implications of these findings in the context of the Sobolev & Deguchi model for methanol masers and find that our results are consistent with
-
1.
The majority of class II methanol maser sources, which show methanol maser emission at only 6.6 and 12.1 GHz, have dust temperature K, gas density , and methanol specific column density .
-
2.
The minority of sources which also show 107.0-GHz methanol maser emission have slightly higher or slightly larger than those which don’t.
-
3.
The four known sources which also show 156.6-GHz methanol maser emission continue this trend to slightly larger and .
-
4.
The four known sources with 85.5- and 86.6-GHz methanol maser emission represent outliers in the population of maser sites, with 85.5-GHz maser emission characteristic of low gas temperature ( K), 86.6-GHz maser emission characteristic of high gas temperature ( K), and both present simultaneously only if K or .
A comparison of the 85.5- and 86.6-GHz methanol maser spectra observed towards 345.010+1.792 with published and unpublished spectra from earlier epochs shows clear variability, particularly for the 86.6-GHz transitions. In combination with the narrow line width of the emission and the offset of the 85.5- and 86.6-GHz emission from the velocity of the thermal emission for other molecular species in 345.010+1.792 this presents conclusive evidence that these transitions are masing in this exceptional source.
Acknowledgements
We would like to thank Paolo Calisse and John Shobbrook for their assistance with the observations and the University of NSW and the ATNF for their assistance in arranging observing support, in particular Lucyna Kedziora-Chudczer, Michael Burton and Bob Sault. The Australia Telescope is funded by the Commonwealth of Australia for operation of a National Facility managed by CSIRO. This research has made use of NASA’s Astrophysics Data System Abstract Service. PDG and DMC thank the Victorian Partnership for Advanced Computing for financial support.
References
- [1987] Batrla, W., Matthews, H. E., Menten, K. M., Walmsley, C. M. 1987, Nat 326, 49
- [1995a] Caswell, J. L., Vaile, R. A., Ellingsen, S. P., Whiteoak, J. B., Norris, R. P. 1995, MNRAS 272, 96
- [1995b] Caswell, J. L., Vaile, R. A., Ellingsen, S. P., Norris, R. P. 1995, MNRAS 274, 1126
- [2000] Caswell, J. L., Yi, J., Booth, R. S., Cragg, D. M. 2000, MNRAS 313, 599
- [2001] Cragg, D. M., Sobolev, A. M., Ellingsen, S. P., Caswell, J. L., Godfrey, P. D., Salii, S. V., Dodson, R. G. 2001, MNRAS 323, 939
- [2002] Cragg D. M., Sobolev A. M., Godfrey P. D. 2002, MNRAS, 331, 521
- [2000] De Buizer, J. M., Piña, R. K., Telesco, C. M. 2000, ApJSS, 130, 437
- [1996] Ellingsen, S. P., von BIbra, M. L., McCulloch, P. M., Norris, R. P., Deshpande, A. A., Phillips, C. J. 1996, MNRAS 280, 378
- [1989] Haschick, A. D., Baan, W. A., Menten, K. M. 1989, ApJ 346, 330
- [1988] Koo, B., Williams, D. R. W., Heiles, C., Backer, D. C. 1988, ApJ 326, 931
- [1981] Kutner, M. L., Ulich, B. L. 1981, ApJ 250, 341
- [1992] MacLeod, G. C., Gaylard, M. J., Nicolson, G. D. 1992, MNRAS 254, 1p
- [1997] Mehringer, D. M., Zhou, S., Dickel, H. R. 1997, ApJ 475, L57
- [1991a] Menten, K. M. 1991a, in ASP Conf. Ser. 16, Atoms, ions and molecules: New results in spectral line astrophysics, ed. A. D. Haschick & P. T. P. Ho, 119
- [1991b] Menten, K. M. 1991b, ApJ 380, L75
- [1992] Menten, K. M., Reid, M. J., Pratap, P., Moran, J. M., Wilson, T. L. 1992, ApJ 401, L39
- [1999] Mekhtiev M. A., Godfrey P. D., Hougen J. T. 1999, J.Mol.Spec. 194, 171
- [2000] Minier, V., Booth, R. S., Conway, J. E. 2000, A&A 362, 1093
- [2002] Minier, V., Booth, R. S. 2002, A&A 387, 179
- [2002] Minier, V., Booth, R. S., Conway, J. E. 2002, A&A 383, 614
- [1993] Norris, R. P., Whiteoak, J. B., Caswell, J. L., Wieringa, M. H., Gough, R. G. 1993, ApJ 412, 222
- [1993] Peng R. S., Whiteoak J. B. 1993, MNRAS 260, 529
- [1995] Slysh, V. I., Kalenskii, S. V., Val’tts, I. E. 1995, ApJ 442, 668
- [1999] Slysh, V. I., Val’tts, I. E., Kalenskii, S. V., Voronkov, M. A., Palagi, F., Tofani, G., Catarzi, M. 1999, A&ASS 134, 155
- [1994] Sobolev, A. M., Deguchi, S. 1994, A&A 291, 569
- [1997a] Sobolev, A. M., Cragg, D. M., Godfrey, P. D. 1997a, A&A 324, 211
- [1997b] Sobolev, A. M., Cragg, D. M., Godfrey, P. D. 1997b, MNRAS 288, 139
- [2001] Sutton, E. C., Sobolev, A. J., Ellingsen, S. P., Cragg, D. M., Mehringer, D. M., Ostrovskii, A. B., Godfrey, P. D. 2001, ApJ 554, 173
- [2002] Szymczak, M., Kus, A. J., Hrynek, G., Kepa, A., Pazderski, E. 2002, A&A, 392, 277
- [1995] Tsunekawa, S., Ukai, T., Toyama, A., Takagi, K. 1995, report for the Grant-in-aid for Scientific Research on Priority Areas (Interstellar Matter, 1991-1994) of the Ministry of Education, Science and Culture, Japan
- [1995] Val’tts, I. E., Dzura, A. M., Kalenskii, S. V., Slysh, V. I., Booth, R. S., Winnberg, A. 1995, A&A 294, 825
- [1999] Val’tts, I. E., Ellingsen, S. P., Slysh, V. I., Kalenskii, S. V., Otrupcek, R., Voronkov, M. A. 1999, MNRAS 310, 1077
- [1997] Walsh, A. J., Hyland, A. R., Robinson, G., Burton, M. G. 1997, MNRAS 291, 261
- [1984] Wilson, T. L., Walmsley, C. M., Snyder, L. E., Jewell, P. R. 1984, A&A 134, L7
- [1985] Wilson, T. L., Walmsley, C. M., Menten, K. M., Hermsen, W. 1985, A&A 147, L19
- [1993] Wilson, T. L., Hüttemeister, S., Dahmen, G., Henkel, C. 1993, A&A 268, 249