I Zw 1: Decomposition of the Nearby QSO Host††thanks: Based on observations collected at the Very Large Telescope (UT1) of the European Southern Observatory, Paranal, Chile, under service mode project 67.B-0009.
The paper presents an analysis of the nearby QSO host I Zw 1 based on new J-band imaging data, obtained with ISAAC at the Very Large Telescope (VLT) of the European Southern Observatory (ESO). As one of the best-studied QSOs with exceptional properties lying between those of QSOs, narrow-line Seyfert 1s, and ultraluminous infrared galaxies, I Zw 1 is a prime candidate for a detailed case study of a QSO host. With its high angular resolution and sensitivity, the new J-band image provides strong evidence for an interaction between I Zw 1 and the western companion galaxy. We present a procedure for subtracting the QSO nucleus from the I Zw 1 image to obtain an undisturbed view on the underlying host galaxy. Based on the derived surface brightness profile and the gas rotation curve, the host is classified as a high-surface-brightness Freeman type I galaxy with a central disk surface brightness significantly larger than that of normal spirals. The surface-brightness profile is decomposed into a Plummer bulge and a Kuzmin disk with similar luminosities and a bulge-to-disk scale length ratio of 0.29, comparable to that of nearby spiral hosts with active galactic nuclei (AGN). Different models for the decomposition of the gas rotation curve are discussed. The resulting J-band mass-to-light ratio (M/L) of for the disk component suggests a mean solar-type stellar population with a tendency towards young stars. The bulge exhibits a lower M/L of , which supports previous findings of enhanced starburst activity in the nuclear and circumnuclear region.
Key Words.:
Galaxies: individual: I Zw 1 – Galaxies: active – Galaxies: photometry – Galaxies: structure – Methods: observational1 Introduction
Due to their extreme properties in many physical respects, active galactic nuclei have attracted much interest for a long time. Thanks to improvements in sensitivity and angular resolution, the host galaxies have become a new focal point (e.g. Bothun et al. 1984; Lowenthal et al. 1995; McLeod 1995; Hunt et al. 1999; Márquez et al. 2000), as host disks are considered as the fuel reservoirs for their embedded active nuclei (e.g. Shlosman et al. 1990; Evans et al. 2001; Pogge & Martini 2002). Structures and stellar populations of the hosts seem to be closely entangled with the evolution and types of their active nuclei (Storchi-Bergmann et al. 2001). In order to minimize the effects of dust extinction, stellar properties of host galaxies are preferentially observed in the near-infrared (NIR). Nevertheless, the measured nuclear and circumnuclear fluxes are still dominated by the high energy output of the embedded active nucleus. As an unresolved source, the active nucleus is usually removed by subtracting an appropriately scaled point-spread function (PSF). Most statistical studies of AGN hosts, however, lack an exact knowledge of the AGN flux contribution so that the scaling is often rather arbitrary. It is determined either by assuming the residual central stellar component of the host to be flat or by applying some fitting algorithm (e.g. Bahcall et al. 1995; Hunt et al. 1999; Percival et al. 2001). In contrast to these statistical approaches, this paper focusses on a detailed study of one nearby representative of QSO hosts, the QSO host I Zw 1, for which some basic data are listed in Table 1.
-
a
km s-1 Mpc-1 and will be adopted throughout the paper.
This case study benefits from the fact that a reliable subtraction procedure for the I Zw 1 AGN can be deduced from known flux fractions. By two independent methods, Eckart et al. (1994) and Schinnerer et al. (1998) find a stellar fraction of 15% in the total nuclear K-band flux and a stellar fraction of 27%6% in the total nuclear H-band flux. Both results refer to a non-extincted QSO component surrounded by a stellar component which is extincted by 10 to 20 mag. The first method (Eckart et al. 1994) is based on a comparison of the nuclear NIR colours of I Zw 1 with the colours of a mean zero-redshift QSO (Hyland & Allen 1982), while the second method (Schinnerer et al. 1998) investigates the depths of stellar absorption lines in the NIR spectra. The large stellar flux contribution seems to be connected with the strong activity of a yr-old decaying starburst (Schinnerer et al. 1998), probably located in the circumnuclear molecular ring which has recently been resolved in (10) maps (Staguhn et al. 2001) and shows a radius of about 1 kpc.
Since I Zw 1 shows properties of high-redshift QSOs, like the blueshifted nuclear emission lines of [C iv] , [Si vi] , and [Al ix] (Buson & Ulrich 1990; Schinnerer et al. 1998), this case study implies interesting consequences for evolutionary scenarios. With properties lying inbetween those of QSOs, narrow-line Seyfert 1s, and ultraluminous infrared galaxies, I Zw 1 is discussed as a possible transition object from the QSO to the ultraluminous infrared stage (Canalizo & Stockton 2001) regarding the original evolutionary scheme for AGN (Sanders et al. 1988). According to its nuclear blue magnitude of mag (Smith et al. 1986, adopted for km s-1 Mpc-1), I Zw 1 just belongs to the QSO class defined by mag (, Veron-Cetty & Veron 1998), although the host galaxy is visible. I Zw 1 has a radio-quiet AGN (Barvainis & Antonucci 1989; Kukula et al. 1995) whose radio source has not been resolved at the observed angular resolutions so far (see Kukula et al. 1995). Its narrow-line Seyfert 1 characteristics are prototypical of this class, like the narrow H line with a FWHM of 1240 km s-1 (Boller et al. 1996), the low line ratio of [O iii]/H of 0.49 (Hutchings & Crampton 1990), and the many Fe ii multiplets (Oke & Lauer 1979; Hutchings & Crampton 1990; Vestergaard & Wilkes 2001). With an infrared luminosity of (Canalizo & Stockton 2001), I Zw 1 just fails to be an ultraluminous infrared galaxy but it still belongs to the luminous infrared objects.
The host of I Zw 1 consists of an extended rotating disk as supported by the double-horned line profiles of H i (Condon et al. 1985) and CO (Barvainis et al. 1989), the spiral arms in the optical and NIR images, and the (10) velocity field (Schinnerer et al. 1998). The fuelling mechanisms which are responsible for driving the gas from the gas-rich host towards the AGN are unclear, even on large scales. On the one hand, there is certainly no large-scale bar component as can be seen from the disk images as well as the symmetric (10) isovelocity diagram (Schinnerer et al. 1998). On the other hand, the blue disk colours of –0.7 (Hutchings & Crampton 1990) indicate enhanced star formation in the disk which can be modelled for the north-western spiral arm by either a young decaying starburst ( yr) or an old ( yr) constant starburst (Schinnerer et al. 1998). Together with slight tidal features in the H i distribution (Lim & Ho 1999) and in the B’-band image (Canalizo & Stockton 2001) this suggests that an interaction with the nearby western companion galaxy may trigger the nuclear activity. However, the evidence for an interaction is weak (Canalizo & Stockton 2001) and it remains controversial whether I Zw 1 is undergoing a minor merger process.
The new J-band data complement the knowledge about I Zw 1, which is already one of the best-studied QSO hosts. Observations, data reduction, and data analysis are described in Sect. 2. The resulting surface-brightness profile is presented together with the derived gas rotation curve in Sect. 3. After an introduction to the applied gravitational potential models, the surface-brightness profile and the gas rotation curve are decomposed into structural components in Sect. 3.4. The obtained parameters are discussed in Sect. 4 and compared to the reviewed properties of the I Zw 1 host. A summary of the results is presented in Sect. 5.
2 Observations and Data Reduction
NIR imaging data in the J-band have been obtained with the ISAAC camera at the VLT of ESO on Cerro Paranal in Chile. All processed data of this paper – the object frames as well as the standard star frames for photometric calibration – were observed within two consecutive hours. Basic parameters of the observation runs and the corresponding air masses are listed in Table 2.
-
Characteristics of the ISAAC J-band filter: central wavelength , width .
2.1 Image Reduction and Photometric Calibration
Four object frames are available in J-band, in each of which the object has a different position on the detector. The images are reduced by means of standard procedures of the IRAF software package. Since I Zw 1 only occupies a small fraction of the total field of view in an else uncrowded environment, sky and dark current are removed by subtracting the object frames from each other for all possible permutations. Some modifications of the reduction steps turn out to optimize the final background noise: First, the flatfield shows variations of less than 1% – measured in several pixel boxes in the region of interest – so that a flatfield correction is ignored. Second, the sky-subtracted and aligned images are combined, using a median algorithm. The advantage of this algorithm over the average algorithm is that residual stars in the sky-subtracted images are effectively removed during combination.
A standard star from the catalogue of the faint NIR LCO/Palomar NICMOS standards (Persson et al. 1998) was observed for photometric calibration. The match between these standards and the ISAAC filters has not yet been experimentally verified but the colour terms are expected to be close to zero. Observed in the same acquisition modes, the calibration frames are reduced parallel to the object frames. The flux of the star is measured at all five different detector positions in the unaligned frames to account for detector variations. Mean and standard deviation of the five values are used for the final zero-point determination and the calibration error, respectively. The derived zero-point is corrected for air mass with the canonical average value of given for J in the ISAAC manual.
2.2 Subtraction of the Nucleus
In order to investigate the host galaxy of I Zw 1, the non-stellar brightness contribution of the QSO has to be subtracted. For a two-dimensional subtraction, the PSF of the original J-band image is built with a gaussian using the IRAF task PSF. To account for asymmetries, the residuals of the fit are stored in an additional lookup table. In order to subtract only the non-stellar portion of nuclear flux, the PSF has to be appropriately scaled. Without any prior assumptions about bulge shape or fitting constraints, the scaling is determined from the known stellar contributions to the total nuclear H- and K-band fluxes (Eckart et al. 1994; Schinnerer et al. 1998) as mentioned in Sect. 1. The corresponding J-magnitude is computed using the JHK colours of a mean zero-redshift QSO (Hyland & Allen 1982). The QSO turns out to be 0.08 mag fainter than the total nuclear J-magnitude starting from the K-band estimate and 0.19 mag fainter starting from the H-band estimate. As expected, both results are similar and the mean value of 0.13 mag is used for the final scaling of the PSF.
2.3 Deriving the Surface-Brightness Profile
The analysis of the I Zw 1 host is restricted to a one-dimensional fitting of radial profiles. A one-dimensional decomposition turns out to be sufficient for the goals of this NIR study, since (i) spiral arms are not as pronounced in the NIR as in the optical and (ii) I Zw 1 is seen nearly face-on so that its brightness distribution is radially symmetric to a good approximation – the latter being supported by a previous NIR investigation of I Zw 1 (Peletier et al. 1999) in which ellipse fitting resulted in an almost constant ellipticity of about 0.1 throughout the disk. The radial surface-brightness profile is determined by measuring the flux per arcsec2 along circles around the centre of I Zw 1 using the IRAF task PRADPROF. Error bars are computed as the standard deviation of numerous values along neighbouring circles in radially logarithmic bins. Neglecting the slight ellipticity of the isophotes adds radial smearing to the measured profile. To estimate the amount of smearing, the radially averaged profile is cross-checked with a direct cut along the kinematic major axis. Both curves agree well within the error bars.
Since the minimum integration time of the ISAAC detector was increased by a factor of 2 on July 24th, 2001, the nuclear J-band flux in a few central pixels exceeds the analog-to-digital-units (ADU) level above which non-linearity of the array occurs. To make sure that no nuclear flux is lost in the J-band images, the formula
| (1) |
provided in the ISAAC reduction guide, is used to correct the flux in the brightest pixels. The difference between the corrected and the uncorrected values is expressed as errors of the data points.
According to the relative photometric calibration based on the LCO/Palomar NICMOS system (Persson et al. 1998), the surface brightness is given in units of mag arcsec-2. In order to obtain an absolute calibration in units of Watt m-2 Hz-1, the UKIRT absolute flux calibration (Beckwith et al. 1976) is used, taking into account the slight zero-point offset of (Hawarden et al. 2001). The resulting conversion formula is given by
| (2) |
where is the flux, the magnitude, and the absolute calibration factor already including the zero-point offset. The luminosity follows from , where is the distance of I Zw 1. For the final calibration in solar luminosities, the J-band luminosity of the sun is taken from Table 2.1 in Binney & Merrifield (1998) and is divided by the band width of the filter. In total, the applied transformation formula is
| (3) |
3 Results
3.1 The J-Band Image
The typical characteristics of the I Zw 1 environment – like the two-armed spiral structure, the northern foreground star, and the nearby western galaxy – can be seen in the reduced and calibrated J-band image (Fig. 1).
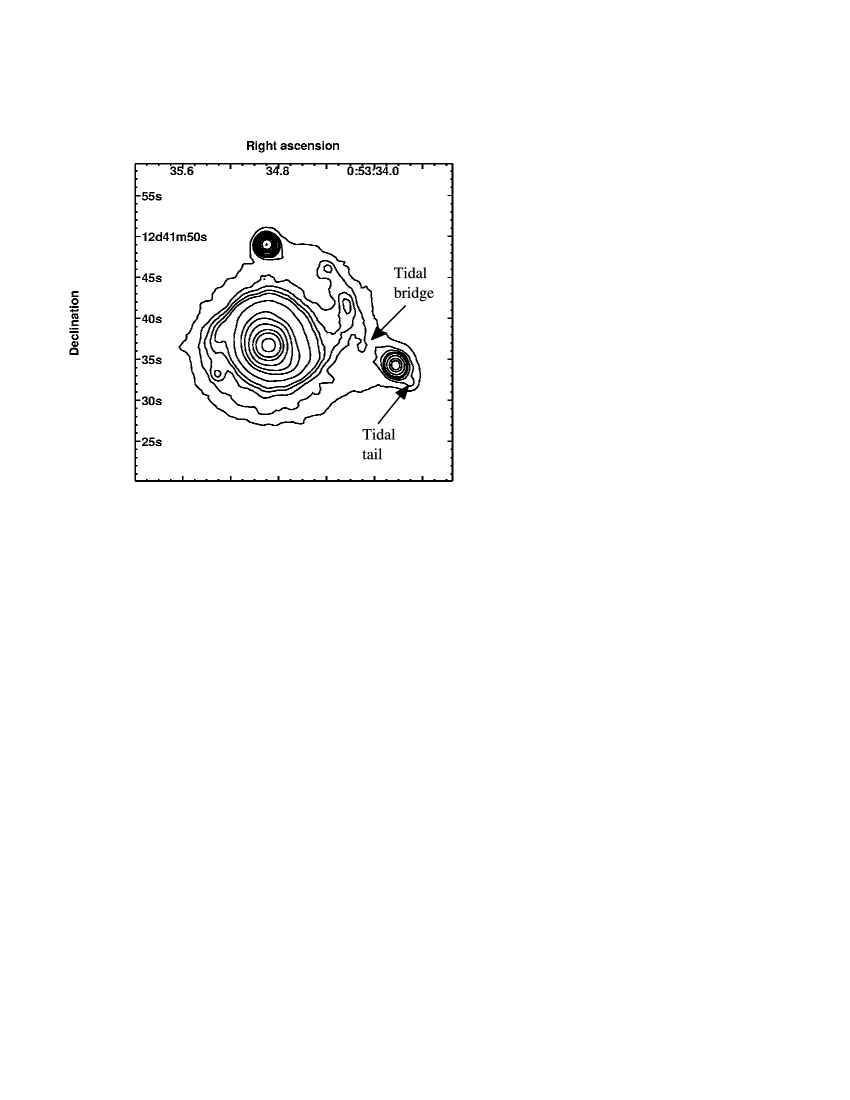
The image gives strong evidence for an interaction between I Zw 1 and the companion, since it allows an unprecedented view on the possible interaction zone between the western spiral arm and the companion, showing an elongation of the companion as well as two features which suggest a tidal bridge and a tidal tail. The detailed insights are provided by the high angular resolution – with a Gaussian full width at half maximum (FWHM) of of the stellar PSF – and the high sensitivity – with a background noise of 0.24 ADU s-1 pixel-1, corresponding to a limiting surface brightness of 22.5 mag arcsec-2 at a 1 level, or a limiting surface brightness of 21.3 mag arcsec-2 at a 3 level – of the ISAAC observations.
3.2 The Surface-Brightness Profile
The derived J-band surface brightness profile is presented in Fig. 2 together with the PSF, as measured for a nearby star, and the limiting surface brightness. The profile is compared to the J-band data previously measured by Peletier et al. (1999). Both curves agree well, even within the FWHM of the PSF of the ISAAC observations.


The original profile and the QSO-subtracted profile of the I Zw 1 host are compared in Fig. 3. Although the subtraction method does not rely on a certain shape of the host bulge, the residual stellar component shows a flat light distribution within the error bars. An exponential disk is fitted to the calibrated and QSO-subtracted surface-brightness profile in Fig. 4 in order to model the clearly evident extended rotating disk of I Zw 1.

This fit shows that an additional bulge component is needed to describe the whole profile consistently. Bulge and disk components can be clearly distinguished, as it is typical of Freeman type I galaxies (Freeman 1970). The host belongs to the high-surface-brightness galaxies which, per definition, have a central blue disk surface brightness of mag arcsec-2 (Freeman 1970). The exponential disk of I Zw 1 has a central surface brightness of about arcsec-2 or mag arcsec-2. Assuming that the central part of the galaxy shows almost the same colours as the outer parts of the disk, this corresponds to mag arcsec-2, which is brighter than the canonical Freeman value. Here, a of for the I Zw 1 host is used as derived from the broad band spectrum in Fig. 9 of Schinnerer et al. (1998) and the colour of 0.6 to 0.7 (Hutchings & Crampton 1990). The high central disk surface brightness of the I Zw 1 host reflects the finding by Hunt et al. (1999) that exponential disks of Seyfert galaxies tend to be brighter than normal spirals. With mag arcsec-2 the I Zw 1 disk is significantly brighter than the mean B-band surface brightness of 21.44 mag arcsec-2 of normal spirals shown in Fig. 6 of Hunt et al. (1999).
3.3 The Gas Rotation Curve
The composite rotation curve, plotted in Fig. 5 together with 5 error bars, is corrected for the I Zw 1 disk inclination of under the assumption of purely circular gas motions. Gas velocities at outer radii are taken from a VLA H i map (Lim & Ho 1999). These observations have an angular resolution of about . For the inner rotation curve, gas velocities are derived from (10) maps (Schinnerer et al. 1998, Fig. 5), measured with the Plateau de Bure interferometer at angular resolutions of and . The inner slope is verified by a comparison with (10) BIMA observations taken at a higher resolution of about (Staguhn et al. 2001). The good agreement of the different observations indicates that the inner rise of the rotation curve is not yet affected by the mass concentration of the active nucleus at these resolutions. The single deviating data point corresponds to an isolated peak in the (10) position-velocity diagrams (Schinnerer et al. 1998) and is interpreted as a giant molecular cloud complex by the same authors. The deviation from the general circular velocity at this radius corresponds to a cloud orbit which is inclined by with respect to the I Zw 1 disk.

Like the surface-brightness profile, the gas rotation curve supports the classification of the I Zw 1 host as a high-surface-brightness galaxy. It shows the characteristic steep increase at the inside and slight decrease at the outside found for the universal rotation curve of high surface-brightness galaxies by Persic et al. (1996). The overall shape of the rotation curve of the I Zw 1 host is also similar to the rotation curve of the Milky Way (Sofue et al. 1999, Fig. 1) and agrees with the mean rotation curve, presented for galaxies with disk rotation velocities between 200 km s-1 and 250 km s-1 in the same article (Fig. 5). According to the authors, the central peak, the broad disk component, and the high velocities at large radii characterize the I Zw 1 host as a massive Sb or Sc galaxy. A similar classification of the I Zw 1 host as a Sc galaxy is given by Jansen et al. (2000).
3.4 Decomposition
In order to derive structural information about the underlying galaxy of the I Zw 1 QSO, the host is decomposed into contributions from bulge, disk, and dark halo components. Taking one potential model for each component, the one-dimensional decomposition has six free parameters, i.e. the scale lengths and the M/L ratios of the bulge and disk potentials as well as, where required, the scale length and mass contribution of a dark halo. The bulge and disk scale lengths which are used to model the rotation curve are derived from the distribution of luminous matter as traced by the surface brightness profile. This approach results in mean M/Ls for the bulge and disk components and is straightforward for the purpose of discussing general trends in M/L. However, the reader should be aware that M/Ls – even in the NIR – are local observables which vary due to effects of dust and stellar populations. Decompositions of the rotation curve are usually not unique (e.g. van Albada & Sancisi 1986; Bottema & Verheijen 2002) so that four different solutions will be presented and discussed. All fits are performed with an implementation of the non-linear least-squares method.
3.4.1 Potential Models
The rotation curve and the surface-brightness profile are decomposed with a Plummer model for the bulge component and a thin-disk Kuzmin model for the disk component. These models are chosen due to mathematical convenience, since both are consistently described by the Miyamoto-Nagai gravitational potential (Miyamoto & Nagai 1975)
| (4) |
where is the mass of component , and are two scale lengths, and G is the gravitational constant. The case applies to the Plummer model, the case to the Kuzmin disk. The total potential of both components is the superposition
| (5) |
where P denotes the Plummer parameters and K the Kuzmin parameters. For the rotation curve fits, another Plummer potential is added to account for a dark halo component. The circular velocities follow from
| (6) |
For Plummer and Kuzmin potentials this means explicitly
| (7) |
The corresponding total surface density is given by
| (8) |
Assuming a constant mass-to-light ratio for each component, the same formula applies to the surface brightness, if masses are substituted by luminosities.
3.4.2 Decomposition of the Surface-Brightness Profile
As the I Zw 1 host is a Freeman Type I galaxy (Sect. 3.2), its profile can best be described by a combination of bulge and disk component.

A decomposition of the J-band surface-brightness profile, consisting of the two-component model with Plummer bulge and Kuzmin disk, is shown in Fig. 6. In this decomposition, the Kuzmin model is fitted to that part of the profile where possible residua of an unclean QSO subtraction do certainly not bias the profile shape. The remaining surface brightness is ascribed to the Plummer bulge. The decomposition defines the scale lengths of bulge and disk as and , respectively, which corresponds to a bulge-to-disk scale length ratio of about 0.29. The luminosity of the bulge results in and is roughly half as large as the luminosity of the disk of .
3.4.3 Decomposition of the Gas Rotation Curve and Dynamical Mass-to-Light Ratios
Fig. 7 shows four decomposition models for the gas rotation curve of I Zw 1. Each fit is obtained under different contraints for the model components. The final parameters are listed in Table 3. The resulting is added for these cases in which the fitting procedure allows a specification.


As a cross-validation of the two-component decomposition of the surface-brightness profile, Fig. 7 a) shows a fit in which only a disk and a dark halo model are used while the bulge component is left out (disk only). The high indicates that the peak of the rotation curve at small radii cannot sufficiently be described by such a model. In order to obtain a good fit of the rotation curve with only a disk and dark-matter model, the disk scale length would have to be chosen very small (). Such a Kuzmin disk, however, does not yield a good fit of the surface-brightness profile at large radii.
Fig. 7 b) presents a maximum-disk fit (max disk) with bulge, disk, and dark halo component. The four parameters (Table 3) are determined by the following procedure: First, only the disk M/L is adjusted to the rotation curve in order to obtain a maximum contribution of the disk component. Bulge and dark halo are added in a second and third step to finetune the total velocity profile. Since the fitting is done in individual steps, it is not possible to give a general for this procedure.
The lower panels of Fig. 7 show two least-squares minima for a non-maximum-disk fit in which all four parameters (Table 3) are fitted simultaneously. In Fig. 7 c), more weight is put on the steep increase of the rotation curve at small radii by giving a lower limit of for the fitting region (free a) whereas the fit in Fig. 7 d) is confined to a region starting at (free b). The first procedure results in a disk component whose circular velocities amount to 76% of the corresponding circular velocities of the maximum disk. The second procedure yields a more massive bulge component and a dominant dark matter contribution within the disk region of the I Zw 1 host. Here, only 52% of the maximum disk circular velocities are attributed to the disk component.
4 Discussion
4.1 Distribution of Luminous Matter in the I Zw 1 Host
By comparing the decompositions of the J-band surface-brightness profile and the gas rotation curve it becomes obvious that at least two components of luminous matter – a bulge and a disk – are necessary to model the I Zw 1 host. The surface-brightness fit results in a bulge and a disk with almost equal luminosities and a bulge-to-disk scale length ratio of 0.29. This is in good agreement with the relations presented by Márquez et al. (2000) for nearby AGN spiral hosts, who found a bulge-to-disk scale length ratio of about 0.2.
4.2 Mass Distribution and M/Ls
The maximum-disk assumption (van Albada & Sancisi 1986) is often applied to have a criterion for unique rotation curve fits. Maximum-disk fits seem to provide satisfying models for Freeman type I as well as Freeman type II galaxies (Palunas & Williams 2000), although this may only be true for high-surface-brightness galaxies (de Blok & McGaugh 1997). As a high-surface-brightness galaxy of Freeman type I, the maximum-disk fit should, therefore, provide a good estimation of the M/Ls of the I Zw 1 host components. However, Bottema (1993) argues that, for realistic disk scale heights, stellar velocity dispersion only allows disk components with circular velocities of about 63% of the observed maximum velocities. Such a Bottema disk is close to the two results presented in Figs. 7 c) and 7 d) with disk components of 76% and 52% of the maximum disk. I Zw 1 is an interacting galaxy so that the observed two-armed spiral structure could be driven by the companion. However, assuming swing amplification (see Toomre 1981; Athanassoula 1984; Fuchs 2001) as the underlying mechanism for the amplification of the I Zw 1 spiral, the disk surface density at radius can be obtained from the relation
| (9) |
where is the epicyclic frequency, the gravitational constant, the number of spiral arms, and a parameter measuring the local ratio of disk mass to total mass. For the flat or slightly falling rotation curve of the I Zw 1 host, amplification is most effective at an X parameter of about 2 (Toomre 1981). For the given disk scale length of the I Zw 1 host of , the circular velocity of the Kuzmin disk peaks at where km s-1 arcsec-1 can be taken from the rotation curve. Using equation (9), the deviation of the X parameters from the X parameter of at which amplification is most efficient is plotted for various disk solutions in Fig. 8. As above, the disks are defined by their respective maximum circular velocities expressed as a percentage of the maximum disk velocity.

Fig. 8 shows that in the case of I Zw 1 amplification is most effecient for a disk. For the disks in fits max disk (100%) and free b (52%) amplification is already rather inefficient (Table 3) with X parameters of 0.9 and 3.2, respectively. Thus, the fits max disk and free b are limiting cases so that the dynamical J-band M/Ls and their errors are estimated as the mean and the deviations of both solutions, resulting in for the bulge and for the disk.
4.3 Effects of Gas Masses and Dust Extinction
The discussion so far has only concentrated on dynamical M/Ls of the I Zw 1 host components, ignoring any effects of gas contributions and dust extinction. The real stellar M/Ls, however, are certainly lower than the given values, since the mass contributed by gas has to be subtracted from the measured dynamical mass and the light absorbed by dust has to be added to the measured luminosity. With at maximum 7% of total cold gas mass (Eckart et al. 1994), the mass correction for the disk component is negligible and within the error bars. As the disk is seen nearly face-on, the extinction correction is also assumed to be low with a maximum mean J-band extinction of 0.5 mag. The effects on the M/L of the bulge are probably much stronger. With a gas fraction of 20% in the bulge (Schinnerer et al. 1998), the stellar bulge M/L amounts to 80% of the dynamical bulge M/L. The visual extinction of the stellar component in the circumnuclear region is reported to be about 10 mag (Eckart et al. 1994; Schinnerer et al. 1998, and Sect. 1), which corresponds to a J-band extinction of about 3 mag, according to the standard interstellar extinction law (Rieke & Lebofsky 1985). This is certainly an upper limit, since the high visual extinction of 10 mag is most likely confined to the starburst ring, i.e. to radii smaller than 1 kpc, while the fitted bulge model reflects mean properties of a region extending far beyond 1 kpc. Applying these corrections results in estimates about the lower limits for the M/L (Table 4).
4.4 Stellar Populations
Measured J-band M/Ls are very rarely found in literature but Palunas & Williams (2000) report bulge and disk M/Ls for a sample of 74 spirals in the I-band. For comparison, the bulge and disk M/Ls of the I Zw 1 host have to be multiplied by a factor of about 2.3, according to the host colour of roughly 0.9 mag (Schinnerer et al. 1998, Fig. 9). The M/Ls for the I Zw 1 host are similar to the majority of M/Ls found by Palunas & Williams (2000), since most of their disk M/Ls are in the range of to and most of their bulge M/Ls are significantly lower with values below .
As the M/Ls increase with increasing age of the underlying stellar population, the derived M/Ls for the I Zw 1 host can be used to estimate the mean stellar population in the disk and the bulge component. The derived M/L of the disk of is slightly sub-solar. It indicates a predominance of normal stars with a tendency towards a slightly increased fraction of younger stars. Such a tendency could be explained by the enhanced star formation activity found for the north-western spiral arm (Schinnerer et al. 1998). The M/L of the bulge of is much lower and hints at a young stellar population with a significant fraction of hot stars and supergiants. Such an interpretation is supported by the finding of strong starburst activity in the circumnuclear region of I Zw 1 (Schinnerer et al. 1998; Staguhn et al. 2001).
5 Summary and Conclusions
As a nearby QSO, yet showing many properties of high-redshift counterparts, and as a likely transition object in the original evolutionary scheme for AGN, I Zw 1 is a very interesting candidate for a detailed case study of a QSO host. This paper presents new results from J-band imaging of the I Zw 1 host with ISAAC at the VLT – the first investigations in a series, turning I Zw 1 into one of the best-studied QSO hosts.
The analysis shown here provides first-time results focussing on the structure of the underlying host galaxy of I Zw 1, since the host is uncovered by a reliable subtraction of the QSO nucleus from the J-band images. By the structural decomposition of the surface brightness profile and the gas rotation curve the host is characterized as a Freeman-type-I high surface brightness galaxy. It is shown that the radial distribution of luminous matter is similar to that found for nearby AGN spiral hosts. Different solutions for the decomposition of the rotation curve are discussed assuming swing amplification as the prevailing mechanism for the amplification the two-armed spiral structure in the I Zw 1 disk. The resulting M/Ls indicate a tendency towards a younger stellar population in the disk and a predominance of young hot stars and supergiants in the bulge. This interpretation aims at the same direction as previous findings about enhanced star formation in the north-western spiral arm and strong starburst activity in the circumnuclear molecular ring of I Zw 1. New evidence for a tidal interaction between I Zw 1 and the nearby western companion galaxy is found in the sensitive high-resolution ISAAC J-band image, which shows an elongation of the companion as well as a tidal bridge and tail. Without a large-scale bar in the I Zw 1 host, this interaction seems to be the major mechanism for triggering the inflow of gas which is needed to fuel the circumnuclear starburst as well as the QSO. The anticipated merger process would be a further argument for I Zw 1 to be a transitional object in the original evolutionary scheme.
Acknowledgements.
We would like to thank the observer who carried out the VLT observations in service mode. We also thank Prof. Dr B. Fuchs for helpful comments and suggestions. J. Scharwächter is supported by a scholarship for doctoral students of the “Studienstiftung des deutschen Volkes”.References
- Athanassoula (1984) Athanassoula, E. 1984, Phys. Rep, 114, 321
- Bahcall et al. (1995) Bahcall, J. N., Kirhakos, S., & Schneider, D. P. 1995, ApJ, 450, 486
- Barvainis et al. (1989) Barvainis, R., Alloin, D., & Antonucci, R. 1989, ApJ, 337, L69
- Barvainis & Antonucci (1989) Barvainis, R. & Antonucci, R. 1989, ApJS, 70, 257
- Beckwith et al. (1976) Beckwith, S., Evans, N. J., Becklin, E. E., & Neugebauer, G. 1976, ApJ, 208, 390
- Binney & Merrifield (1998) Binney, J. & Merrifield, M. 1998, Galactic astronomy (Galactic astronomy / James Binney and Michael Merrifield. Princeton, NJ : Princeton University Press, 1998. (Princeton series in astrophysics) QB857 .B522 1998 ($35.00))
- Boller et al. (1996) Boller, T., Brandt, W. N., & Fink, H. 1996, A&A, 305, 53
- Bothun et al. (1984) Bothun, G. D., Heckman, T. M., Schommer, R. A., & Balick, B. 1984, AJ, 89, 1293
- Bottema (1993) Bottema, R. 1993, A&A, 275, 16
- Bottema & Verheijen (2002) Bottema, R. & Verheijen, M. A. W. 2002, A&A, 388, 793
- Buson & Ulrich (1990) Buson, L. M. & Ulrich, M.-H. 1990, A&A, 240, 247
- Canalizo & Stockton (2001) Canalizo, G. & Stockton, A. 2001, ApJ, 555, 719
- Condon et al. (1985) Condon, J. J., Hutchings, J. B., & Gower, A. C. 1985, AJ, 90, 1642
- de Blok & McGaugh (1997) de Blok, W. J. G. & McGaugh, S. S. 1997, MNRAS, 290, 533
- Eckart et al. (1994) Eckart, A., van der Werf, P. P., Hofmann, R., & Harris, A. I. 1994, ApJ, 424, 627
- Evans et al. (2001) Evans, A. S., Frayer, D. T., Surace, J. A., & Sanders, D. B. 2001, AJ, 121, 1893
- Falco et al. (1999) Falco, E. E., Kurtz, M. J., Geller, M. J., et al. 1999, PASP, 111, 438
- Freeman (1970) Freeman, K. C. 1970, ApJ, 160, 811
- Fuchs (2001) Fuchs, B. 2001, A&A, 368, 107
- Hawarden et al. (2001) Hawarden, T. G., Leggett, S. K., Letawsky, M. B., Ballantyne, D. R., & Casali, M. M. 2001, MNRAS, 325, 563
- Hunt et al. (1999) Hunt, L. K., Malkan, M. A., Moriondo, G., & Salvati, M. 1999, ApJ, 510, 637
- Hutchings & Crampton (1990) Hutchings, J. B. & Crampton, D. 1990, AJ, 99, 37
- Hyland & Allen (1982) Hyland, A. R. & Allen, D. A. 1982, MNRAS, 199, 943
- Jansen et al. (2000) Jansen, R. A., Franx, M., Fabricant, D., & Caldwell, N. 2000, ApJS, 126, 271
- Kukula et al. (1995) Kukula, M. J., Pedlar, A., Baum, S. A., & O’Dea, C. P. 1995, MNRAS, 276, 1262
- Lim & Ho (1999) Lim, J. & Ho, P. T. P. 1999, ApJ, 510, L7
- Lowenthal et al. (1995) Lowenthal, J. D., Heckman, T. M., Lehnert, M. D., & Elias, J. H. 1995, ApJ, 439, 588
- Márquez et al. (2000) Márquez, I., Durret, F., Masegosa, J., et al. 2000, A&A, 360, 431
- McLeod (1995) McLeod, K. K. 1995, PASP, 107, 91
- Miyamoto & Nagai (1975) Miyamoto, M. & Nagai, R. 1975, PASJ, 27, 533
- Oke & Lauer (1979) Oke, J. B. & Lauer, T. R. 1979, ApJ, 230, 360
- Palunas & Williams (2000) Palunas, P. & Williams, T. B. 2000, AJ, 120, 2884
- Peletier et al. (1999) Peletier, R. F., Knapen, J. H., Shlosman, I., et al. 1999, ApJS, 125, 363
- Percival et al. (2001) Percival, W. J., Miller, L., McLure, R. J., & Dunlop, J. S. 2001, MNRAS, 322, 843
- Persic et al. (1996) Persic, M., Salucci, P., & Stel, F. 1996, MNRAS, 281, 27
- Persson et al. (1998) Persson, S. E., Murphy, D. C., Krzeminski, W., Roth, M., & Rieke, M. J. 1998, AJ, 116, 2475
- Pogge & Martini (2002) Pogge, R. W. & Martini, P. 2002, ApJ, 569, 624
- Rieke & Lebofsky (1985) Rieke, G. H. & Lebofsky, M. J. 1985, ApJ, 288, 618
- Sanders et al. (1988) Sanders, D. B., Soifer, B. T., Elias, J. H., et al. 1988, ApJ, 325, 74
- Schinnerer et al. (1998) Schinnerer, E., Eckart, A., & Tacconi, L. J. 1998, ApJ, 500, 147
- Shlosman et al. (1990) Shlosman, I., Begelman, M. C., & Frank, J. 1990, Nature, 345, 679
- Smith et al. (1986) Smith, E. P., Heckman, T. M., Bothun, G. D., Romanishin, W., & Balick, B. 1986, ApJ, 306, 64
- Sofue et al. (1999) Sofue, Y., Tutui, Y., Honma, M., et al. 1999, ApJ, 523, 136
- Solomon et al. (1997) Solomon, P. M., Downes, D., Radford, S. J. E., & Barrett, J. W. 1997, ApJ, 478, 144
- Staguhn et al. (2001) Staguhn, J., Schinnerer, E., & Eckart, A. 2001, in IAU Symposium, Vol. 205, 340–+
- Storchi-Bergmann et al. (2001) Storchi-Bergmann, T., González Delgado, R. M., Schmitt, H. R., Cid Fernandes, R., & Heckman, T. 2001, ApJ, 559, 147
- Toomre (1981) Toomre, A. 1981, in Structure and Evolution of Normal Galaxies, 111–136
- van Albada & Sancisi (1986) van Albada, T. S. & Sancisi, R. 1986, Royal Society of London Philosophical Transactions Series A, 320, 447
- Veron-Cetty & Veron (1998) Veron-Cetty, M. P. & Veron, P. 1998, VizieR Online Data Catalog, 7207, 0
- Vestergaard & Wilkes (2001) Vestergaard, M. & Wilkes, B. J. 2001, ApJS, 134, 1