A universal radio:X–ray correlation in low/hard state black hole binaries
Abstract
Several independent lines of evidence now point to a connection between the physical processes that govern radio (i.e. jet) and X–ray emission from accreting X–ray binaries. We present a comprehensive study of (quasi–)simultaneous radio:X–ray observations of stellar black hole binaries during the spectrally hard X–ray state, finding evidence for a strong correlation between these two bands over more than three orders of magnitude in X–ray luminosity. The correlation extends from the quiescent regime up to close to the soft state transition, where radio emission starts to decline, sometimes below detectable levels, probably corresponding to the physical disappearance of the jet. The X–ray transient V 404 Cygni is found to display the same functional relationship already reported for GX 339–4 between radio and X–ray flux, namely . In fact the data for all low/hard state black holes is consistent with a universal relation between the radio and X–ray luminosity of the form . Under the hypothesis of common physics driving the disc–jet coupling in different sources, the observed spread to the best–fit relation can be interpreted in terms of a distribution in Doppler factors and hence used to constrain the bulk Lorentz factors of both the radio and X–ray emitting regions. Monte Carlo simulations show that, assuming little or no X–ray beaming, the measured scatter in radio power is consistent with Lorentz factors for the outflows in the low/hard state, significantly less relativistic than the jets associated with X–ray transients. When combined radio and X–ray beaming is considered, the range of possible jet bulk velocities significantly broadens, allowing highly relativistic outflows, but implying therefore severe X–ray selection effects. If the radio luminosity scales as the total jet power raised to , then there exists an X–ray luminosity below which most of the accretion power will be channelled into the jet, rather than in the X–rays. For , as in several optically thick jet models, the power output of ‘quiescent’ black holes may be jet–dominated below .
keywords:
Accretion, accretion discs – Binaries: general – ISM: jets and outflows – Radio continuum: stars – X–rays: stars1 Introduction
There is strong observational evidence for the fact that
powerful radio–emitting outflows form a key part of the accretion
behaviour in some states of X–ray binary systems.
Due to its high brightness temperature, ‘nonthermal’ spectrum and, in some
cases, high degree of polarisation, radio emission from black hole binaries is
believed to originate in
synchrotron radiation from relativistic electrons ejected by the system with
large bulk velocities (Hjellming & Han 1995; Mirabel & Rodríguez 1999;
Fender, 2000, 2001a,b,c).
Black hole binary systems are traditionally classified by their X–ray
features (see Nowak 1995; Poutanen 1998; Done 2001; Merloni
2002 for recent reviews), namely: a) the relative strength of a soft ‘black
body’ component around 1 keV, b) the
spectral hardness at higher energies c) X–ray luminosity and
d) timing properties. Different radio behaviour is associated with
several ‘X–ray states’, according to the following broad scheme.
The low/hard state is dominated by a power–law spectrum,
with a relatively low luminosity and an exponential cut–off
above about 100 keV and little or no evidence for a soft,
thermal component.
It is associated with a steady, self–absorbed
outflow that emits synchrotron radiation in the radio
(and probably infrared) spectrum.
The quiescent/off state, characterised by an extremely low X–ray flux,
may simply be interpreted as the hard state ‘turned down’
to lower accretion rates and radiative efficiency.
X–ray spectra from high/soft state
Black Hole Candidates (BHCs) are instead dominated by thermal radiation, while
the core radio emission drops
below detectable levels, probably corresponding to the physical suppression
of the jet. In the very high state both the thermal and the
power law components contribute substantially to the spectral energy
distribution. At a lower luminosity level an intermediate state is also
observed, with
properties similar to those of the very high state. For both the very high and
the intermediate state the connection with radio behaviour is not yet
clearly established. Corbel et al. (2001) show that the radio emission
from XTE 1550–564 in the intermediate state was suppressed by a factor
with respect to the hard
state, while Homan et al. (2001) claim that intermediate and very high states can actually
occur at a wide range of luminosities.
Transitions between
states are often associated with multiple ejections of synchrotron emitting
material, possibly with high bulk Lorentz factors (Hjellming & Han 1995;
Kuulkers et al. 1999; Fender & Kuulkers 2001).
As already mentioned, BHCs in the low/hard state,
like Cygnus X–1 and GX 339–4, are characterised by a
flat or slightly inverted radio spectrum (), interpreted as arising from
a collimated, self–absorbed compact jet, in analogy to those observed in
active galactic nuclei (Blandford & Königl 1979). With the direct imaging
of a resolved compact radio jet from
the core of Cygnus X–1 (Stirling et al. 2001), this association has been
confirmed. Radio emission from X–ray binaries, especially the
BHCs, is increasingly interpreted as the
radiative signature of jet–like outflows.
It has been generally accepted that the soft thermal component of BH spectra
originates in an optically thick, geometrically thin accretion disc (Shakura
& Sunyaev 1973), whereas the power law component
is produced by Comptonisation of ‘seed’ photons in a hot, rarefied ‘corona’ of
(quasi–) thermal electrons (Shapiro, Lightman & Eardley 1976; Sunyaev &
Titarchuk 1980; Haardt & Maraschi 1991; Poutanen & Svensson 1996).
Although this picture can successfully reproduce the X–ray behaviour, it can
not yet address the clear correlation between radio and X–ray
emission established for the persistent BHCs GX 339–4 and Cygnus X–1
while in the hard state (Hannikainen et al. 1998; Brocksopp et al. 1999; Corbel
et al. 2000; Corbel et al. 2003). Moreover, some hard state sources, like XTE
J1118+480 and GX 339–4, show evidence for a
turnover in the infrared–optical band, where the flat–to–inverted radio
spectrum seems to connect to an optically thin component extending up to the
X–rays (Corbel & Fender 2002; Markoff et al. 2003a,b and references therein),
suggesting again that the jet plays a role at higher frequencies.
Hence, all the evidence points to the corona in these systems being physically
related to the presence of a jet: by far the simplest interpretation therefore
is that the Comptonising region is just the base of the relativistic outflow
(Fender et al. 1999b; Merloni & Fabian 2002; Markoff et al. 2003a).
However, joining these two previously independent scenarios is somewhat
problematic because they often require different electron distributions and
geometries.
Due to the fast timescales in X–ray binary systems,
only simultaneous radio and X–ray observations provide the necessary tools to
probe this conjecture.
The following results extend and complete those presented in
Gallo, Fender & Pooley (2002).
| Source | Distance(ref) | Inclination(12) | BH mass(12) | NH(ref) | Data |
|---|---|---|---|---|---|
| (kpc) | (degree) | () | (1021cm-2) | ||
| Cygnus X–1 | 2.1 (1) | 355 | 6.85–13.25 | 6.2 (16) | – |
| V 404 Cygni | 3.5 (2) | 564 | 10.06–13.38 | 5.0 (17) | 21,22 |
| GRS 1758–258 | 8.5 (3) | ? | 8–9 (14) | 14.0 (3) | 23 |
| XTE J1118+480 | 1.8 (4) | 812 | 6.48–7.19 | 0.1 (18) | 24,25 |
| GRO J0422+32 | 2.4 (5) | 442 | 3.66–4.97 | 2.0 (5) | 24 |
| GX 339–4 | 4.0 (6) | 15–60 (13) | 5.80.5 (15) | 6.0 (6) | 26 |
| 1E 1740.7–2942 | 8.5 (7) | ? | ? | 118 (19) | 27 |
| XTE J1550–564 | 4.0 (8,9∗) | 725 | 8.36–10.76 | 8.5 (20) | 20,28 |
| GS 1354–64 | 10.0 (10) | ? | ? | 32.0 (9) | 29 |
| 4U 1543–47 | 9.0 (11) | 20.71.5 | 8.45–10.39 | 3.5 (11) | 30 |
2 The sample

Our aim was to compile (quasi–)simultaneous radio and X–ray
observations
of BHCs during the low/hard state. To this purpose,
we have collected all the available (to our
knowlege) data from the
literature and made use of our own simultaneous observations as well.
These were
taken with the Ryle telescope at 15 GHz (see
Pooley & Fender 1997 for more details) and combined with one–day averages
from RXTE ASM (this refers to Cygnus X–1, Cygnus X–3 and
GRS 1915+105).
Table 1 lists the information for the ten low/hard state BHCs for which we have
at our disposal (quasi–)simultaneous radio and X–ray coverage (see
Section 5, Table 3 for ‘non–canonical’ hard state
sources, such as Cygnus X–3 and GRS 1915+105):
distance, mass, orbital inclination, measured hydrogen column densities (see Section 2.1) and
literature references.
Both the X–ray and the radio intensity values come from several different
instruments and telescopes. Radio flux densities have been measured in
different
frequency bands, ranging from 4.9 up to 15 GHz; nevertheless we generically
refer
to ‘radio flux densities’ based on the evidence that, while in the low/hard
state, black hole radio spectra are characterised by almost flat spectra () spectral index (Fender 2001a).
X–ray fluxes, taken either from spectral fits or from light curves, have been
converted into Crab units in order to be
easly compared with radio flux density units (1 Crab 1060 Jy;
energy range 2–11 keV). For this purpose, X–ray fluxes/luminosities in a
given range have been first converted into corresponding values between 2–11
keV, and then expressed as flux density.
For those sources whose X–ray flux
has been derived from count rates, the conversion into Crab has been
performed according to the factors provided by Brocksopp, Bandyopadhyay &
Fender (2003).
2.1 Absorption corrections
Whenever X–ray flux density has been evaluated from count rates or absorbed fluxes, we wanted to compensate for absorption by calculating the ratio between the predicted flux from a hard state BH with a measured value, and the predicted flux corresponding to no absorption, as follows. We have first simulated with XSPEC typical spectra of hard state BHCs as observed by Chandra ACIS for ten diffent values of hydrogen column density ranging from zero up to 12.5 cm-2. A ‘typical’ spectrally hard BH’s spectrum is well fitted by an absorbed power law with photon index 1.5. By keeping fixed the flux corresponding to no absorption, the points turn out to be well fitted by a simple exponential relation, which allows to express the ratio as follows:
| (1) |
The procedure described has been applied to X–ray fluxes below the transition luminosity between hard and soft state (see Section 3.2). Above that value, the spectrum is not reproduced by a simple power law. In this regime, the X–ray spectrum is usually well fitted by an absorbed power law with photon index plus a disc blackbody component, with a typical temperature of around 1 keV. Since in this case the 2–11 keV spectrum is almost entirely dominated by thermal emission, the previous simulations have been repeated for soft state BHCs by approximating the spectrum with a disc blackbody emission at 1 keV. We have obtained:
| (2) |
The latter correction has been applied to detections above the
hard–to–soft state transition.
3 Radio vs. X–ray flux densities
3.1 GX 339–4 and V 404 Cygni
In Figure 1 we plot radio against X–ray flux
densities
(mJy vs.Crab), scaled to a distance of 1 kpc and absorption corrected, for GX 339–4
and V 404 Cygni, the two sources for which we have at our disposal the widest
coverage in terms of X–ray luminosity.
,
GX 339–4 was discovered as a radio source by Sood & Campbell–Wilson (1994). When in the low/hard state, it is characterised by a flat or slightly inverted () radio spectrum (see Corbel et al. 2000) and its synchrotron power has been shown to correlate with soft and hard X–ray fluxes (Hannikainen et al. 1998; Corbel et al. 2000). By means of simultaneous radio:X–ray obsevations of GX 339–4, Corbel et al. (2003) have recently found extremely interesting correlations between these two bands: in particular, (slightly different slopes – within the hard state – have been found depending on the X–ray energy interval). When fitted in mJy vs. Crab (scaled to 1 kpc and absorption corrected), the relation displays the form:
| (3) | |||
The correlation appears to hold over a
period of three years – 1997 and between 1999–2000 – during which the source
remained almost constantly in a spectral hard state (with a transition to the
high/soft state, Belloni et al. 1999, when the radio emission declined
below detectable levels).
Figure 1 shows radio against X–ray flux densities of GX 339–4
corresponding to simultaneous ATCA/RXTE observations performed between 1997 and
2000 (Corbel et al. 2000, 2003). Note that points above 1 Crab
(scaled), which all correspond to RXTE–ASM detections, clearly show a
sharp decreasing in the radio power (see next Section).
The correlation reported by Corbel et al. (2003)
actually refers to RXTE–PCA data only; it is worth mentioning that,
when ASM detections below 1 Crab (i.e. below the radio quenching) are
fitted together with PCA points, the final result is consistent, within the
errors, with the fit reported by Corbel on PCA data alone (that is, a slope
of 0.700.06 is obtained in this case).
Remarkably, we have found that detections of V 404 Cygni,
the source for which we have at our disposal the
widest radio:X–ray coverage,
are well fitted by the same functional relationship – albeit with no
apparent cutoff – as GX 339–4 (see
Figure 1).
V 404 Cygni belongs to the class of X–ray transients, sources
undergoing brief episodic outbursts
during which their luminosity can increase by
a factor compared to periods of relative quiescence.
All V 404 Cygni data – except for the quiescent lowest point –
come from simultaneous radio (VLA; Han & Hjellming
1992) and X–ray (Ginga; Kitamoto et al. 1990)
observations during the decay following
its May 1989 outburst, during which the
source, despite very high and apparently saturated luminosity, never entered
a spectral soft state and always maintained a very hard X–ray spectrum
(Zycki, Done & Smith 1999).
According to Hjellming et al. (2000), the quiescent state of V 404 Cygni, since it
ended the long decay after its 1989 outburst, has been associated with a 0.4
mJy radio source111Starting in early 1999, VLA obervations showed
fluctuations ranging from 0.1 to 0.8 mJy on time scales of days; even more
extreme radio fluctuations in February 2000 were accompained by strong
variability in the X–ray band as well (Hjellming et al. 2000)..
Quiescent X–ray flux refers to a 1992
measurement (Wagner et al. 1994 report 0.0240.001 count/sec with
ROSAT–PSPC), i.e. well before the onset of significant X–ray variability
(see Kong et al. 2002 for details).
Denoting
Sradio as the radio flux density in mJy and
as the X–ray flux density in Crab, we have obtained:
| (4) | |||
The Spearman’s rank correlation coefficient is 0.91; the two sided significance
of its deviation from zero equals 4.2 .
These results
indicate that is a fundamental
property of the radio:X–ray coupling in the hard state, rather than a
peculiarity of GX 339–4. It is worth stressing that the fitted slopes
for V 404 Cygni and GX 339–4 are identical within the errors, with the same
normalisations within a factor 2.5, while detections from other sources below
1 Crab (scaled),
although much narrower luminosity ranges, are all consistent with the same
placing in the radio:X–ray plane, as discussed in the next Section.
3.2 Broad properties of the correlation
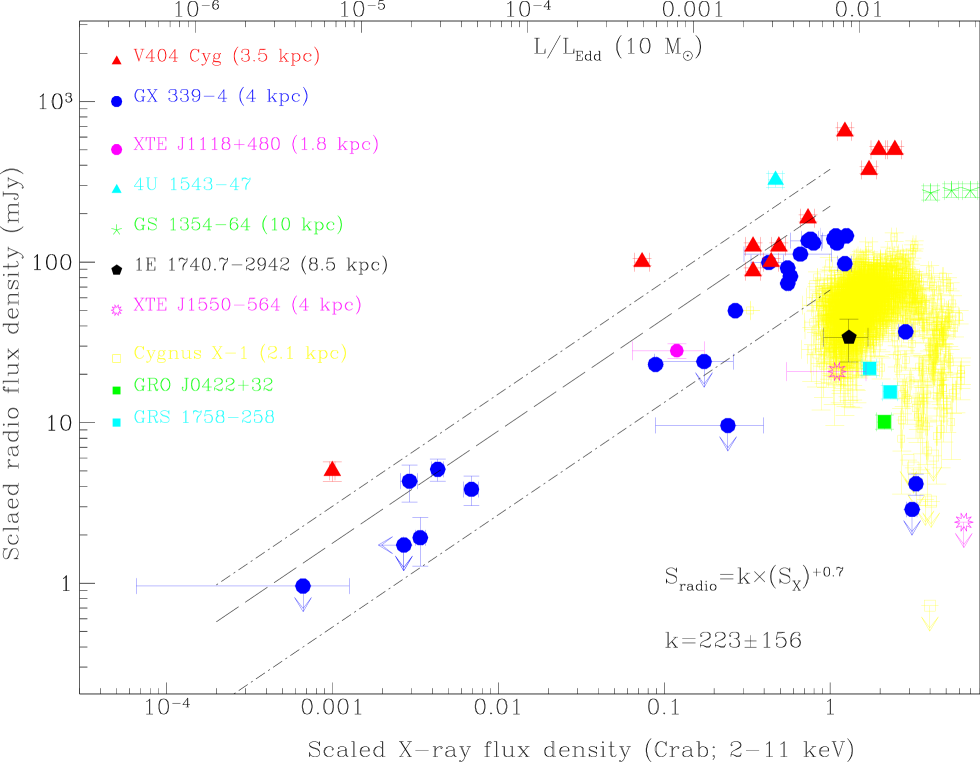
In Figure 2 we plot radio flux densities (mJy) against X–ray fluxes
(Crab), scaled to a distance of 1 kpc and absorption corrected, for all the
ten hard state BHCs listed in Table 1. Note that this scaling and correction
means that the axes are proportional to luminosities.
Besides GX 339–4, Cygnus X–1 displays a positive
correlation followed by a radio turnover around 3 Crab, whereas
three other sources, namely XTE
J1118+480, 4U 1543–47 and GS 1354–64, lie very close to the relations inferred
for GX 339–4 and V 404 Cygni. The remaining four systems (GRS 1758–258, GRO
J0422+32, 1E 1740.7–2942 and XTE J1550–564) seem instead to have already
undergone the radio quenching.
We can assert that these ten BH candidates display very similar
behaviour in the vs. plane.
There is evidence for a positive radio:X–ray correlation over more than
three orders of magnitude in terms of Eddington luminosity, as indicated in the
top horizontal axis, where we show the ratio corresponding
to the underlying X–ray flux ( erg/sec for a 10 BH).
As an example, the total luminosity
of Cygnus X–1 in the 0.1 to 200 keV band, while the source is
in the low/hard state, is of the Eddington luminosity for a 10 BH (di Salvo et al. 2001); that corresponds to mean flux of about 2.5 Crab
(scaled to 1 kpc).
3.3 Jet suppression in the soft state

As already mentioned, approaching the soft state radio
emission from
BHCs seems to be quenched below detectable levels. Such a behaviour is well
recognizable in at least two sources of our sample. As visible in Figure
2, both Cygnus X–1 and GX 339–4
display a clear turnover after
which the radio power dramatically declines and reaches undetectable
levels within a factor of two in X–ray flux (see also Fender et al. 1999b). In
addition, XTE J1550–564,
although suffering from poor statistics and large uncertainty in distance
estimates (2.5–6 kpc),
has been detected during the hard state (Corbel
et al. 2001; Tomsick et al. 2001) at ‘half–quenched’ level (about 1 Crab:20
mJy scaled) while the radio emission dropped down significantly
in the intermediate/very high state (about 6 Crab:0.15 mJy
scaled).
The values of the X–ray flux density (scaled) corresponding to the turnover in radio
flux vary between the sources: GX 339–4, about 1 Crab; Cygnus X–1,
about 3 Crab; V 404 Cygni 1 Crab.
This difference could be related to differences between the
parameters that govern the powering/quenching mechanism(s)
of the radio emitting jet. A discriminant parameter might be the BH
mass, which is estimated to be 10 in the case of Cygnus X–1 while it
has been recently constrained around 6 in the case
of GX 339–4 (Hynes et al. 2003). If this
hypothesis is correct, we would expect not to see jet
quenching at X–ray luminosities below the Cygnus X–1 turnover for those systems
whose BH mass has been estimated to be bigger than 10 , as, for instance,
the case of V 404 Cygni, which does not appear to be quenched in radio up to
about 3 Crab, and is known to possess a 10–14 BH (Orosz 2002, Hjellming et al. 2000).
Despite the poor statistics, this picture seems to
bear out the hypothesis that the X–ray luminosity at the radio quenching
might positively correlate with the BH mass, being consistent with the jet suppression
occurring at a constant fraction – a few percent – of the Eddington rate.
This is explored further in Gallo, Migliari & Fender (in preparation).
In Figure 3 the quenching of the radio power in Cygnus X–1
(monitored simultaneously in radio and X–ray between January 1996 and January
2003) as a function of the X–ray flux density is shown together with
X–ray hardness ratios.
The 3–12 keV X–ray spectrum softens until about 5 Crab (scaled), whereas
radio quenching begins around 3 Crab (scaled).
While it is clear that the
quenching occurs somewhere near the point of transition from low/hard to softer
(intermediate or high/soft) states, pointed observations will be required to
see exactly what is happening to the X–ray spectrum at the quenching point.
4 Spread to the correlation
4.1 Best–fitting
So far we have established two main points by looking at the distribution of low/hard state BH binaries in the radio vs. X–ray flux density plane:
-
•
Independently of the physical interpretation, for GX 339–4 and V 404 Cygni from quiescence up to close to the hard–to–soft state transition. All other hard state BHCs lie very close to these correlations, with similar normalisations.
-
•
At a luminosity of a few percent of the Eddington rate, close to the hard–to–soft state transition, a sharp turnover is observed in the radio:X–ray relation, that is, the radio flux density drops below detectable levels.
Bearing this in mind, our purpose is now trying to find a
reliable expression for a ‘best–fit’ relationship to all hard state BHs and
to estimate the spread relative to such a relation.
Assuming 0.7 as a universal slope during the low/hard state,
we have determined the normalisation factor by fitting all the data – Cygnus
X–1 excluded (see comments at the end of this Section) –
up to 1 Crab, below which quenching does not occur for any system.
In this way we are able to provide an empirical relationship valid for all the
hard state BHs, that we will call
‘best–fit’ in the following. We have obtained:
| (5) |
The best–fit and its spread are indicated in
Figure 2 in dashed and dot–dashed lines
respectively.
A scatter of about one order of magnitude in radio power
is particularly interesting, especially in view of comparing the observed
spread to the one we expect based on beaming effects (see next
Section).
The choice of excluding the whole dataset of Cygnus X–1
is related to its unusual behaviour in the
radio:X–ray flux plane. In fact, a visual inspection of Figure 2
already suggested that the points below the radio power quenching belong to a
line with a steeper slope than 0.7. In addition, despite its relatively low
inclination to the line of sight (see next Section for clarity), Cygnus X–1
lies on the lower side of the correlation. It is possible that these
characteristics can be explained in terms of strong wind absorption.
It has been demonstrated that the wind from the donor OB star in Cygnus X–1
partially absorbs the radio
emission, up to about 10 (Pooley, Fender & Brocksopp, 1999; Brocksopp,
Fender & Pooley, 2002). In addition, since the jet bulk velocity during
hard state is likely to be relatively low (see Section 4.3), approaching and
receding jets contribute a similar amount to the total radio luminosity.
However, in Cygnus X–1 only a one–sided jet has been detected (Stirling
et al. 2001); this means that, possibly, a significant fraction of the
receding jet is lost through wind absorption (however, since the jet structure
is about 100 times bigger than the orbit, it is unlikely that the wind could
absorb the entire power of the receding component).
Furthermore, because the flat–spectrum radio emission (corresponding to steady
jet and generally associated
with hard X–ray spectrum) is optically thick, this
implies that when the jet power decreases, its size might also decreases
linearly with flux. As the jet in Cygnus X–1 becomes smaller,
the : relation will be subject to increasingly strong
wind absorption, with the net result of steepening the correlation.
4.2 Constraining the Doppler factors
What kind of physical information can we deduce from the observed relation?
Let us assume a very simple model, in which the same physics and
jet/corona coupling hold for all hard state BHs and the observed functional
relationship is intrinsic; then,
one would predict the following
placing in the vs. parameter space:
-
1.
All sources lying on a line with the same slope if neither X–ray or radio emission were significantly beamed (i.e. low Doppler factors).
-
2.
Different sources lying on lines with the same slope but different normalisations if X–rays were isotropic while radio was beamed, with radio–brighter sources corresponding to higher Doppler factors.
-
3.
As point (ii) but with higher Doppler factors sources being brighter in both radio and X–ray if both were beamed.
Despite the relatively small sample, we are able to place some
constraints on these possibilities.
In the first two scenarios, where
X–rays are isotropically emitted while radio power is beamed, we can express
the observed radio luminosity as the product of
the intrinsic (rest–frame) radio power times the effective Doppler
factor , defined as a
function of approaching and receding
Doppler factors222, where:
;
, is the bulk velocity
of the radio–emitting material;
;
is the inclination respect to
the line of sight..
If for all hard
state BHCs, we can write:
| (6) |
Assuming the same coupling for all sources – that means same
normalisation N – the ratio
between the observed radio powers from source 1 and
2, at a fixed X–ray luminosity, will correspond to the ratio between their
relative effective Doppler factors.
Returning to the case of V 404 Cygni and GX 339–4, where
, we are drawn to the
conclusion that GX
339–4, whose inclination is poorly constrained
between 60∘ (Cowley et al. 2002), is likely to be located at a higher inclination than V 404 Cyg,
well established to lie at ∘ (Shahbaz et al. 1994). In fact,
assuming that , a ratio can be achieved only if .
Clearly, the previous
arguments are based on the assumption that the binary system
inclination to the line of sight coincides with the inclination of the jet,
while recent findings (Maccarone 2002) show that this is
not always the case (the misalignment
of the disc and the jet has been already observed in Galactic jet sources GRO
J1655–40 and SAX J1819–2525).
A recent
work by Hynes et al. (2003) shows dynamical evidence for GX 339–4
being a binary system hosting a BH with mass
. Interestingly, based on the spectroscopic analysis by Cowley et al. (2002), see their Figure 8, this value is also
consistent with a high inclination of the system to the line of sight.
4.2.1 Monte Carlo simulations I: radio beaming

In order to link the measured scatter in the radio:X–ray relation to the beaming effects, and possibly constraining the Doppler factors, we have performed Monte Carlo simulations according to the following scheme.
| Source | Inclination | Number of |
|---|---|---|
| (degree) | detections () | |
| V 404 Cygni | 564a | 7 |
| XTE J1118+480 | 812a | 1∗ |
| 4U 1543–47 | 20.71.5a | 1 |
| GX 339–4 | 15–60b | 14 |
We have considered the four sources (see Table 2) whose
radio:X–ray flux densities have been utilised to obtain the best–fit
relationship below 1 Crab; for each of them we have at
our disposal a number of simultaneous detections, with a total number
of points
. For each source , a random inclination
within the measured range has been generated and associated to an array whose
dimension equals the number of detections , for a total of 23 random
inclinations.
Then, for 15 different
values of the outflow bulk velocity , the
corresponding
Doppler factors have been calculated by running the
simulation times (i.e. for total of values for each
) .
After estimating the mean Doppler factor and its relative
standard
deviations () for each value of , we have compared the
simulated spread (defined
as the ratio to the measured spread in
normalisation, that is .
The result is
shown in Figure 4: in order to keep the spread in Doppler factor
equal/smaller 333
Smaller than measured spread are also ‘allowed’ on the ground that
errors in the distance estimates are likely to influence the observed
distribution, causing an additional source of scatter to the relation,
which is of course not related to any boosting effect.
than observed (actually ), the bulk velocity of the
radio–emitting material must be lower than , that is the Lorentz
factor must be smaller than 1.7.
These remarks are of course valid under the basic assumptions
that no beaming is affecting the X–rays.
In addition we are considering a simple model in
which both the bulk velocities and opening angles of the jets are
constant (only under the latter assumption the probability of observing a
source with a given inclination is uniformly distributed in
cos ).
For comparison, we ran the simulation allowing the inclination angles to vary
between 0–90∘ (filled circles in Figure 4); this is actually
crucial in the light of what has been
discussed by Maccarone (2002) about jet–disc misalignment in BH binaries, and
also takes into account possible model–dependent errors in the estimation of
. The simulated spread in Doppler factors starts to
significantly deviate
from the previous one (calculated allowing the inclination angles for each
source to vary within the measured values; open circles in
Figure 4) only for very high bulk
velocities. As expected, even if inclinations
as 0 and 90∘ (i.e. those inclinations
which translate into the highest and lowest possible values of cosine,
respectively) are also taken into account,
this strongly influences the mean Doppler factor only for really high values of
.
4.2.2 Monte Carlo simulations II: adding beamed X–rays

Following a similar approach, it is possible to constrain the Doppler factor due to the combination of beamed radio and X–ray radiation. As before, we assume 0.7 as an intrinsic slope which relates radio and X–ray emission. Supposing that both X–rays and radio are beamed, we will write:
| (7) |
Note that the effective Doppler factor for the X–ray radiation will be
defined as
(assuming continuous ejection
and photon index 1.5 for low/hard state; see Mirabel &
Rodríguez 1994, equations 8, 9).
Therefore, Monte Carlo simulations have been
run by varying both radio and X–ray bulk velocities with logarithmic steps
in Lorentz factors, and , between 1 and 30.
The mean values of together with
their standard deviations and spreads have been calculated for any combination of
the two factors. The results are shown in Figure 5.
Filled bold circles indicate those combinations of and
for which the simulated spread with inclinations varying between 0–90∘ is smaller than/equal to 0.77.
Filled PLUS open circles, instead, correspond to ‘allowed’ combinations when the
inclination to the line of sight varies within the measured ranges.
In order to see why the beaming of both wavebands
allows a wider spread of , consider the effect
on the position of a source in the flux–flux diagram:
a Doppler–boosted, or deboosted, radio source moves parallel to
the axis, while a source boosted or deboosted in both wavebands
moves roughly (not exactly) parallel to the line ,
and therefore roughly along the direction of the observed correlation.
Consequently beaming in both wavebands disturbs the correlation less.
However, if X–rays were really highly beamed, that
would imply strong X–ray selection effects in detecting BH binaries.
Clearly, a possible independent estimation of
the bulk velocity of the X–ray emitting material (e.g. Beloborodov 1999; Maccarone
2003) would naturally allow a much narrower constraint on the Doppler factor of
the radio–emitting material (see discussion for further details).
5 Beyond the hard–to–soft state transition

Based on the 0.7 correlation, and assuming that the radio luminosity scales as the total jet power raised to (as in the Blandford & Königl (1979) and MFF models), the radio luminosity is expected to dominate the X–rays below (about 0.005 Crab). Possible detection of the nearby SXT A 0620–00 at the predicted radio level would be capable to probe such a statement at very low X–ray level, requiring a wholly new accretion regime on to stellar BHs.
| Source | Distance | |
| (kpc) | (10) | |
| 1A 0620–00 | 1 (1) | 0.2 (a) |
| GS 2000+25 | 2 (2) | 0.2 (b) |
| GS 1124–68 | 4.9 (3) | 0.5 (c) |
| GRO J1655–40 | 3 (4) | 0.7 (d) |
| GRS 1716–249 | 2.4 (5) | 0.4 (e) |
| GRS 1739–278 | 8.5 (6) | 2.6 (f) |
| 4U 1630–472 | 10 (7) | 9.4 (g) |
| XTE J2012+381 | 10 (8) | 1.3 (h) |
| XTE J1748–288 | 8 (9) | 7.5 (i) |
| XTE J1859+226 | 7.6 (10) | 0.3 (l) |
| XTE J0421+560 | 5 (11) | 0.1 (m) |
| GRS 1915+105 | 11 (12) | 7.0 (n) |
| Cygnus X–3 | 9 (13) | 2.7 (o) |
| LMC X–1 | 55 (14) | 0.8 (14) |
| LMC X–3 | 55 (14) | 0.1 (14) |
5.1 Discrete ejections
So far, we only have focused on low/hard state BHs, that is,
binary systems characterised by a quasi–steady state of stable
accretion and whose X–ray spectrum is dominated by a hard power law.
In the
following we will add to our sample radio and X–ray fluxes from transient
BHCs during their episodic outbursts
associated with discrete ejection events corresponding to optically thin
radio emission.
All the available data, comprising of soft X–ray and radio
peak fluxes with references, have been reported by Fender &
Kuulkers (2001).
Two points we include in this Section come
from systems which have also been shown
in Figure 2 while in the hard state,
namely V 404 Cygni and GRO J0422+32.
Sources under consideration, as well as their fundamental physical
parameters, are listed in Table 3. Simultaneous radio:X–ray peak
fluxes,
scaled to a distance of 1 kpc are plotted in Figure 6 with
filled squares.
Radio data are based on peak observed flux density at frequency of 5
GHz. Where measurements at 5 GHz were not available, a spectral index of
was assumed in order to estimate the 5
GHz flux based on observations performed at different frequencies (see Fender
& Kuulkers 2001 for details).
Most of the X–ray data are ASM detections, with the only exceptions of GRO
J1655–40 and GRO J0422+32, whose outbursts have been detected by either
BATSE or GRANAT.
For clarity, no error bars are plotted.
5.2 Other BHCs: persistent soft state and ‘extreme’ sources
In between the jet quenching and the discrete ejections from transient
sources, there are of course binary systems displaying a persistent
soft spectrum, i.e. whose emission is dominated by disc blackbody photons. LMC X–1 and LMC
X–3, in the Large Magellanic Clouds,
are the only BHCs always observed while the soft state (actually Wilms et al. 2001; Boyd & Smale 2000 and Homan et al. 2000 reported signs that LMC
X–3 entered
in a hard state). For both these sources, the presence of a black hole is
quite well established, with a most likely mass of 9 and 6,
respectively for LMC X–3 and LMC X–1. By means of radio and X–ray
observations performed in 1997, we can place the two sources
in the vs. plane, in order to verify the amount of radio
power from soft state BHs, which is expected to be well below the hard state
correlation. LMC X–3 X–ray flux densities have been derived from Haardt et al. (2001), while LMC X–1 from Gierlinski et al. 2001.
Radio upper limits for both sources are taken from Fender, Southwell &
Tzioumis (1998).
The corresponding values, scaled to a distance of 1 kpc and corrected for
absorption according to equation 2, are plotted in
Figure 6 with filled circles (at about 150
Crab:4540 mJy and
45 Crab:360 mJy, LMC X–1 and LMC X–3 respectively). As expected, both
points lie below the hard state relation extended to such high X–ray
energies. Although we are only reporting upper limits, we can assert that
fluxes from LMC X–1 and LMC
X–3 do not disagree with our previous finding.
For completeness, simultaneous radio:X–ray detections of two
extreme sources, namely GRS 1915+105 (open polygons) and Cygnus X–3
(open circles), have been included, corresponding to the two big ‘clouds’ at
the top right region
of Figure 6. Both systems
are traditionally considered ‘exotic’ due to their timing
and spectral behaviours which do not fully resemble any ‘standard’ picture
generally accetpted for BHCs; for instance, both these sources display either
optically thin or thick radio spectra. For extensive reviews, see
Bonnet–Bidaud & Chardin (1988; Cygnus X–3) and Belloni et al. (2000; GRS
1915+105). Here we note that, despite its unusually high luminosity,
detections of GRS 1915+105 in the so called plateau state (Belloni et al. 2000) – which appears to share similar properties with the canonical low/hard
state – still
seem to belong to the 0.7 correlation extended up to super–Eddington
regime.
Cygnus X–3 is the strongest observed persistent radio–emitting BH
binary and is embedded in a
dense stellar wind from the companion Wolf–Rayet star (van Kerkwijk et al. 1992; Fender, Hanson & Pooley 1999), which makes difficult
to isolate the compact object high energy spectrum. The high energy emission
from the vicinity of the compact object in Cygnus X–3 is likely to be hidden
by a dense stellar environment surrounding the source; as a consequence, the
intrinsic X–ray luminosity might be higher than inferred, pushing the dataset
closer to the 0.7 relation. Moreover, there still remains uncertainty about
the nature of the accretor in this system.
The neutron star hypothesis can not be ruled out with confidence.
It is
interesting to note that, while the jets from GRS 1915+105 are at
60–70∘ (Fender et al. 1999a), those of Cygnus X–3 appear to be close to
the line of sight
(14∘, Mioduszewski et al. 2001), supporting the previous
hypothesis, in
which higher–than–average normalisation factors would correspond to higher
Doppler factors. In addition, the behaviour of Cygnus X–3, with the apparent
turnover in the radio power,
is very similar to that of Cygnus X–1, except for the flaring behaviour
following the jet quenching (note that points corresponding to this flaring
show characteristic optically thin radio spectra; on the contrary,
pre–flaring detections display ‘flat’ radio spectra, i.e. a different physical
origin).
6 Predicting radio fluxes at low quiescent luminosities
| Source | X–ray luminosity | Distance | Flux density | Predicted radio |
| ( erg/sec) | (kpc) | at 1 kpc (10-6Crab) | flux density (Jy) | |
| 1A 0620–00 | 0.021– 0.042 (a,b) | 1 | 1–5 | 18–43 |
| GRO J1655–40 | 0.23– 34 (a,c) | 3 | 6–82 | 6–34 |
| XTE J1550–564 | 5 (d) | 4 | ||
| GRO J0422+32 | 0.084 (e) | 2.4 | 2 | 4 |
| GS 2000+25 | 0.024 (e) | 2 | 0.5 | 2 |
As the same correlation appears to be maintained over many years and for
different
sources (like for instance Cygnus X–1, GX 339–4, V 404 Cyg), we can
estimate the level of radio emission from a hard state
BH by measuring its X–ray flux alone. This is particularly
interesting in the case of black hole X–ray transients, whose inferred
accretion rate during quiescence may be very small.
Kong et al. (2002) present Chandra observations of three
BH transients during quiescence for which no simultaneous radio detection is
available to date, namely A 0620–00, GRO J1655–40
and XTE J1550–564.
In order to check for possible spectral variability, they also
report results from previous X–ray observations carried out by different
telescopes, such as ROSAT, ASCA and BeppoSAX.
According to Tomsick et al. 2001, the lowest luminosity measured
for XTE J1550–564 with Chandra ( erg/sec, for a
distance of 4 kpc) should however be considered only as an upper limit on
the quiescent luminosity of the system. Chandra detections of
other two transient sources, namely GRO J0422+32 and GS 2000+25, are reported
by Garcia et al. 2001.
In Table 4 we list for each of the five sources the maximum and the minimum
measured X–ray luminosity in quiescence, the inferred distance and the predicted radio
flux density (in Jy) based on our best–fit equation, that is
.
Given a spread of 156 over 223 in the normalisation factor, the predicted
values must be considered reliable within one order of magnitude.
6.1 A 0620–00: the ideal candidate
The Soft X–ray Transient (SXT) A 0620–00 was discovered in outburst in 1975
August (Elvis et al. 1975), while the associated radio
source was at a level of 200–300 mJy (Owen et al. 1976) during the onset of
the outburst.
Six years later the source was detected with the VLA at level of
Jy
(Geldzahler 1983); additional VLA observations in 1986
(see McClintock et al. 1995) yielded an upper limit of 140Jy,
clearly indicating a decline in radio power (see Figure 6
where A 0620–00 detection/upper limit/predicted radio fluxes are marked with
triangles).
The 1981 detection might actually be
associated to
radio lobes resulting from
the interaction of a relativistic–decelerating jet with the interstellar
medium, as observed in the case of XTE J1550–564 about four years after the
ejection of plasma from near the BH (Corbel et al. 2002).
Due to its relative proximity, A 0620–00 is the most
suitable candidate to probe if our empirical radio:X–ray relation does hold down
to low quiescent X–ray luminosity ( erg/sec at 1 kpc, i.e. about 10; Garcia et al. 2001). In other words, if
A 0620–00 was detected at the predicted radio level (a few tens of
Jy, see Figure 6, bottom left corner),
it would confirm that the mechanisms at the origin of radio and X–ray emission
are correlated, if not even partly coincident, over more than six
orders of magnitude
in X–ray luminosity.
Moreover, if the radio:X–ray correlation were confirmed at very low X–ray
luminosities (below )
it would strongly constrain the overall theory of accretion in
quiescence. We direct the reader to the discussion for
further comments.
7 Discussion
The presence of a coupling between radio and X–ray emission in the low/hard
state of black hole binaries obviously requires a
theoretical interpretation that relates somehow the powering/quenching
mechanism(s) of the jet
to the overall accretion pattern.
Zdziarski et al. (2003) ascribe the
correlation to a correspondence between the level of X–ray
emission and the rate of ejection of radio–emitting blobs forming a compact
jet. In
this picture, there still remains the question of the condition for jet
suppression.
Meier (2001) interprets the
steady–jet/hard–X–ray state association as strong evidence for
magnetohydrodynamic (MHD) jet formation, where the most powerful jets
are the product of accretion flows characterised by large scale height.
The simulations show in fact that the jet is confined by the toroidal
component of the magnetic field lines, coiled due to the disc
differential rotation: the bigger the disc scale–height, the stronger the
field.
The power of the jet naturally decreases (at least 100 times weaker)
in the soft/high state, associated with
a standard geometrically thin disc (Shakura & Sunyaev 1973).
To date, two broad classes of geometries have been proposed for explaining
X–ray emission
from low/hard state BHs. The more classical picture is that of
a hot, homogeneous, optically thin corona of (quasi–)thermal electrons
which inverse Compton scatter ‘seed’ photons coming from the underlying
accretion disc (Shapiro, Lightman & Eardley 1973 and similar later
solutions). The alternative is that of a
jet–synchrotron model, in which, under reasonable
assumption on the input power of the jet and the location of the first
acceleration zone, optically thin synchtrotron emission can dominate the
X–ray spectrum, traditionally thought to be a product of inverse Compton
process only (see Markoff, Falcke & Fender 2001 for a detailed description of
the model; hereafter MFF). This model however predicts
self–synchrotron Compton upscattering in the jet for some scenarios.
Remarkably, the
MFF model is able to reproduce the observed slope of the radio:X–ray
correlation analytically (Markoff et al. 2003a), as a function
of the measured X–ray and radio–infrared spectral indices.
A revised version of the classical Comptonisation model for the hard state
has been proposed by Beloborodov (1999).
In this case the hot coronal plasma is powered by magnetic field line
reconnections (Galeev, Rosner & Vaiana 1979) and confined within several
active flares with mildly relativistic bulk velocities,
inferred by the relative weakness of the reflection component. Due to
aberration effects in fact, the amount of X–rays as seen by the reflecting
disc turns out to be reduced by a factor consistent with .
Maccarone (2003) draws a similar conclusion on a different ground: he has
tabulated
all the the available measuremets of X–ray luminosities at the time of the
soft–to–hard state transition, for both BHC and neutron star systems. The
resultant variance in state transition luminosity is also consistent with coming
from material with ; therefore in both
cases.
Following the approach of Section 4.2.2, this immediately implies a
stringent upper limit on the beaming of radio emission
as well, that is (see
Figure 5). This is almost certainly significantly less
relativistic than the jets produced during transients outbursts of sources
such as GRS 1915+105 (Mirabel & Rodríguez 1994; Fender et al. 1999a) and
GRO J1655–40 (Hjellming & Rupen 1995; Harmon et al. 1995; see also Fender
2003).
Therefore, if mildly relativistic beaming characterises the low/hard
state, a mechanism(s) must exist which both switches the jet off
– high/soft state – and produces a faster jet – discrete
ejections – above , where
the hard–to–soft state transition occurs.
It is interesting to mention that
a few percent of the Eddington rate is also close to the regime at which Ghisellini
& Celotti (2001) have identified the transition line between FRI and FR II
radio–galaxies, the former class being associated with slower kpc–scale jets
than the latter (see
Begelman 1982; Bicknell 1984; Laing 1993). This leads
to a kind of correspondence between ‘extreme sources’ like GRS 1915+105, or Cyg
X–3, and FRII, characterised by quite high bulk Lorentz factors, while
‘canonical’ hard state sources would be associated with FR I, with relatively
low outflow bulk velocities.

7.1 Jet–dominated ‘quiescence’
A main task of the models remains that of reproducing the observational
behaviour of accreting stellar BHs at a variety of accretion rates. An interesting
prediction of this work concerns the relative power of the jet, with respect
to the overall accretion power, at low quiescent luminosities.
In this regime, the BH spectral energy distribution appears very similar to that of
canonical hard state sources (see Figure 7), although the X–ray
emission in quiescence is not well reproduced by the standard accretion–corona
model, requiring a much lower radiative efficiency.
Narayan et al. (1996, 1997, 2001) showed that an Advection Dominated
Accretion Flow (ADAF), in which the energy released by viscous torques is
‘stored’ into the flow rather than radiated away, can adequately model the
available observations at
high energies.
However, on the other extreme of the spectrum, in the radio band, the
existence of a jet seriously weakens such a solution, requiring a significantly
different physics to model the observed spectrum.
Jet–powered radio emission is in fact several
orders of magnitude brighter than expected extrapolating ADAF spectra down to
radio band; moreover, the standard ADAF picture predicts highly–inverted
radio spectra, instead of the observed flat ones.
An alternative scenario for low–luminosity
stellar black holes has been proposed by Merloni & Fabian (2002). They show that
a coronal–outflow dominated accretion disc, in which the fraction
of the accretion power released in the corona increases as the accretion rate
decreases, would be an ideal site for jet–launching,
both MHD and thermally driven.
Based on the radio:X–ray correlation,
the ratio between the observed radio and X–ray luminosities
scales as:
| (8) |
This already implies that, as the X–ray luminosity decreases, the
radiative jet power will become more and more important with respect to
the X–rays. Moreover,
because of the self–absorption effects, it has been shown that there will be
not a linear relationship between the radio luminosity,
, and the total jet power, , for any optically thick jet
model which can explain the
flat radio spectrum observed during the hard state. Blandford &
Königl (1979), Falcke & Biermann (1996), and Markoff, Falcke & Fender
(2001) obtain in fact .
If so, and in
general for any relationship of the form:
| (9) |
equation 8 implies the following scaling for the fractional jet power:
| (10) |
Hence, for any , there exists an X–ray luminosity below which
the jet will be the dominant output channel for the accretion power.
If , by re–scaling the
numbers to XTE J1118+480 – emitting at
, and whose
fractional jet power is at least 20% (Fender et
al. 2001) – one obtains that for (i.e. below 0.005 Crab – scaled – see Figure 6).
Note that observations of GX 339–4 and V 404 Cygni in quiescence already
cover this regime, meaning that, if , both these sources actually
are in a jet–dominated state.
This would be a wholly new
accretion regime for X–ray binaries, requiring significant
modification of existing (e.g. ADAF) models. In addition it would
indicate that the overwhelming majority of ‘known’ stellar–mass black
holes, which are currently in quiescence, are in fact feeding back
most of their accretion energy into the interstellar medium in the form of the
kinetic energy of the jets and are accreting at rather higher levels than
derived based only on their X–ray luminosity.
If we do establish that accretion is taking place
in quiescence, for instance throught the detection of A 0620–00,
and is furthermore channelling most of its power into
jet formation, then the arguments for observational evidence for black
hole event horizons based upon a comparison of quiescent X–ray
luminosities of black hole and neutron star binaries (e.g. Garcia et
al. 2001) will need to be re–examined. In fact, assuming that
holds for both neutron stars
and black holes, then the observed difference in ‘radio loudness’ between
black hole and neutron star binaries (Fender & Kuulkers 2001) might be
enough on its own to explain the discrepancy, and it may be that the
event horizon plays no part. This is explored further in Fender, Gallo & Jonker
(in preparation).
8 Summary
In this paper we provide observational evidence for a broad empirical relation between radio and X–ray emission in Galactic black hole binaries during their spectrally hard state. The main points established throught this work can be summarised as follows:
-
•
In low/hard state BHCs the observed radio and X–ray fluxes are correlated over more than three orders of magnitude in accretion rate, with a spread in radio power of about one order of magnitude.
-
•
Even at accretion rates as low as Eddington a powerful jet is being formed; no lower limit to the relation has been found.
-
•
V 404 Cygni is the second source to display , from quiescence up close to the hard–to–soft state transition.
-
•
Assuming 0.7 as a universal slope for the low/hard state, and under the hypotheses of a) common disc–jet coupling and b) isotropic X–ray emission, the measured spread in radio flux can be interpreted in terms of a distribution in Doppler factors. Monte Carlo simulations show that the observed scatter is consistent with relatively low beaming () outflows in the low/hard state, unlike those in transient outbursts.
-
•
When the combination of radio and X–ray beaming is taken into account, the range of possible bulk velocities in the jet significantly broadens, allowing the X–ray emitting material to be relativistic for almost any value of , but implying strong X–ray selection effects. In this case an independent estimation on is needed to limit . Unrelated works (Beloborodov 1999; Maccarone 2003) impose stringent constraints on the bulk velocity of the X–ray emitting material, leading to the conclusion of relatively low radio beaming () in the hard state.
-
•
Close to the hard–to–soft state transition the jet switches off, probably in all sources. The X–ray luminosity at which the radio quenching occurs might positively correlate with the BH mass, being consistent with taking place at a constant fraction of the Eddington rate. It is worth mentioning that a similar fraction of has been identified as a dividing line between FR I and FR II radio–galaxies, that is between supermassive BHs producing mildly and highly relativistic jets respectively (Ghisellini & Celotti 2001).
-
•
Since the correlation appears to be maintained over many years and for different sources, this leads to the possibility of predicting the level of radio emission from a hard state and/or quiescent BH by measuring its X–ray flux.
-
•
If the radio luminosity scales as the total jet power raised to , with , this implies the existence of an X–ray luminosity below which the most of the accretion power will be channelled into the jet rather than in the X–rays. If (e.g. Blandford & Königl 1979, Falcke & Biermann 1996; MFF), then below the jet is expected to dominate.
This work provides evidence for a physical coupling between radio and hard X–ray emitting ouflows from accreting stellar BHs. A key, still unresolved issue concerns the modelling of the transition between X–ray states in a self consistent way, which could possibly account for both the jet suppression, when the disc dominates, and the transition from mildly to highly relativistic jets, as in case of transient outbursts. Including the formation of jets in the overall energetics and dynamics of the accretion process at a variety of X–ray luminosities has undoubtedly become of primary importance to address, especially based on mounting evidence for the jet power to be a significant fraction, if not the dominant output channel, of the total accretion power.
Acknowledgements
The authors wish to thank Sera Markoff, Stephane Corbel, Peter Jonker and Michiel van der Klis, for many useful suggestions and comments on the manuscript. This research has made use of data obtained through the High Energy Astrophysics Science Archive Research Center Online Service, provided by the NASA/Goddard Space Flight Center. The Ryle telescope is supported by PPARC.
References
- [] Asai K., Dotani T., Hoshi R., Tanaka Y., Robinson C. R., Terada K., 1998, PASJ, 50, 611
- [] Begelman M. C., 1982, Extragalactic Radio Sources, IAU Symp. 97, ed. D. S. Heeschen & C. M. Wade, Kluwer, 223
- [] Belloni T., Klein–Wolt m., Méndez M., van der Klis M., van Paradijs J., 2000, A&A, 355, 271
- [] Belloni T., Méndez M., van der Klis M., Lewin W. H. G., Dieters S., 1999, ApJ, 519, L159
- [] Beloborodov A. M., 1999, ApJ, 510, 123
- [] Bicknell G. V., 1984, ApJ, 286, 68
- [] Blandford R. D., Königl A., 1979, ApJ, 232, 34
- [] Bonnet–Bidaud J. M., Chardin G., 1998, Phys. Rep., 170, 326
- [] Boyd P. T., Smale A. P., 2000, IAU Circ., 7424, 3
- [] Brocksopp C., Fender R., Pooley G. G., MNRAS, 2002, 336, 699
- [] Brocksopp C., Bandyopadhyay R. M., Fender R. P., 2003, submitted
- [] Brocksopp C., Jonker P. G., Fender R. P., Groot P. J., van der Klis M., Tingay S. J., 2001, MNRAS, 323, 517
- [] Brocksopp C. et al. 1999, MNRAS, 309, 1063
- [] Callanan P. J., Garcia M. R., Filippenko A. V., McLean I., Teplitz H., 1996, ApJ, 470, L57
- [] Campana S., Stella L., Belloni T., Israel G. L., Santangelo A., Frontera F., Orlandini M., Dal Fiume D., 2002, A&A, 384, 163
- [] Corbel S., Fender R., 2002, ApJ, 573, L35
- [] Corbel S., Nowak M. A., Fender R. P., Tzioumis A. K., Markoff S., 2003, A&A, 400, 1007
- [] Corbel S., Fender R. P., Tzioumis A. K., Nowak M., McIntyre V., Durouchoux P., Sood R., 2000, A&A 359, 251
- [] Corbel S. et al. , 2002, Science, 298, 196
- [] Corbel S. et al. , 2001, ApJ, 554, 43
- [] Cowley A. P., Schmidtke P. C., Hutchings J. B., Crampton D., 2002, ApJ, 123, 1741
- [] Della Valle M., Mirabel I. F., Rodríguez L. F., 1994, A&A, 290, 803
- [] Di Salvo T., Done C., Zycki P. T., Burderi L., Robba N. R., 2001, ApJ, 547, 1024
- [] Done C., 2001, Adv. Space Res., 28, 255
- [] Dubus G., Kim R. S. J., Menou K., Szkody P., Bowen D. V., 2001, 553, 307
- [] Ebisawa, K. et al. , 1994, PASJ, 46, 375
- [] Elvis M., Page C. G., Pounds K. A., Ricketts M. J., Turner M. J. L., 1975, Nature, 257, 656
- [] Falcke H., Biermann P. L., 1996, A&A, 308, 321
- [] Fender R. P., 2003, MNRAS, in press
- [] Fender R. P., 2001a, MNRAS, 322, 31
- [] Fender R. P., 2001b, A&SS, 276, 69
- [] Fender R. P., 2001c, Relativistic flows in Astrophysics, Springer Verlag Lecture Notes in Physics, Eds A.W. Guthmann, M. Georganopoulos, K. Manolakou and A. Marcowith, Lect. Notes Phys. 589, 101
- [] Fender R. P., 2000, in Proc. of the Third Microquasar Workshop, Eds A. J. Castro–Tirado, J. Greiner and J. M. Paredes, A&SS 276, 69
- [] Fender R. P., Kuulkers E., 2001, MNRAS 324, 923
- [] Fender R. P., Hanson M. M., Pooley G. G., 1999, MNRAS, 308, 473
- [] Fender R. P., Southwell K., Tzioumis A. K., 1998, MNRAS, 298, 692
- [] Fender R. P., Garrington S. T., McKay D. J., Muxlow T. W. B., Pooley G. G., Spencer R. E., Stirling A. M., Waltman E. B., 1999a, MNRAS, 304, 865
- [] Fender R. P. et al. 1999b, ApJ, 519, L165
- [] Galeev A. A., Rosner R., Vaiana G. S., 1979, ApJ, 229, 318
- [] Gallo E., Fender R. P., 2002, MNRAS, 337, 869
- [] Gallo E., Fender R. P., Pooley G. G., 2002, in Proc. of the Fourth Microquasars Workshop, Eds Ph. Durouchoux, Y. Fuchs, and J. Rodriguez, Center for Space Physics: Kolkata, 201
- [] Garcia M. R., McClintock J. E., Narayan R., Callanan P., Barret D., Murray S. S., 2001, ApJ, 553, L47
- [] Geldzahler B. J., 1983, ApJ, 264, L49
- [] Ghisellini G., Celotti A., 2001, A&A, 379, L1
- [] Gierlinski M., Maciolek–Niedzwiecki A., Ebisawa K., 2001, MNRAS, 325, 1253
- [] Greiner J., Dennerl K., Predehl P., 1996, A&A, 314, L21
- [] Haardt F., Maraschi L., 1991, ApJ, 380, L51
- [] Haardt F. et al. , 2001, ApJ, 133, 187
- [] Han X., Hjellming R. M., 1992, ApJ, 400, 304
- [] Hannikainen D. C., Hunstead R. W., Campbell–Wilson D., Sood R. K., 1998, A&A, 337, 460
- [] Harmon B. A., 1995, Nature, 374, 703
- [] Heindl W. A., Prince T. A., Grunsfeld J. M., 1994, ApJ, 430, 829
- [] Hjellming R. M., Rupen M. P., 1995, Nature, 375, 464
- [] Hjellming R. M., Rupen M. P., Mioduszewski A. J., Narayan, R., 2000, The Astronomer’s Telegram, 54
- [1] Hjellming R. M., Han X., 1995, Radio properties of X–ray binaries, in X–ray binaries, Eds. Lewin W. H. G., van Paradijs J., van den Heuvel E. P. J., Camridge University Press, 308
- [] Homan J., Jonker P. G., van der Klis M., Kuulkers E., 2000, IAU Circ., 7425, 2
- [] Homan J., Wijnands R., van der Klis M., Belloni T., van Paradijs J., Klein–Wolt M., Fender R., Mendez M., 2001, ApJS, 132, 377
- [] Hynes R. I., Steeghs D., Casares J., Charles P. A., O’Brien K., 2003, ApJ, in press
- [] Hynes R. I., Haswell C. A., Chaty S., Shrader C. R., Cui W., 2002, MNRAS, 331, 169
- [] Hynes R. I., Roche P., Charles P. A., Coe M. J., 1999, MNRAS, 305, L49
- [] Keck J. W. et al. , 2001, ApJ, 563, 301
- [] Kitamoto S., Tsunemi H., Pedersen H., Ilovaisky S. A., van der Klis M., 1990, ApJ, 361, 590
- [] Klein–Wolt M., Fender, R. P., Pooley G. G., Belloni T., Migliari S., Morgan E. H., van der Klis M., 2002, MNRAS, 331, 745
- [] Kong A. K. H., McClintock J. E., Garcia M. R., Murray S. S., Barret D., 2002, ApJ, 570, 277
- [] Kotani T. et al. , 2000, ApJ, 543, L133
- [] Kubota A., Makishima K., Ebisawa K., 2001, ApJ, 560, L147
- [] Kuulkers E., Fender R. P., Spencer R. E., Davis R. J., Morison I., 1999, MNRAS, 306, 919
- [] Laing R. A., 1993, Astrophysical Jets, ed. D. Burgarella, M. Livio & C. O’Dea Cambridge University Press, 95
- [] Lin D. et al. , 2000, ApJ, 532, 548
- [] Maccarone T. J., 2003, MNRAS, submitted
- [] Maccarone T. J., 2002, MNRAS, 336, 1371
- [] Main D. S., Smith D. M., Heindl W. A. Swank J., Leventhal M., Mirabel I. F., Rodríguez L. F., 1999, ApJ, 525, 901
- [] Markoff S., Falcke H., Fender R.P., 2001, A&AL, 372, L25 (MFF)
- [] Markoff S., Nowak M. A., Corbel S., Fender R., Falcke H., 2003a, A&A, 397, 645
- [2] Markoff S., Nowak M., Corbel S., Fender R., Falcke H., 2003b, in Proceedings for ‘The Physics of Relativistic Jets in the Chandra and XMM Era’, Eds. G. Brunetti, D. E. Harris, R. M. Sambruna & G. Setti
- [] Markwardt C. B., Marshall F. E., Swank J. H., 1999, IAU Circ., 7274, 2
- [] Martí J., Mirabel I.F., Duc P.A., Rodríguez L.F., 1997, A&A, 323, 158
- [] Massey P., Johnson K. E., Degioia–Eastwood K., 1995, ApJ, 454, 151
- [] McClintock J. E., Horne K., Remillard R. A., 1995, ApJ, 442, 358
- [] McClintock J. E., et al. , 2001, ApJ, 555, 477
- [] Meier D. L., 2001, ApJ, 548, L9
- [] Merloni A., 2002, in Proc. of the Fourth Microquasars Workshop, Eds Ph. Durouchoux, Y. Fuchs, and J. Rodriguez, Center for Space Physics: Kolkata, 2105.
- [] Merloni A., Fabian A. C., 2002, MNRAS, 332, 165
- [] Miller J. M., Fox D. W., Di Matteo T., Wijnands R., Belloni T., Pooley D., Kouveliotou C., Lewin W. H. G., 2001, ApJ, 546, 1055
- [] Mirabel I. F., Rodríguez L. F., Nature, 371, 46
- [] Mirabel I. F., Rodríguez L. F., 1999, ARA&A, 37, 409
- [] Mioduszewski A. J., Rupen M. P., Hjellming R. M., Pooley G. G., Waltman E. B., 2001, ApJ, 553, 766
- [] Narayan R., Barret D., McClintock J. E., 1997, ApJ, 482, 448
- [] Narayan R., Garcia M. R., Mcclintock J. E., 2001, in Proc. of the Ninth Marcel Grossmann Meeting, Eds V. Gurzadyan, R. Jantzen, R. Ruffini, Singapore: World Scientific
- [] Narayan R., McClintock J. E., Yi I., 1996, ApJ, 457, 821
- [] Nowak M. A., 1995, PASP, 107, 1207
- [] Orosz, J. A., 2002, in Proc. of the IAU Symp. 212, Eds K. A. van der Hucht, A. Herraro, & C. Esteban, San Francisco: ASP (astro-ph/0209041)
- [] Orosz J. A., Jain R. K., Bailyn C. D., McClintock J. E., Remillard R. A., 1998, ApJ, 499, 375
- [] Owen F. N., Balonek T. J., Dickey J., Terzian Y., Gottesman S. T., 1976, ApJ, 203, L15
- [] Parmar A. N., Belloni T., Orlandini M., Dal Fiume D., Orr A., Masetti N., 2000, A&A, 360, L31
- [] Parmar A. N., Stella L., White N. E., 1986, ApJ, 304, 664
- [] Pooley G. G., Fender R., Brocksopp C., 1999, MNRAS, 302, L1
- [] Pooley G. G., Fender R., 1997, MNRAS, 292, 925
- [] Poutanen J., 1998, in Theory of Black Hole Accretion Disks, Camridge University Press, 100
- [] Poutanen J., Svensson R., 1996, ApJ, 470, 249
- [] Predehl P., Burwitz V., Paerels F., Tr mper J., 2000, A&A, 357, 25
- [] Robinson E. L., Ivans I. I., Welsh W. F., 2002, ApJ, 565, 1169
- [] Rutledge R. E., Bildsten L., Brown E. F., Pavlov G. G., Zavlin V. E., 1999, ApJ, 514, 945
- [] Sánchez–Ferández C. et al. , 1999, A&A, 348, L9
- [] Schulz N. S., Cui W., Canizares C. R., Marshall H. L., Lee J. C., Miller J. M., Lewin W. H. G., 2002, ApJ, 565, 1141
- [] Shahbaz T., Naylor T., Charles P. A., 1997, MNRAS, 285, 607
- [] Shahbaz T., Naylor T., Charles P. A., 1994, MNRAS, 268, 756
- [] Shakura N. I., Sunyaev R. A., 1973, A&A 24, 337
- [] Shapiro S. L., Lightman A. P., Eardley D. M., 1976, ApJ, 204, 187
- [] Shrader C. R., Wagner R. M., Charles P. A., Harlaftis E. T., Naylor T., 1997, ApJ, 487, 858
- [] Sobczak G. J., McClintock J. E., Remillard R. A., Levine A. M., Morgan E. H., Bailyn C. D., Orosz J., 1999, ApJ, 517, L121
- [] Sood R., Campbell–Wilson D., 1994, IAU Circ., 6006, 1
- [] Stirling A. M., Spencer R. E., de la Force C. J., Garrett M. A., Fender R. P., Ogley R. N., 2001, MNRAS, 327, 1273
- [] Sunyaev R. A., Titarchk L. G., 1980, A&A, 86, 121
- [] Sunyaev R. A. et al. , 1991, ApJ, 383, L49
- [] Tanaka Y., 1993, IAU Circ., 5877, 1
- [] Terasawa N., Nakamura H., 1995, A&A, 294, 443
- [] Tomsick J. A., Kaaret P., 2000, ApJ, 537, 448
- [] Tomsick J., Corbel S., Kaaret P., ApJ, 2001, 563, 229
- [] Ueda Y., Inoue H., Tanaka Y., Ebisawa K., Nagase F., Kotani T., Gehrels N., 1998, ApJ, 492, 782; erratum ApJ, 500, 1069
- [] van Kerkwijk M. H. et al. , 1992, Nature, 355, 703
- [] Wagner R. M., Starrfield S. G., Hjellming R. M., Howell S. B., Kreidl T. J., 1994, ApJ 429, L25
- [] Wilms J., Nowak M. A., Pottschmidt K., Heindl W. A., Dove J. B., Begelman M. C., 2001, MNRAS, 320, 327
- [] Zdziarski A. A., Gilfanov M., Lubinski P., Revnivtsev M., 2003, MNRAS, in press
- [] Zdziarski A. A., Poutanen J., Mikolajewska J., Gierlinski M., Ebisawa K., Johnson W. N., 1998, MNRAS, 301, 435
- [] Zycki P. T., Done C., Smith D. A., 1999, MNRAS, 305, 231