Disc-jet coupling in an atoll-type neutron star X-ray binary: 4U 1728–34 (GX 354–0)
Abstract
We have analysed 12 simultaneous radio (VLA) and X-ray (RXTE) observations of the atoll-type X-ray binary 4U 1728–34, performed in two blocks in 2000 and 2001. We have found that the strongest and most variable emission seems to be associated with repeated transitions between hard (island) and softer (lower banana) X-ray states, while weaker, persistent radio emission is observed when the source is steadily in the hard X-ray state. There is a significant positive ranking correlation between the radio flux density at 8.46 GHz and the 2–10 keV X-ray flux. Moreover, significant positive ranking correlations between radio flux density and X-ray timing features (i.e. break and low-frequency Lorentzian frequencies) have been found. These correlations represent the first evidence for a coupling between disc and jet in an atoll-type X-ray binary. Furthermore, drawing an analogy between the hard (island) state and the low/hard state of black hole binaries, we confirm previous findings that accreting neutron stars are a factor of less ‘radio loud’ than black holes.
keywords:
binaries: close – stars: neutron stars: individual: 4U 1728–34 – ISM: jets and outflows radio continuum: stars1 Introduction
In black hole candidates (BHCs) and in Z-type neutron star (NS) X-ray binaries connections between inflow (disc) and outflow (jet) have been established. Many works (e.g. Hjellming & Han 1995 and references therein; Falcke & Biermann 1996; Dhawan, Mirabel & Rodríguez 2000; Fomalont, Geldzahler & Bradshaw 2001) suggest that all the radio emission from such systems (including weak spatially unresolved emission) originates in jet-like outflows. In persistent BHCs steady jet outflows are associated with the ‘low/hard’ X-ray state, while not detected in the ‘high/soft’ state (Fender et al. 1999; Fender 2001a,b). In Z-type NSs the radio emission seems to be strongest in the ‘horizontal’ branch and weakest in the ‘flaring’ branch (Penninx et al. 1988; Hjellming & Han 1995 and references therein). Atoll-type NS X-ray binaries share many X-ray spectral and timing properties with BHCs (especially in the low/hard state; van der Klis 1994). However, only a few atolls are detected in radio band because of their lower radio luminosity (Fender & Hendry 2000). Hence, although they represent the largest class of X-ray binaries (%, using the ‘broader’ definition of Fender & Hendry 2000) no information on a possible radio:X-ray coupling has been available until now.
| MJD | F(2-60) | F(2-10) | F8.46 | F4.86 | break | Lb | Lh | Lu | |
| (erg s-1cm-2) | (erg s-1cm-2) | (mJy) | (mJy) | (Hz) | (Hz) | (Hz) | (Hz) | ||
| a | 51638.53 | … | … | ||||||
| b | 51649.581 | … | |||||||
| c | 51669.51 | … | |||||||
| d | 51677.32 | … | |||||||
| e | 51685.47 | … | |||||||
| f | 51695.341 | … | … | … | |||||
| 52056.372 | … | … | … | … | … | ||||
| g | 52058.361 | … | |||||||
| h | 52061.351 | … | … | ||||||
| i | 52063.31 | … | … | ||||||
| j | 52065.34 | … | … | ||||||
| k | 52067.30 | … | … | ||||||
| l | 52069.29 | … |
4U 1728–34 (GX 354–0; Forman et al. 1976) is a low-mass X-ray binary and a type-I X-ray burster (Lewin 1976; Hoffman et al. 1976). From X-ray burst properties a distance to the source (accurate to within 15%: Kuulkers et al. 2002) of kpc, for a 1.4 M⊙ mass NS, was obtained (Galloway et al. 2002; see also Basinska et al. 1984). Hasinger & van der Klis (1989) classified 4U 1728–34 as an atoll-type X-ray binary. A multi-Lorentzian timing study of the power spectrum shows well-defined and correlated features in both low and high frequency range (for details see e.g. van Straaten et al. 2002 and references therein). Timing properties are related to the position of the source in the colour-colour diagram (CD; e.g. Méndez & van der Klis 1999; Di Salvo et al. 2001; van Straaten et al. 2002), and therefore to the changing mass accretion rate (which probably increases from the island to the banana state: e.g., Hasinger & van der Klis 1989; although there are secular changes on timescales of a few days or longer that cause shifts in the CD: e.g. van der Klis 2001). The continuum of the broadband 0.1–100 keV energy spectrum of the persistent emission of 4U 1728–34 in the soft state is well fit by a soft thermal (blackbody or multitemperature disc blackbody) plus a Comptonized component (Di Salvo et al. 2000)
The optical counterpart of 4U 1728–34 cannot be detected due to the high extinction in the galactic center direction. In 1997 Martí et al. (1998) observed 4U 1728–34 in the radio band (at 4.86 GHz) with the VLA, and after a few non-detections (with upper limits up to 0.32 mJy) succesfully detected its radio counterpart with a variable flux density ranging between and mJy. They also detected a J and K-band infrared source (J= and K=) within one arcsec of the radio source.
2 Observations and data analysis
4U 1728–34 was observed on 13 occasions between 2000 and 2001 with the VLA, 12 times simultaneously with RXTE observations. In Table 1 we show the MJDs of the observations in 2000 (a to f) and in 2001 (g to l and the non-simultaneous with RXTE at MJD 52056.37). The array was in configuration C during the observations in 2000, B during the non-simultaneous observation and g, and CnB during h-to-l. Observation durations ranged from five min to a few hours; flux densities measured at both 4.86 and 8.46 GHz are reported in Table 1. Flux calibration was achieved using J1331+305 or J0137+331; phase calibration was performed using J1744–312 and data reduction using AIPS. Absolute calibration of the flux density scale is estimated to be accurate to %. No significant flux density variations were found within each data set. Combining the data, the best-fit coordinates for the radio counterpart are J2000 RA 17 31 57.687 +/- 0.013 Dec -33 50 01.11 +/- 0.18; this is consistent with the position reported in Martí et al. (1998) within 1.5. There is no evidence for any spatial extension during these observations.
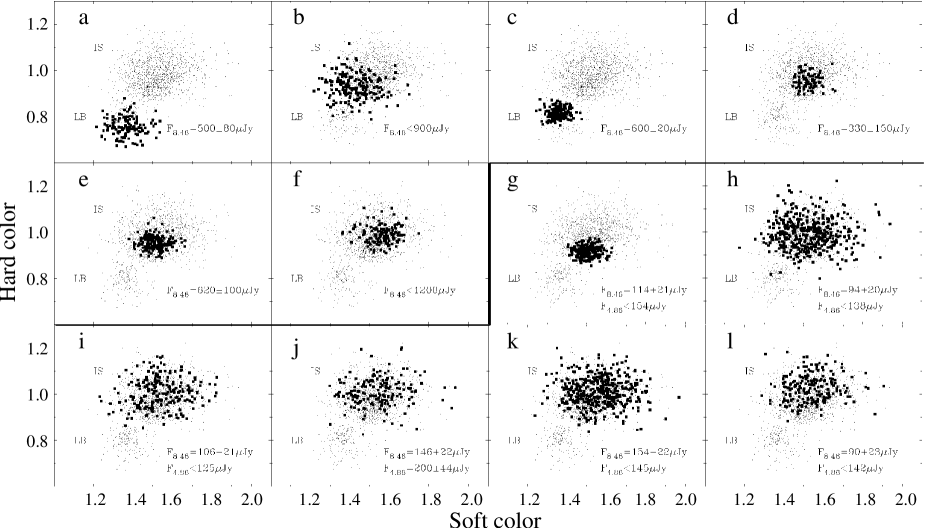
For the RXTE observations we have used data from the Proportional Counter Array (PCA; for spectral and timing analysis) and the High Energy X-ray Timing Experiment (HEXTE; only for spectral analysis). The durations of the X-ray observations range between half an hour to a few hours. We have used the PCA Standard2 data to produce the CD of the RXTE observations (Fig. 1). The soft colour and the hard colour are defined as the count rate ratio (3.5–6) keV/(2–3.5) keV and (9.7–16) keV/(6–9.7) keV, respectively. We have normalised the colours of 4U 1728–34 to the colours of the Crab calculated with the closest observation available to each 4U 1728–34 observation. The identification of the X-ray states as island (IS) and lower banana (LB) are confirmed by timing properties (see below; Di Salvo et al. 2001; van Straaten et al. 2002).
For the spectral analysis of PCA Standard2 data we subtracted the background, estimated using pcabckest v3.0, produced the detector response matrix with pcarsp v8.0 and analysed the energy spectra in the range 3–20 keV. We extracted HEXTE energy spectra (channels 15–61) from both cluster A and B, subtracted the background, corrected for deadtime using FTOOLS V5.2 and analysed the spectra between 20 and 60 keV, except the observation a in which the source was not detected above 40 keV. A systematic error of 0.75% was added to the PCA data.
Four observations (see Table 1) show one X-ray burst in the PCA light curve. We excluded the burst from the data and analysed only the spectra of the steady persistent emission averaged over each observation. The spectra of d-to-l are well fit by an absorbed power law with a high energy cutoff (in the range keV) and a blackbody, plus a keV Gaussian emission line. No high energy cutoff is necessary for a, b and c. The equivalent hydrogen column density NH was fixed to cm-2 (Hoffman et al. 1979; Grindlay & Hertz 1981; Foster et al. 1986; Di Salvo et al. 2000).
For the production of the power spectra we used event data with a time resolution of 125 s. We rebinned the data in time to obtain a Nyquist frequency of 4096 Hz. For each observation we created power spectra segments of 128 s length, cutting the first five energy channels to avoid possible fake high frequency features of instrumental origin (Klein-Wolt, Homan & van der Klis 2003 in prep.), and we removed X-ray bursts from the data, but no background and deadtime corrections were performed. We averaged the power spectra and subtracted the Poisson noise estimated between 3000 and 4000 Hz applying the standard method by Zhang et al. (1995). We applied the Leahy et al. (1983) normalisation and then converted the power spectra to squared fractional rms. For the fitting procedures the multi-Lorentzian model was used in the power times frequency representation (for details see Belloni, Psaltis & van der Klis 2001 and references therein).
The power spectra are fit using one broad Lorentzian to represent the low frequency noise and the break frequency, one or two narrower Lorentzians (Lb and Lh: see van Straaten van der Klis & Méndez 2003 for details on nomenclature), a broad Lorentzian around 100 Hz (LhHz) and narrow Lorentzians to fit the kHz QPOs (see Fig. 2 and Table 1). In five observations we have found only one kHz QPO. Based on the correlations of the frequency of the kHz QPOs with their amplitude (Fig. 1 in Méndez et al. 2000), and with the frequencies of the other timing features (Fig. 3 in van Straaten et al. 2002), we identified all of them as ‘upper’ kHz QPOs (Lu). Both the ‘upper’ and the ‘lower’ kHz QPOs are found in g.


3 Overall pattern of behaviour
Fig. 1 shows the position in the CD of the 12 observations and the corresponding radio flux density (the upper limits are 3) at 8.46 GHz and, where available, at 4.86 GHz. We see that the observations in 2000 (taken every days) are mainly in the IS with two excursions to the LB. It seems that during this period the source was repeatedly transiting between IS and LB. These observations show the highest radio flux density values up to 0.6 mJy with variations of mJy between observations, and two non-detections (both non-detections have limits above the other measurements in IS, so are consistent with the other observations). In 2001 the observations (taken every 2–3 days) are steady in the IS, the radio flux density is lower (around 0.1 mJy) and the variations are smaller ( mJy) than in 2000. This indicates a possible association of radio flaring with transitions between hard (i.e. IS) and softer (i.e. LB) X-ray states, and ‘quiescent/steady’ radio emission with the hard (IS) state. We cannot find any measurable effect of type-I X-ray bursts on radio emission, although we notice that the bursts are detected when the radio flux seems to be low: in two observations of 2001 and in the two observations of 2000 with no radio detections (see Table 1).
The dual-frequency radio measurements are not good enough to seriously constrain the radio spectrum (see Table 1). They are in most cases consistent with both flat (, where and is the radio flux density at a certain frequency ) spectrum radio emission as observed from low/hard state black holes, or the optically thin emission () observed from X-ray transients (i.e. non-simultaneous observation: ; g: ; h: ; i: ; j: ; k: ; l: ).
4 Radio:X-ray correlations
Fig. 3 shows the radio flux density as a function of the soft spectral component (i.e. blackbody), the hard spectral component (i.e. power law) and the total unabsorbed 2–10 keV X-ray flux (this range is chosen to allow a direct comparison with the radio:X-ray flux correlation in BHCs; e.g Gallo Fender & Pooley 2003; see § 5) of the 12 observations. Excluding the observation g (the star; we will discuss this point in § 5), there are significant positive ranking correlations between the radio flux density and the X-ray fluxes (%, 97% and % significance respectively with blackbody, power law and total flux; the fitting power-laws , where is the radio flux density and is the X-ray flux, shown in Fig. 3 have of , and for blackbody, power-law and total X-ray flux respectively). This indicates that the jet power is correlated to the accretion rate as inferred from X-ray flux.
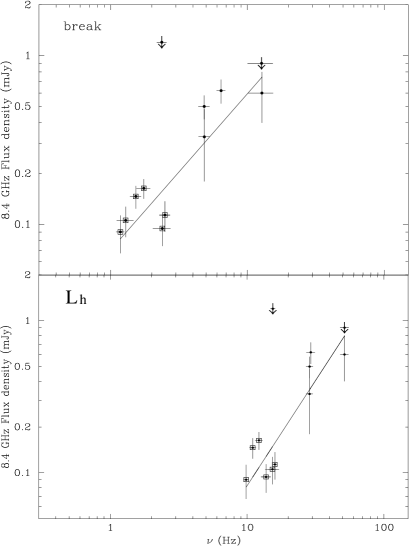
In Fig. 4 we show the frequency of the break and Lh as a function of the radio flux density. There is a significant positive ranking correlation between break, Lh frequencies and radio flux density (99% and 98% significance respectively; in Fig. 4 the fitting power laws , where is the radio flux density and is the frequency, have and for break and Lh respectively). There is also a hint (with only four points, treating with caution the observation g; see also § 5) of a correlation between Lu frequency and the radio flux density. An opposite (qualitative) behaviour was found by Muno et al. (2001) for the BHC GRS 1915+105; they found that the ‘radio plateau’ observations (i.e. radio flux densities mJy at 15.2 GHz) show lower 0.5–10 Hz QPO frequencies than ‘radio faint’ observations (i.e. radio flux densities 20 mJy at 15.2 GHz).
The QPO frequencies are generally interpreted as being related to the motion of matter in the accretion disc at a certain radius. In particular, in low magnetic field NS systems, the kHz QPOs are thought to be related to motion of matter a few stellar radii from the star (see van der Klis 2000 for a review), and, as in e.g. Miller, Lamb and Psaltis (1998), correspond to the inner radius of the Keplerian disc. According to most models (see e.g. van der Klis 2001 and references therein) the kHz QPOs (and also other timing features like the break and Lh that generally correlate with them; Di Salvo et al. 2000; Méndez, van der Klis & Ford 2001; van Straaten et al. 2002) are related to the disc mass accretion rate. Therefore our radio flux/X-ray timing correlations represent independent (i.e. different from radio:X-ray flux correlations) evidence for a coupling between accretion and outflow rates. As a caveat, we note that the correlations discussed above are dominated by the difference between the two blocks of data, in 2000 and 2001 respectively. While the correlations themselves are not in doubt, further observations are required to establish if there is a smooth relation between the blocks or a more bimodal form of behaviour.
5 Discussion
We know that the X-ray flux does not trivially trace the disc mass accretion rate; ‘parallel tracks’ are observed between kHz QPO frequencies and X-ray luminosity (e.g. Méndez et al. 1999; Ford et al. 2000; Méndez et al. 2001). The strong coupling between spectral and timing properties in X-ray binaries, suggests that the QPOs are actually a more straightforward indicator, rather than luminosity, if not of the absolute value of at least of variations of the disc mass accretion rate and maybe of the inner radius of the accretion disc (see van der Klis 2001). Therefore, the radio:X-ray flux and even more the radio flux/X-ray timing correlations translate into the first evidence for a coupling between the accretion disc inflow and the jet outflow in an atoll source.
4U 1728–34 shows a correlation between radio flux density and X-ray flux qualitatively similar to that found for BHCs in the low/hard state (Hannikainen et al. 1998; Corbel et al. 2000; Corbel et al. 2002; Gallo et al. 2003), although the index of the coupling (see Fig. 3) is rather steeper. The observation g (star in Fig. 3, has the highest X-ray flux in our sample and a low (compared to what ‘expected’ from the radio:X-ray flux correlation we have found for the other observations) radio flux density. Since g shows the same low frequency timing properties of the other observations in 2001, this high X-ray flux can be interpreted as due to a ‘parallel track’ effect (see e.g. Méndez et al. 2001). Furthermore, in the power spectrum, although the low frequency features are in agreement with previous observations at the same position in the CD, the relative strengths of the kHz QPOs we find (the ‘lower’ kHz QPO is stronger than the ‘upper’) are usually observed in softer observations, i.e. in the banana state rather than in the IS (e.g. van Straaten et al. 2000). A comparison with BHCs (see e.g. Gallo et al. 2003) also show that g is almost at the same X-ray luminosity (using a distance of 5.2 kpc: Galloway et al. 2002) as the ‘radio quenching’ in BHCs; this suggests (nothing more than this, since it is only one point) that suppression (‘quenching’) of the radio jet may occur above some luminosity, as in BHCs. It is interesting to note that 4U 1728–34, at the same X-ray luminosity as e.g. Cyg X-1 (Gallo et al. 2003), show a radio luminosity times less than Cyg X-1 (i.e. scaled to 1 kpc the radio flux densities are mJy and mJy). This confirms (also quantitively) the Fender & Kuulkers (2000) finding of radio ‘loudness’ difference between atoll-type NSs and BHCs.
X-ray (i.e. mainly accretion) properties in atoll sources and in BHCs (in low/hard state) seem to be qualitatively the same (e.g. van der Klis 1994). This suggests that the same physical processes take place in both type of sources. What about the physical processes that connect inflow (disc) and outflow (jet) matter in X-ray binaries? The key to answering this question lies in the study of atoll vs BHCs disc-jet coupling. The results presented in this paper may be a first step in that direction.
Acknowledgements
The National Radio Astronomy Observatory is a facility of the National Science Foundation operated under cooperative agreement by Associated Universities, Inc. We would like to thank Steve van Straaten and Tiziana Di Salvo for useful discussions.
References
- [] Basinska E.M., Lewin W.H.G., Szyajno M., Cominsky L.R., Marshall F.J., 1984, ApJ, 281, 337
- [] Belloni T., Psaltis D., van der Klis M., 2002, ApJ, 572, 392
- [] Corbel S., Fender R.P., Tzioumis A.K., Nowak M.A., McIntyre V., Durouchoux P., Sood R., 2000, A&A, 359, 251
- [] Corbel S., Nowak M.A., Fender R.P., Tzioumis A.K.,Markoff S., 2002, A&A, in press
- [] Di Salvo T., Iaria R., Burderi L., Robba N.R., 2000, ApJ, 542, 1034
- [] Di Salvo, T., Méndez, M., van der Klis, M., Ford, E., Robba, N.R., 2000, ApJ, 546, 1107
- [] Falcke H., Biermann P.L., 1996, A&A, 308, 321
- [] Fender R.P., 2001a, MNRAS, 322, 31
- [] Fender R.P., 2001b, Ap&SS Supp., 276, 69
- [] Fender R.P., Hendry M.A., 2000, MNRAS, 317, 1
- [] Fender R.P., et al., 1999, ApJ, 519, L165
- [] Fomalont E.B., Geldzahler B.J., Bradshaw C.F., 2001, ApJ, 558, 283
- [] Ford E.C., van der Klis M., Méndez M., Wijnands R., Homan J., Jonker, P.J., van Paradijs J., 2000, ApJ, 537, 368
- [] Forman W., Tananbaum H., Jones C., 1976, ApJ, 206, L29
- [] Foster A.J., Ross R.R., Fabian A.C., 1986, MNRAS, 221, 409
- [] Gallo E., Fender R.P., Pooley G.G., 2003, MNRAS, accepted
- [] Galloway D.K., Psaltis D., Chakrabarty D., Muno M.P., 2002, ApJ, submitted, astro-ph/0208464
- [] Grindlay J.E., Hertz P., 1981, ApJ, 233, L51
- [] Hannikainen D.C., Hunstead R.W., Campbell-Wilson D., Sood R.K., 1998, A&A, 337,460
- [] Hasinger G., van der Klis M., 1989, A&A, 225, 79
- [] Hjellming R.M., Han X.H., 1995, in Lewin W.H.G., van Paradijs J., van den Heuvel E.P.J., eds, X-ray binaries, CUP, p.308
- [] Hoffman J.A., Lewin W.H.G., Doty J., Hearn D.R., Clark G.W., Jernigan G., Li F.K., 1976, ApJ, 210, L13
- [] Hoffman J.A., et al., 1979, ApJ, 233, L51
- [] Kuulkers E., den Hartog P.R., in ’t Zand J.J.M., Verbunt F.W.M., Harris W.E., Cocchi M., 2002, A&A, accepted, astro-ph/0212028
- [] Leahy, D.A., Darbro, W., Elsner, R.F., Weisskopf, M.C., Kahn, S., Sutherland, P.G., Grindlay, J.E., 1983, ApJ, 266, 160
- [] Lewin W.H.G., Clark G.W., Doty J., 1976, IAU Circ., 2922
- [] Miller, M.C., Lamb, F.K., Psaltis, D., 1998, ApJ, 508, 791
- [] Martí J., Mirabel I.F., Rodríguez L.F., Chaty S., 1998, A&A, 332, L45
- [] Méndez M., van der Klis M., Ford E.C., 2001, ApJ, 561, 1016
- [] Méndez M., van der Klis M., 1999, ApJ, 517, L51
- [] Méndez M., van der Klis M., Ford E.C., Wijnands R., van Paradijs J., 1999, ApJ, 511, L49
- [] Muno M.P., Remillard R.A., Morgan E.H., Waltman E.B., Dhawan V., Hjellming R.M., Pooley G., 2001, ApJ, 556, 515
- [] Penninx et al., 1988, Nature, 336, 146
- [] van der Klis M., 2001, ApJ, 561, 943
- [] van der Klis M., 2000, ARA&A, 38, 717
- [] van der Klis M., 1994, ApJSS, 92, 511
- [] van Straaten S., van der Klis M., Di Salvo T., Belloni T., ApJ, 568, 912
- [] van Straaten S., van der Klis M., Méndez M., ApJ, submitted
- [] Zhang W., Jahoda K., Swank J.H., Morgan E.H., Giles A.B., 1995, ApJ, 449, 930