Symmetry Parameters of CSS Sources: Evidence of Fuelling?
Abstract
The compact steep spectrum (CSS) and gigahertz peaked spectrum (GPS) sources are widely believed to be young radio sources, with ages 106 yr. If the activity in the nucleus is fuelled by the supply of gas, one might find evidence of this gas by studying the structural and polarisation characteristics of CSS sources and their evolution through this gas. In this paper we discuss some of the possible ‘smoking-gun’ evidence of this gas which may have triggered and fuelled the radio source.
1 NCRA, TIFR, Post Bag No. 3, Ganeshkhind, Pune 411 007, India
djs@ncra.tifr.res.in
2 Physikalisches Institut, Universität zu Köln, 50937 Köln, Germany
jeyaks@ph1.uni-koeln.de
3 Istituto di Radioastronomia, CNR, Via P. Gobetti 101, I-40129 Bologna, Italy
fmantova@ira.cnr.it
4 Arecibo Observatory, HC3 Box 53995, Arecibo, PR 00612, USA
csalter@naic.edu
5 Jodrell Bank Observatory, Macclesfield, Cheshire SK11 9DL, UK
pt@jb.man.ac.uk, res@jb.man.ac.uk
6 Georgia State University, Atlanta GA 30303-3083, USA
wiita@chara.gsu.edu
Keywords: galaxies: active — quasars: general — radio continuum: galaxies
1 Introduction
There is a consensus of opinion that the compact steep spectrum (CSS) and gigahertz peaked spectrum (GPS) sources are young objects seen at an early stage of their evolution. Recent measurements of component advance speeds for a few very compact sources yield ages of about 103 yr (Owsianik & Conway 1998; Taylor et al. 2000). Spectral studies of CSS sources suggest ages 105 yr (Murgia et al. 1999). Models have been constructed for the evolution of extragalactic radio sources from the most compact symmetric objects, christened CSOs, to the medium symmetric objects (MSOs) and later on to the standard FR II radio sources (e.g. Carvalho 1985; Fanti et al. 1995; Readhead et al. 1996; O’Dea 1998 and references therein). Numerical simulations of jet propagation can reproduce these evolutionary steps (e.g. De Young 1997). Evolutionary scenarios for CSOs constrained by their self-similar evolution (Jeyakumar & Saikia 2000) and dependence of radio luminosity on linear size (Snellen et al. 2000) have also been explored (Perucho & Martí 2002).
An interesting related question is the fuelling of these young radio sources, possibly due to the infall of gas to the central regions due to interacting companions and mergers. Detailed calculations (e.g. Hernquist & Mihos 1995) showed that following a merger the infall of interstellar matter into the central few hundred pc takes place over a time scale of 108 yr. In such a situation, it should be possible to find evidence of this infalling material by following the evolution of the radio components in these young radio sources as they advance outwards and interact with this material.


2 Symmetry Parameters
2.1 Arm-Length and Flux Density Ratio
One straightforward test is to examine the symmetry parameters, namely the arm-length or separation ratio, rD, of the outer lobes from the nucleus, and the flux density ratio, rL, of the lobes. In order to estimate reliably the separation ratio, rD, one also needs to identify the radio core or nuclear component. Of the initially symmetric but oppositely-directed radio lobes, the one propagating in the direction of more infalling material will encounter a denser ambient medium, and thus should be both brighter and closer to the nucleus. However, this test is unlikely to be a sharp one because the infalling material or a merging galaxy is likely to cover only a relatively small solid angle, depending on its size and separation from the nucleus. The symmetry parameters would also depend on the orientation, bulk relativistic motion and evolution of the individual components.
The distributions of rD, defined to be 1, for a sample of 109 FR II sources from the 3CRR and S4 samples of radio sources with a radio luminosity at 178 MHz W Hz-1 sr-1 (Ho = 100 km s-1 Mpc-1 and qo = 0) and a detected radio core are shown in Figure 1. A CSS source is defined to be 20 kpc in size. However, any limiting value is likely to be somewhat ad hoc, and one could sometimes find evidence of interactions in larger sources as well. The CSS sources associated with both radio galaxies and quasars have flatter distributions with higher median values, indicating their evolution in an asymmetric environment (cf. Saikia et al. 2001). The median value of rD for the CSS galaxies is while the value for the larger galaxies is only 1.3. The corresponding values for the quasars are 1.7 and 1.5 respectively. The tendency for smaller sources to be more asymmetric was also reported by Arshakian & Longair (2000). The deficit of very symmetric quasars is due to their orientation close to the line of sight. In the rD–rL diagram for this sample (Figure 1, right), the nearer component is brighter for sources with rL1, and these have possibly encountered an asymmetric environment. Approximately 65% of the galaxies have rL1 compared with 50% for quasars, the difference being due to the smaller orientation angles of quasars. Considering only those with rL1, the median value of rL is 0.4 for CSS sources and close to 0.6 for the larger objects, suggesting again that the CSS sources are evolving in a more asymmetric environment.
2.2 Highly Asymmetric Individual Sources
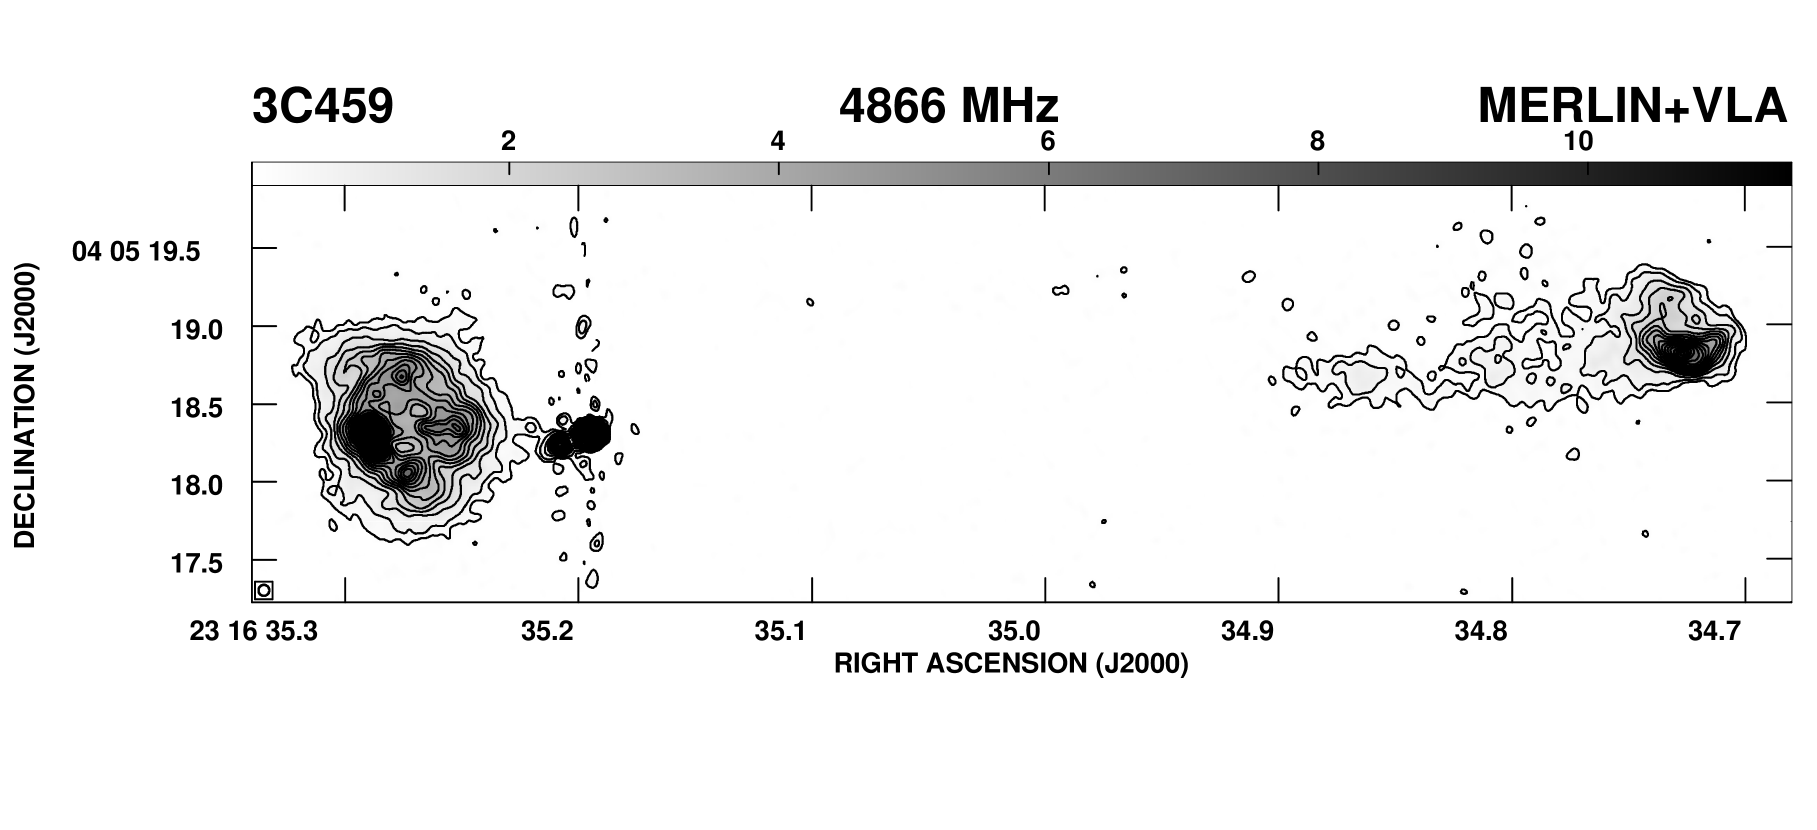
In this section, steep spectrum sources with large arm-length or separation ratios (rD4) are discussed. One of the most asymmetric CSS sources is the radio galaxy 3C 459, with the ratio of separations of the outer hot spots, rD, being 5 and the corresponding flux density ratio, rL, of the oppositely-directed lobes being 0.45 and 0.3 at 5 and 1.7 GHz respectively. High-resolution radio images of this source have been produced recently by Thomasson, Saikia, & Muxlow (2003). Their MERLIN+VLA image of the source is shown in Figure 2. The eastern component, which is brighter, closer to the nucleus and more strongly depolarised is interacting with denser gas. 3C 459 has a young stellar population and high infrared luminosity, and may have undergone a recent starburst, possibly triggered by the merging of a companion galaxy (Tadhunter et al. 2002, and references therein). An HST image of the galaxy shows evidence of filamentary structures, which are possibly of tidal origin, and a prominent peak of emission close to that of the nucleus of this N-galaxy, which could be due to a galaxy in the late stages of merging (Thomasson et al. 2003).
From the compilation of symmetry parameters of high-luminosity 3CRR and S4 sources (Figure 1), there are only two objects with a separation ratio 4, namely 3C 254 and the CSS source B0428+205. 3C 254 is associated with a quasar at a redshift of 0.734 with rD=6.95 and rL=0.77 (Owen & Puschell 1984; P. Thomasson et al., in preparation). Optical line and continuum imaging of this source shows an extended emission line region with the lobe on the nearer side interacting with a cloud of gas (Bremer 1997; Crawford & Vanderriest 1997). Although the flux density of the nearer lobe is brighter, the ratio is modest, which could be a consequence of relativistic beaming of the hot spot further from the nucleus. The CSS object B0428+205, which has a largest angular size of only 250 mas, is associated with a galaxy at a redshift of 0.219 with rD=4.69 and rL=0.16 (Dallacasa et al. 1995), consistent with a high dissipation of energy on the side where the jet interacts with a dense cloud. Another example of a source with such a high degree of positional asymmetry is the quasar 3C 2 at a redshift of 1.037 for which rD=4.7 and r0.25 (Saikia, Salter, & Muxlow 1987). There is an indication of a radio jet extending from the core to the northern lobe. Depolarisation gradients in both the lobes suggest interaction with the external medium, but the northern lobe seems to be more significantly affected.
In the compilation of McCarthy, van Breugel, & Kapahi (1991), there are only four galaxies with r 4, namely, 3C 99, 3C 208.1, 3C 459, and 3C 460. All these sources exhibit a large asymmetry in their flux density ratio, with the brighter lobe being closer to the nucleus. In the case of 3C 460, where they detect significant extended emission line gas, the surface brightness of this gas is much higher on the side of the lobe closer to the nucleus. The radio galaxy 3C 99 is similar to 3C 459 in that it also has a steep spectrum radio core which was resolved by the EVN and shows multiple components. Its value of rD=4.8, while r0.04 and 0.03 at 5 and 1.7 GHz respectively, is consistent with the possibility that the jet on the side of the nearer lobe is interacting with denser gas. Optical spectroscopic observations along the axis of the source do indeed show that the gas on the side of the nearer component is blueshifted while that on the opposite side is redshifted relative to the galaxy. The blueshifted gas is possibly being pushed towards us by interaction with the radio jet (Mantovani et al. 1990).
2.3 Flux Density Asymmetry for a Larger Sample
The flux density ratio alone could be examined for a larger sample of sources since here one does not require the detection of a radio core. Towards this end, a sample of sources of intermediate strength selected from the 408 MHz Bologna B2.1 catalogue (Colla et al. 1970) has been observed with the VLA A–array (Saikia et al. 2002). The sample consists of 52 objects which satisfy the following criteria. They lie within the region, 23h 30m RA(B1950) 2h 30m and 29∘ 18′ dec(B1950) 34∘ 02′, with their flux densities in the range 0.9S4082.5 Jy. Of these 52, 19 candidate CSS sources have been observed with the VLA A–array at 4835 MHz. A few of the radio images are shown in Figure 3. In addition to this sample, the CSS sources from the B3+VLA sample observed by Fanti et al. (2001) and the 3CRR sources have also been considered.


The B2 sample: Considering the steep spectrum, double-lobed B2 sources, the ‘small-source’ sample is defined to consist of those with an LAS 10 arcsec. The remaining objects constitute the ‘large-source’ sample. The median angular size of the ‘small-source’ sample is 4 arcsec compared with 40 arcsec for the larger sources. The flux density ratio of the oppositely directed lobes, rL, has been estimated from either our observations or from those in the literature. rL ranges from 1.4 to 20 for the small-source sample, and has a median value of 2, while for the large-source sample, rL ranges from 1.0 to 7, with a median value of 1.4 (Figure 4, left).
A significant fraction of the small sources show large asymmetries. Defining a very asymmetric source to be one with rL 5, we find that 5 of the 12 small-sized objects (40%) are highly asymmetric, while only one of the 22 (5%) objects in the large-source B2 sample has rL 5.


The 3CRR sample: It is of interest to compare this with earlier studies of the flux density ratio for sources in the well-known 3CRR sample. For the 3CRR sources studied by Saikia et al. (2001), which were confined to the high-luminosity FR II sources, the median values of rL for the CSS sources and the large sources are 2 and 1.8 respectively (Figure 4, right). This is similar to the values for the B2 sources. The distribution for the CSS sources again appears to have a number of very asymmetric sources with three of the 13 sources ( 23%) having a value of rL5, whereas only five of the 75 (7%) non-CSS 3CRR sources exhibit such a high degree of asymmetry.
The B3 CSS sources: The above result has also been compared with that derived from a sample of CSS sources selected from the B3–VLA sample with S408 0.8 Jy (Fanti et al. 2001). Considering all the doubles, plus the collinear triple, 0744+464, which has a weak central component, the median value of rL for the B3–VLA CSS sample is 2.4, with eight of the 39 objects (21%) having a value of rL 5 (Figure 5, left). This is consistent with the results for the B2 and 3CRR samples.
Considering the B2, 3CRR, and B3–VLA samples together, a Kolmogorov-Smirnov test shows the distributions for the CSS and larger sources to be different at a confidence level of greater than 99%. However, if the most asymmetric objects, i.e., those with rL5, are excluded, the distributions for the rest of the sources are not significantly different. The fraction of such asymmetric sources for the combined sample is 25% for the CSS sources and 6% for the larger sources. The increased fraction for the CSS sources is possibly due to interaction of one of the jets with a dense cloud on one side of the nucleus. These density asymmetries might be intimately related to the infall of gas which fuels the radio source. Assuming the typical distances of these clouds of gas from the nucleus of the galaxy to be about 5 to 10 kpc, the covering factor estimated from the fraction of very asymmetric sources suggests that the sizes of the ‘clouds’ are similar to those of dwarf galaxies (e.g. Swaters 1999). There could, of course, be a larger number of smaller clouds. However, if the clouds are too small or are of relatively small mass, they are unlikely to significantly affect the propagation of the jet (e.g. Wang, Wiita, & Hooda 2000).
The flux density ratio–redshift diagram: It is also of interest to enquire whether the brightness asymmetries of CSS sources depend on cosmic epoch because of a larger incidence of interactions and mergers in the past (Ellis et al. 2000). The rL–redshift diagram for the 43 CSS sources with measured or estimated redshifts from the combined sample (Figure 5, right) shows no significant dependence on redshift. This suggests that although interactions and mergers may increase with redshift globally, the flux density asymmetries in the CSS objects, which are possibly young and still being fuelled by the infall of gas, are similar at different redshifts.


2.4 Polarisation Measurements
Evidence of the gas which fuels the radio source may also be probed via polarisation measurements (cf. Saikia & Salter 1988; van Breugel et al. 1992; Akujor & Garrington 1995). In a double-lobed radio source, the component interacting with the dense gas should normally both exhibit a higher rotation measure (RM) and also depolarise more rapidly than the component advancing through the more tenuous medium. Although there have been very few studies of RM determinations in CSS and GPS objects, partly due to their low levels of polarisation, such studies have sometimes revealed striking differences in the RM on opposite sides of the nucleus. Detailed polarisation observations of 3C 147 show huge differential RMs between the two oppositely directed lobes, suggesting their evolution in an asymmetric environment (Junor et al. 1999). A similar situation is also seen in the quasar 0725147 (Mantovani et al. 1994). These asymmetries in the central regions of active galaxies must be intimately related to the supply of fuel to the central engine in these objects, possibly due to interactions with companion galaxies.
| Source | Opt. Id. | z | Resolution | mwest | meast | mwest/meast |
|---|---|---|---|---|---|---|
| B0707+689 | Q | 1.141 | 0.′′580.′′35 along 5∘ | 2.61 | 0.23 | 11.3 |
| B2311+469 | Q | 0.742 | 0.′′510.′′34 along 155∘ | 9.72 | 0.20 | 48.6 |
In the absence of RM determinations, one can also examine the asymmetry in the polarisation of the two oppositely directed lobes of radio emission. A sample of CSS sources has been observed with the VLA to determine the asymmetry in the polarisation of the oppositely-directed lobes (D.J. Saikia et al., in preparation). Two of these sources are presented in Figure 6, and their polarisation parameters are listed in Table 1. The median value of the ratio of the degree of polarisation of the oppositely-directed lobes at 6 or 3.6 cm is 6 for the CSS objects compared with 1.5 for the larger sources. A Kolmogorov-Smirnov test shows the two populations to be different at a significance level of 99.9%. This high degree of polarisation asymmetry is also likely to be due to interactions with dense clouds of gas which could either compress magnetic fields, increasing the degree of polarisation, or else depolarise the emission. The degree of polarisation asymmetry is much higher than due to the Laing–Garrington effect (Laing 1988; Garrington et al. 1988). In a number of cases, it is the jet side which is more strongly depolarised (e.g. 3C 459) or has a much higher RM (e.g. 3C 147). Also, the typical core radii of the halos which cause the Laing-Garrington effect is 100 kpc, which will cause only marginal polarisation asymmetry on the scale of the CSS objects (cf. Garrington & Conway 1991).
3 Numerical Simulation
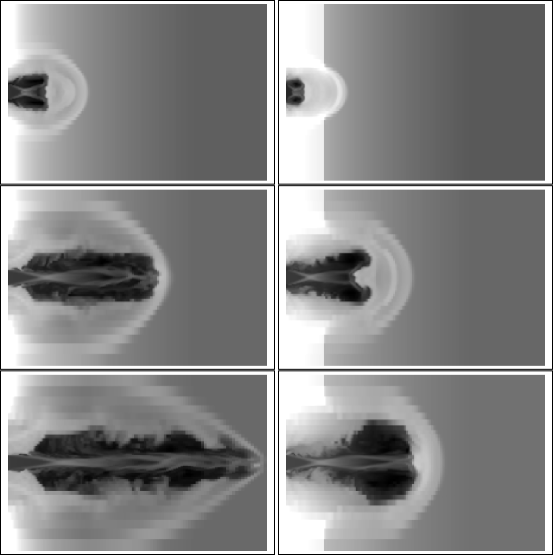
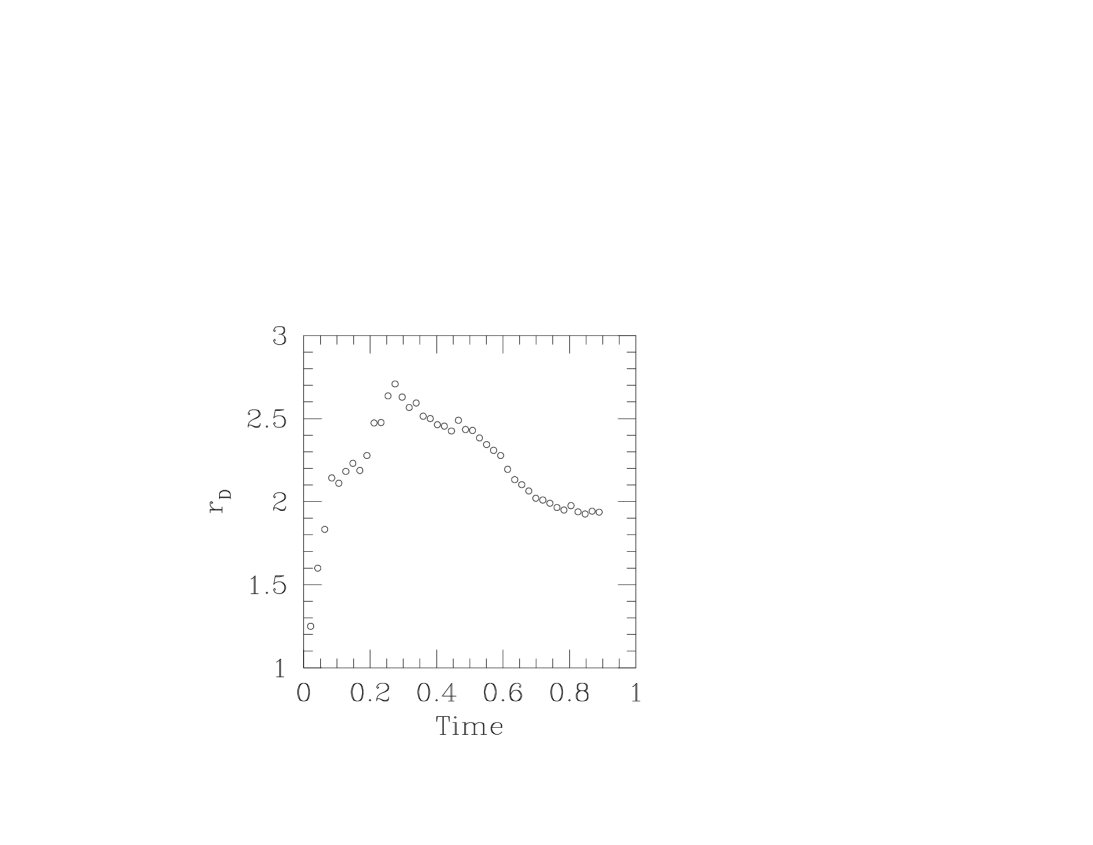
We have attempted to understand the evolution of CSS sources through an asymmetric environment in the nuclear region by calculating analytical models (Saikia et al. 1996) as well as performing two- and three-dimensional simulations (Figure 7) of the propagation of jets through asymmetric environments (Jeyakumar et al. in preparation). In this study, intrinsically similar jets with external Mach numbers of 26.0 propagate through ambient media with different gas distributions in the inner 5 kpc; at first the bow shocks run substantially ahead of the jet working surfaces. The jet propagating through the less dense material naturally emerges faster, and the value of rD rises quickly; it later declines as the jets traverse identical media further out (Figure 8). The numerical simulations qualitatively agree with the analytical models and support the hypothesis that CSS sources show greater asymmetries than do FR IIs predominantly because ambient gas asymmetries (the AGN fuel?) are concentrated in the inner portions of the galaxies.
References
Akujor, C.E., & Garrington, S.T. 1995, A&AS, 112, 235
Arshakian, T.G., & Longair, M.S. 2000, MNRAS, 311, 846
Bremer, M.N. 1997, MNRAS, 284, 126
Carvalho, J.C. 1985, MNRAS, 215, 463
Colla, G., et al. 1970, A&AS, 1, 281
Crawford, C.S., & Vanderriest, C. 1997, MNRAS, 285, 580
Dallacasa, D., Fanti, C., Fanti, R., Schilizzi, R.T., & Spencer, R.E. 1995, A&A, 295, 27
De Young, D.S. 1997, ApJ, 490, 55L
Ellis, R.S., Abraham, R.G., Brinchmann, J., & Menanteau, F. 2000, A&G, No. 2, 10
Fanti, C., Fanti, R., Dallacasa, D., Schilizzi, R.T., Spencer, R.E., & Stanghellini, C. 1995, A&A, 302, 317
Fanti, C., Pozzi, F., Dallacasa, D., Fanti, R., Gregorini, L., Stanghellini, C., & Vigotti, M. 2001, A&A, 369, 380
Garrington, S.T., & Conway, R.G. 1991, MNRAS, 250, 198
Garrington, S.T., Leahy, J.P., Conway, R.G., & Laing, R.A. 1988, Nature, 331, 147
Hernquist, L., & Mihos, J.C. 1995, ApJ, 448, 41
Jeyakumar, S., & Saikia, D.J. 2000, MNRAS, 311, 397
Junor, W., Salter, C., Saikia, D., Mantovani, F., & Peck, A. 1999, MNRAS, 308, 955
Laing, R.A. 1988, Nature, 331, 149
Mantovani, F., Junor, W., Fanti, R., Padrielli, L., & Saikia, D.J. 1994, A&A, 292, 59
Mantovani, F., Saikia, D.J., Browne, I.W.A., Fanti, R., Muxlow, T.W.B., & Padrielli, L. 1990, MNRAS, 245, 427
McCarthy, P.J., van Breugel, W., & Kapahi, V.K. 1991, ApJ, 371, 478
Murgia, M., Fanti, C., Fanti, R., Gregorini, L., Klein, U., Mack, K.-H., & Vigotti, M. 1999, A&A, 345, 769
O’Dea, C.P. 1998, PASP, 110, 493
Owen, F.N., & Puschell, J.J. 1984, AJ, 89, 932
Owsianik, I., & Conway, J.E. 1998, A&A, 337, 69
Perucho, M., & Martí, J.M. 2002, ApJ, 568, 639
Readhead, A., Taylor, G., Pearson, T., & Wilkinson, P. 1996, ApJ, 460, 634
Saikia, D.J., & Salter, C.J., 1988, ARA&A, 26, 93
Saikia, D.J., Salter, C.J., & Muxlow, T.W.B. 1987, MNRAS, 224, 911
Saikia, D.J., Jeyakumar, S., Wiita, P.J., & Hooda, J.S. 1996 in The Second Workshop on GPS and CSS Sources, ed. I.A.G. Snellen et al. (Leiden: Leiden Observatory), 252
Saikia, D.J., Jeyakumar, S., Salter, C.J., Thomasson, P., Spencer, R.E., & Mantovani, F. 2001, MNRAS, 321, 37
Saikia, D.J., Thomasson, P., Spencer, R.E., Mantovani, F., Salter, C.J., & Jeyakumar, S. 2002, A&A, 391, 149
Snellen, I.A.G., Schilizzi, R.T., Miley, G.K., de Bruyn, A.G., Bremer, M.N., & Röttgering, H.J.A. 2000, MNRAS, 319, 445
Swaters, R.A. 1999, PhD thesis, Rijksuniversiteit Groningen
Tadhunter C., Dickson R., Morganti R., Robinson, T.G., Wills, K., Villar-Martin, M., & Hughes, M. 2002, MNRAS, 330, 997
Taylor, G.B., Marr, J.M., Pearson, T.J., & Readhead, A.C.S. 2000, ApJ, 541, 112
Thomasson, P., Saikia, D.J., & Muxlow, T.W.B. 2002, MNRAS, 341, 91
van Breugel, W.J.M., Fanti, C., Fanti, R., Stanghellini, C., Schilizzi, R.T., & Spencer, R.E. 1992, A&A, 256, 56
Wang, Z., Wiita, P.J., & Hooda, J.S. 2000, ApJ, 534, 201