The Faint Cepheids of the Small Magellanic Cloud: an evolutionary selection effect?
Two problems about the faintest Small Magellanic Cloud (SMC) Cepheids are addressed. On one hand evolutionary tracks fail to cross the Cepheid Instability Strip for the highest magnitudes (i.e. I-mag) where Cepheids are observed; Mass-Luminosity relations (ML) obtained from evolutionary tracks disagree with Mass-Luminosity relations derived from observations. We find that the above failures concern models built with standard input physics as well as with non-standard ones. The present work suggests that towards highest magnitudes, Cepheids stars undergo a selection effect caused by evolution: only the most metal poor stars cross the Instability Strip during the “blue loop” phase and are therefore the only ones which can be observed at low luminosity. This solution enables us to reproduce the shape of the lower part of the Instability Strip and improves the agreement between observed and theoretical ML-relations. Some issues are discussed, among them Beat Cepheids results argue strongly in favor of our hypothesis.
Key Words.:
– galaxies: SMC – stars: evolution, variables1 Introduction
Cepheids are variable stars located in the Color-Magnitude diagram (CM-diagram ) within the Instability Strip (IS) where pulsation phenomena take place via the mechanism. Cepheid masses approximately range between and . During the past decade, microlensing experiments as MACHO111http://wwwmacho.mcmaster.ca, EROS222http://www.lal.in2p3.fr/recherche/eros, MOA333http://www.phys.vuw.ac.nz or OGLE 444http://www.astrouw.edu.pl/~ogle/ have produced a huge flow of data. As by-products of these observational programs, a large number of new variable stars, and among them, Cepheids have been detected. OGLE 2 data provide a large and high quality sample of Cepheids belonging to the Small Magellanic Cloud (SMC) which we consider in this work. This extended and homogeneous data set has already put several shortcomings of the SMC Cepheid modeling into light:
(1) the evolutionary tracks built with standard input physics and for a chemical composition () as usually assumed for the SMC fail to reproduce the observed Cepheid position within the CM-diagram for highest magnitudes (i.e. mag);
(2) the Mass-Luminosity relation ( hereafter) derived from pulsation properties (see Beaulieu et al. 2001) and ML-relation from evolutionary tracks ( hereafter) do not agree.
The first problem arises because theoretical “blue loops” do not cross the observed IS over the whole Cepheid mass range. Indeed an evolutionary track for a mass about 5 crosses observed IS three times, the first time (“first crossing”) is the faster one -e.g. Myr for an 5 model-, the second time (“second crossing”) is the slower -e.g. Myr- and the third time (“third crossing”) remains short, about Myr. These time scale considerations tell us that the majority of the observed objects should be in the second crossing stage. During this phase, the star burns He in its inner regions. Third and second crossing both belong to the so-called “blue loop” excursion towards the blue side of Hertzsprung Russell (HR) diagram. Consequently theoretical blue loops should cross the observed IS for the entire Cepheid mass range. As we confirm in the first part of this work, theoretical tracks with standard physics and free parameters varied in a reasonable range are not able to provide blue loops which reach the observed SMC Cepheids at low magnitude, i.e. they are not able to model the low luminosity Cepheids in the SMC case.
The second problem has been underlined -among others- by Beaulieu et al. (2001) who found a strong disagreement between the Mass-Luminosity relation and in the SMC case. They determine a for the LMC and SMC using pulsation calculations, independently from evolutionary calculations: for a given Cepheid the mass and the luminosity are found iteratively solving an equation of the type , where is the observed period ( for fundamental pulsators and first overtone ones) and the theoretical one calculated with a pulsation code. The results of Beaulieu et al. (2001) are based on calculations that assume a metallicity content which is usually assumed to represent the mean metallicity of the SMC.
We are therefore led, in the second part of this paper, to propose another possibility and show that it can reconcile both issues: the blue loops at low mass and the Mass-Luminosity relation problem. In our hypothesis no high magnitude (i.e. with a mass around ) SMC Cepheids with a metallicity as high as the mean SMC value can exist because the evolution does not bring these stars far enough on the blue side to cross the instability strip. The observed high magnitude SMC Cepheids must therefore be undermetallic (i.e. ) with respect to the mean SMC metallicity (i.e. ).
In Sect. 2 we recall the physical inputs used in our standard models, which are similar to what is found in the recent literature. We next compare our evolutionary tracks with OGLE 2 observed Cepheids within a -diagram. Following a method similar to that used by Beaulieu et al. (2001), we also compare and . In both cases we confirm the discrepancy.
In Sect. 3 we discuss the above issues in view of the uncertainties of the standard models and discuss the effect of non-standard physics in cases when models including such physics are available. In Sect. 4 we compare models calculated with with observations. Sect. 5 is devoted to discussion about the possibility of the existence of SMC low luminosity Cepheids with metallicity as low as .
2 Standard models versus observations
2.1 Inputs for Standard evolutionary models
Our evolutionary models are built with the 1D Henyey type code CESAM555CESAM : Code d’Evolution Stellaire Adaptatif et Modulaire originally written by Morel (1997) in which we brought several improvements.
The equation of state is from Eggleton et al. (1973) and the external boundary condition is defined in a simplified model atmosphere involving the Eddington law. The nuclear network involves 30 nuclear reactions, we have followed Schaller et al. (1992) who used the same network as in Maeder (1983) for H-burning and Maeder & Meynet (1987) He-burning network supplemented with the reaction. Nuclear reaction rates are from Caughlan & Fowler (1988) excepted , from Caughlan et al. (1985) and from Landré et al. (1990). More recent nuclear rates do exist: NACRE by Angulo et al. (1999), however adopted rate for is quite similar to NACRE one (a factor of about two higher than Caughlan & Fowler (1988) and about 80% of Caughlan & Fowler (1988) one.
The adopted mean chemical composition for the SMC is taken as , and , corresponding to a metal to helium enrichment of (see for instance Peimbert et al. (2000)), to a primordial helium (Izotov et al. 1997) and to (Luck et al. 1998). Elemental abundances correspond to the Grevesse & Noels (1993) (GN93) mixture consistent with OPAL96 calculations.
Opacities are from Iglesias & Rogers (1996) (OPAL96) for high temperatures ( K) and Alexander & Ferguson (1994) for cooler domains. We stress that the central chemical composition during the He burning phase differs strongly from GN93 (e.g. 50 % of and 50 % of ). Thus we have use opacity tables allowing a variable composition in and with the aim of modeling the core as realistically as possible. These tables have been built with Magee et al. (1995) elemental opacities (Los Alamos).
The convective flux is computed according to the prescription of the Mixing Length Theory (Böhm-Vitense 1958). The mixing length value -derived from solar calibration- is equal to 1.6 . We used Schwarzschild’s criterion to decide if the energy transport is radiative or convective, and an extra mixing zone is added above the convective core (i.e. overshooting). The extension of this zone is taken to be ().
For the transformation of theoretical quantities, (,
) into absolute magnitudes and colors, we used
the Basel Stellar Library (BaSeL, version 2.2)
of Lejeune et al. (1998) which provides color-calibrated theoretical
flux distributions for the largest possible range of fundamental
stellar parameters, (2000 K to 50,000 K), (-1.0
to 5.5), and (-5.0 to +1.0).
2.2 Comparison between models and observations: the “Blue Loop problem”
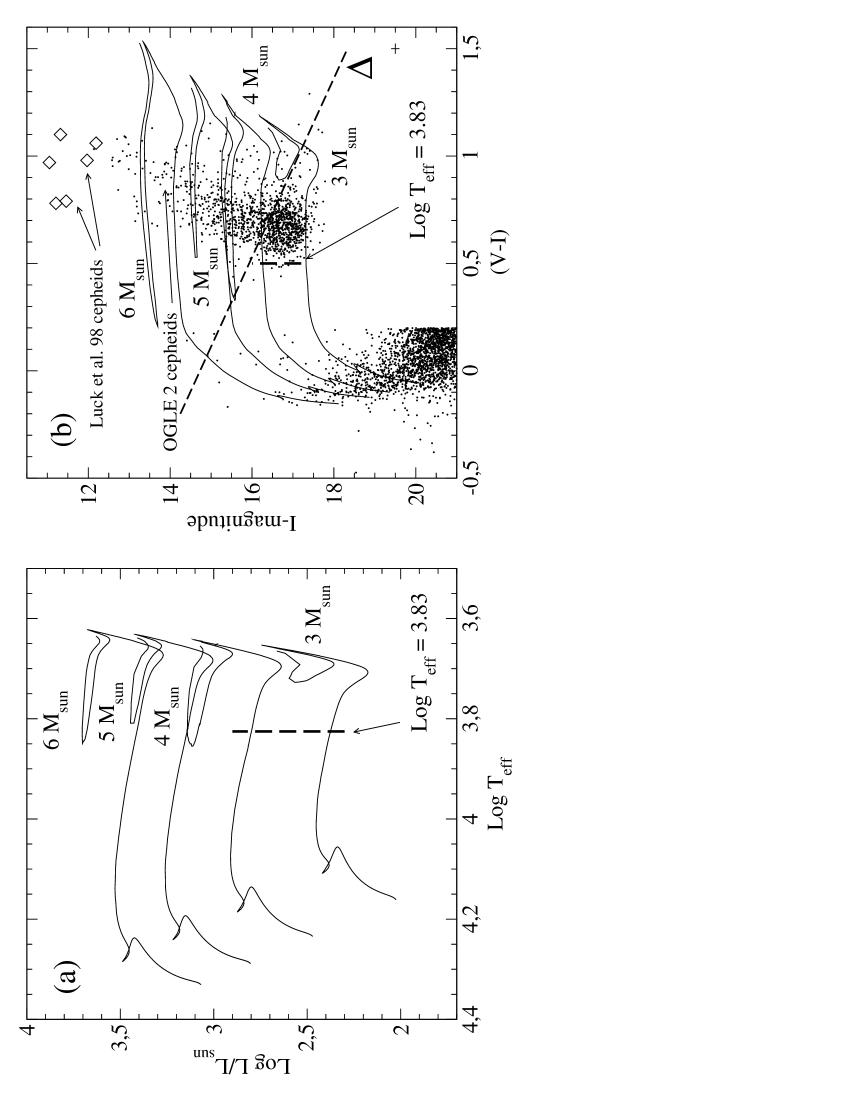
Cepheids data are from Udalski et al. (1999). We have chosen to work with colors for which more data are available. Fundamental and first overtone Cepheids are plotted in Fig. 1(b). A mean reddening is taken from Udalski (1998), . The SMC distance modulus is fixed at from Laney & Stobie (1994) with an internal error of , this is a well accepted value, e.g. Groenewegen (2000) found or depending on the photometric band.
In both figures (Fig. 1(a) and Fig. 1(b)) evolutionary tracks involving standard input physics are displayed. Fig 1(a) is a HR-diagram showing versus . A segment of a line shows the temperature which should be reached -according to OGLE observations- by the evolutionary tracks for a stellar mass of about 3 ; we will mention this mark in further discussions. An estimation of the uncertainties is also plotted in Fig. 1(b): we estimate the error on the colors to be roughly 30% of (which is the typical variation of reddening within the sample) and assess an error of dex on -magnitude which roughly represents the distance modulus uncertainty.
The general characteristics of these theoretical diagrams are similar to those shown by several groups like Geneva one, see Charbonnel et al. (1993). This is not surprising because these authors have used similar physical inputs. For instance, the effective temperature at the tip of our 3 blue loop is which compares well with Charbonnel et al. (1993) . In all cases, the value is far from the required one of about , i.e. a temperature hotter by K.
The main features put in evidence in Fig 1 are:
(1) the main sequence position seems to be reasonably well reproduced by the models
(2) the position of the blue tip of the 3 blue loop is too red. For an -magnitude corresponding to a mass of about 3 , we can clearly see a bulge of Cepheids. In fact 93% of fundamental pulsators and 81% of first overtone pulsators are located between and . Such a large amount of objects -statistically significant- cannot be explained solely by first crossing models. Indeed, for a 4.0 standard model, the time spent during the first crossing is Myr while the time it takes for the second and third crossing is Myr. Hence, blue loops should cross the entire observational IS for the lowest masses. The adopted value of distance modulus does not affect this conclusion. Indeed, even if we take extreme evaluations: from Udalski (1998) and from Kovács (2000), the evolutionary track for 3 does not extend through the observational IS.
2.3 Comparison between observed and calculated Mass-Luminosity relations
2.3.1 Deriving Mass-Luminosity Relations from observations
In order to derive a ML-relation from the observations, we use a method very similar to the one used by Beaulieu et al. (2001). For each object we solve iteratively the equation:
| (1) |
where is the observed period value ( for fundamental pulsators and for first overtones) and the theoretical one, computed with the Florida LNA666Linear Non-Adiabatic pulsation code which is a Castor type code (see Castor 1971). During the iterative process, is adjusted in order to match and , for a given iteration is fixed and we solve the following set of equations where the unknowns are :
| (2) | |||
| (3) |
| (4) |
| (5) |
Eq. 2 comes from Kovács (2000) Eq.2, in which we brought absorption corrections. Eq. 3 is the Beaulieu et al.’s Eq.2. Kovács (2000) who made interpolations of Castelli et al. (1997) stellar atmospheres models to convert magnitudes into bolometric and effective temperature into colors. The luminosity is in solar units,
and . The magnitude and color , are from OGLE observations, has been taken equal to consistently with Laney & Stobie (1994). Following Udalski et al. (1999) we took , and .
In order to apply this method one has to select the data. Indeed on the CCD detector,
a Cepheid may be “blended” with another star, the magnitude of the object being
shifted towards lower magnitudes. These “over-luminous” objects lead to wrong
couples (,), therefore it is crucial to reject from
the sample the stars suspected to be blended with other object(s). From
OGLE data we have extracted amplitudes of pulsation in , and bands
and then derived relations. The criterion to suspect
that an object is blended is the following: if a given object has a magnitude lower
than the mean magnitude (at least 0.2 mag lower) given by the law
and an amplitude lower than the mean amplitude given by
relation, this object is rejected.
Moreover we have also rejected some objects which appear to be suspiciously to red.
Finally we retain fundamental pulsators and first overtone pulsators
and obtain similar samples of objects than Beaulieu et al. (2001).
2.3.2 Uncertainties in Derived ML-relations
For years the question of Magellanic Clouds distance has been a subject of debate. There were supporters for “short” distance scales -e.g. Stanek et al. (1998) with mag- and for “long” distance scales -e.g. Laney & Stobie (1994) with mag- Cioni et al. (2000) derived a distance modulus for the LMC mag and Mould et al. (2000) (HST Key Project Team) have adopted mag. We made a test with “short” distance (i.e. mag); this leads to differences in mass of and in luminosity (consistently with Eq. 3). We dismiss these “short” distance scales: (1) whatever is the technics used, recent works seem in agreement with “long” distance scales; (2) a difference in mass of would mean that evolutionary computations would be completely wrong. We stress that Beaulieu et al. (2001) have the same point of view. Therefore we adopted a “long” distance value for the SMC distance modulus: mag; this choice is supported by the recent result of Harries et al. (2003) who found (statistical) (systematic) mag with a technics involving eclipsing binaries.
Whereas the depth of the LMC seems to be negligible (Van der Marel & Cioni 2001); the depth of the SMC has been evaluated to range between and mag (Crowl et al. 2001). Then -for extreme cases- a given object inside the SMC could have an actual distance modulus mag larger or lower than mag, which has to be regarded as an average value. In order to estimate either the influence of an error on or an effect of SMC depth, we have made a test with mag we got and .
Another source of uncertainties is the reddening; if we assume an error of mag on mag, in turn we get a small uncertainty on masses and luminosity: and .
Beside this, uncertainties connected to standardization of OGLE photometry are clearly negligible; with mag we obtained and .
Moreover Beaulieu et al. (2001) made some additional tests: introducing turbulent convection, computing non-linear models or changing the meshes size within models does not yield to periods significantly different from those computed with LNA code. Therefore the uncertainty on distance (error on or effect of SMC depth) remains the most important one.
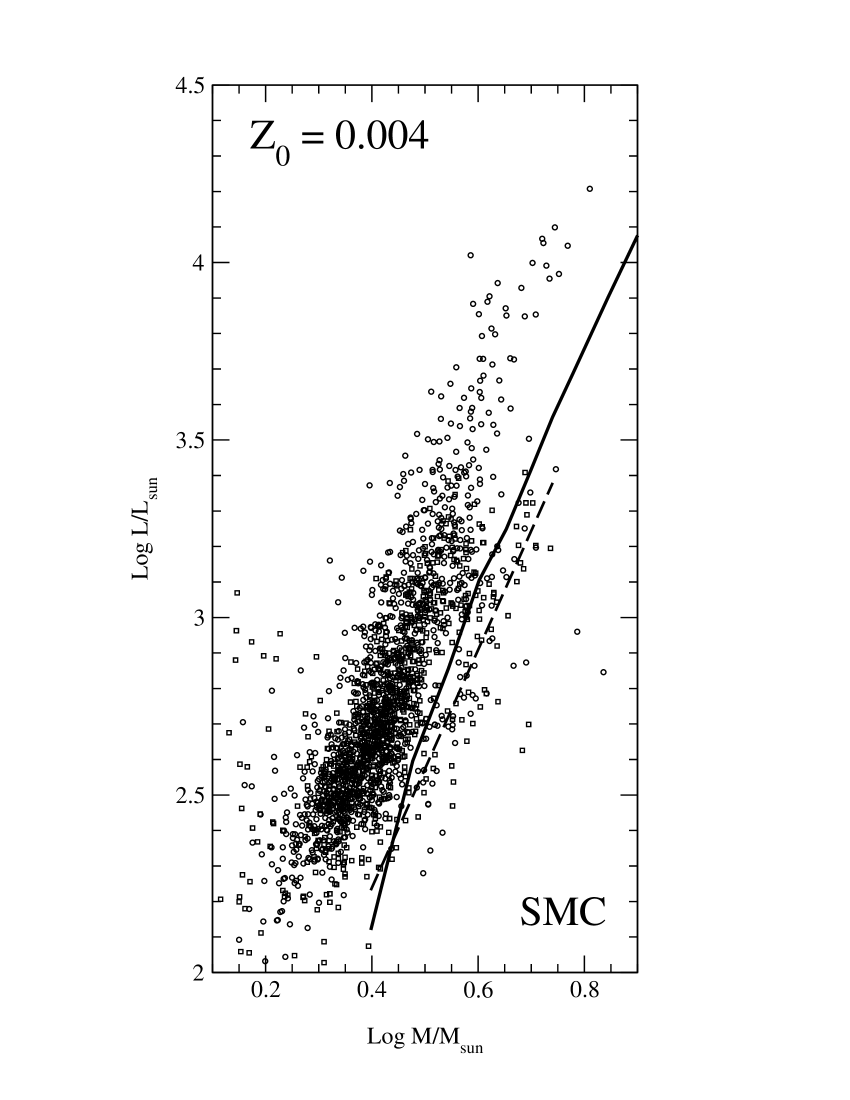
2.3.3 Comparison with ML-relations from evolutionary tracks
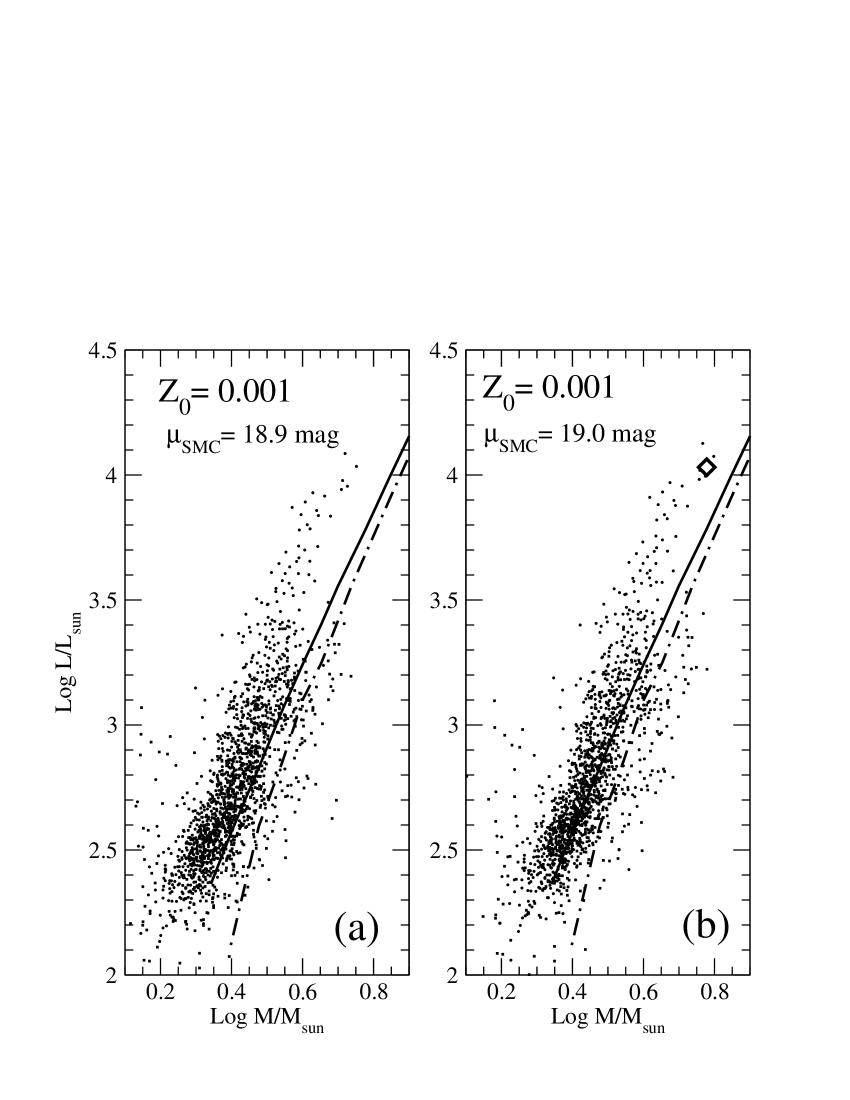
From Fig. 2, we remark a large discrepancy between the ML-relations derived from OGLE observations and from evolutionary calculations. For each evolutionary track, luminosity has been read at the “tip” of the blue loop, locus where the model spent at lot of time. The discrepancy is also found using Bono et al. (2000) mass-luminosity relation. The disagreement is getting worst when decreases. We must however emphasize that for (i.e. ), the evolutionary track does not cross the Cepheid Instability Strip and a comparison between and for has no real meaning. Even an extreme value of -i.e. mag- can not lead to a perfect agreement between all ML-relations.
3 Uncertainties in Standard Evolutionary Models
In this section, we review the factors affecting the blue loop extension. Before presenting any models, we briefly recall a method allowing some predictions about the blue loop extension. We follow the work of Lauterborn et al. (1971)b who have defined an “effective core potential”:
| (6) |
where and are respectively the mass and the radius of the core and a constant. is the width of the zone located between the core and the beginning of the outer chemically homogeneous region. represents the total hydrogen mass fraction variation within . Numerical experiments done by Lauterborn et al. (1971)b have shown that a model undergoes a blue loop if this potential is lower than a critical value . We have to keep in mind this simple result: the lower , the bluer the blue loop tip.
In the next sections, we focus on a track because the most severe discrepancy in the -diagram is observed around this mass.
3.1 Overshooting
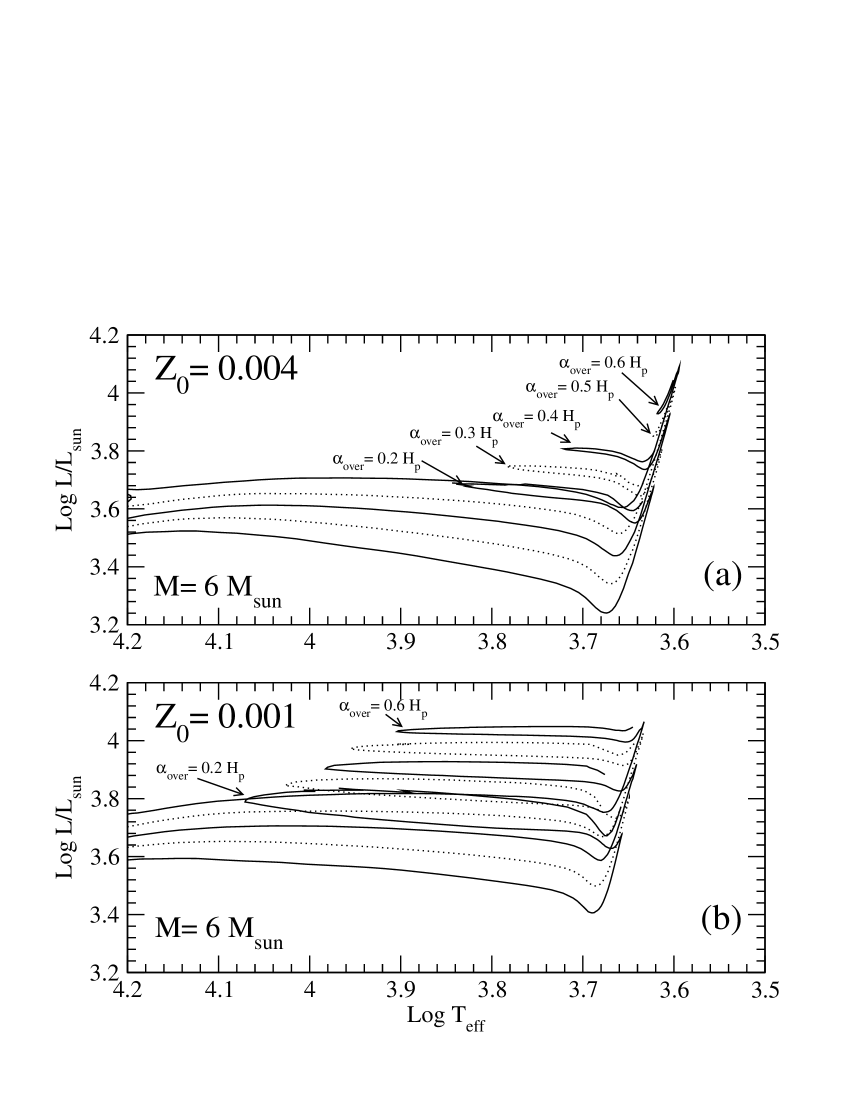
If we reduce the overshooting amount from (“standard value”) to , the core mass decreases as a consequence of the less extended H-core on main sequence. As a consequence, loops more extended toward the blue are expected. This is confirmed in Fig. 3(b) where it clearly appears that even without any overshooting (), a 3 solar masses loop still remains too short to account for the observational data.
3.2 Mixing Length Parameter
The Mixing Length parameter has been so far set equal to 1.6 in our standard models. This value is derived from solar calibration (Lebreton et al. (1999)) and it is probably not universal: it may depend on metallicity, mass, etc … A priori, acts only on the convective flux ( is involved in MLT temperature gradient calculation) and does not change the position of Schwarzschild limit, hence in Eq. 6 should remain unchanged, more blueward loops are not expected. The tracks computed with the extreme values and are plotted in Fig. 3(a). Both tracks have been calculated with which is the most favorable situation as explained in Sect. 3.1.
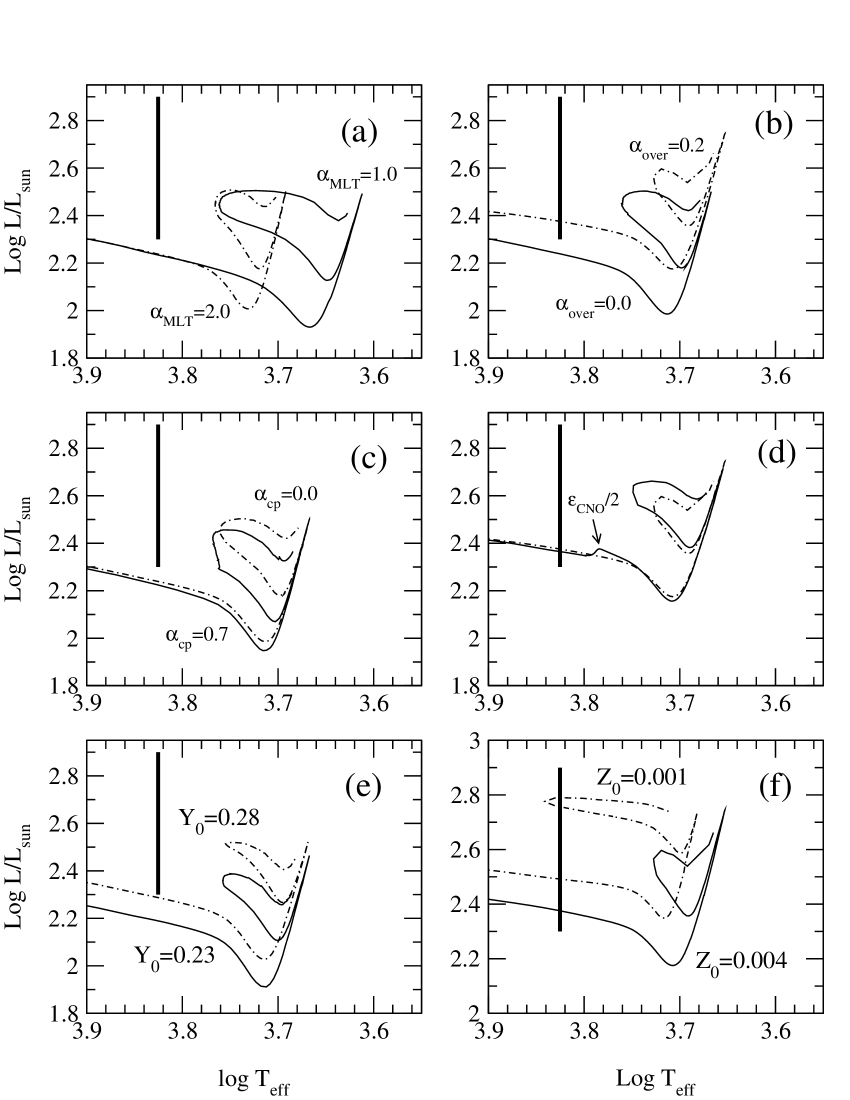
As one can notice has a negligible influence on the blue tip position. The effective temperature of the bluest point of the loop remains approximatively equal to (in Log) which is not enough to reach the warmer edge of the observational IS, it still lacks K. We point out that a value of is very unlike because it leads to a giant branch around where there are no stars within -diagram.
3.3 Convective penetration
Similarly, although not identically as the overshooting process, turbulent eddies must penetrate to some extent downward the convective envelope into stable radiative regions. However, we do not know how far they penetrate.
Here we have carried out a calculation setting the extension of convective penetration at following the Alongi et al. (1991) prescription. They found that this value is needed to reproduce the properties of red giants branch luminosity function. This amount (0.7 ) must be understood as an order of magnitude as Alongi et al. (1991)’s calculations were performed before 1992 when OPAL group published his new opacity tables.
During the giant branch (hereafter GB) episode, the convective penetration produces a deeper penetration of the external convective zone. In this way, in Eq. 6 decreases and yields a lower and bluer loop tip. Evolutionary tracks are displayed in Fig. 3(c) for a 3 without overshooting (i.e. both with ) and show -as expected- that convective penetration slightly extends the loop but not enough to cross the entire IS. The extension difference reaches only a few K, remaining too cold by K.
3.4 Rotation
Maeder & Meynet (2001) present evolutionary tracks including effect of stellar rotation at low metallicity in the mass range 9.0 to 60.0 . The smaller mass value remains in the Cepheid domain. In Fig.6 of Maeder & Meynet (2001) the reader can remark that the blue loop extension is substantially reduced to to () whereas we need . This blue loop reduction is due to the core extra-mixing added by convection equivalent to an overshooting addition.
3.5 Influence of the CNO-cycle energy generation rate
Although the CNO nuclear reactions cycle is rather well known, we have performed evolutionary calculations with an energy generation rate artificially reduced by a factor two, from an arbitrary chosen post-main sequence stage (indicated by an arrow in Fig. 3,d). This magnitude of uncertainty (a factor of two) is extremely large because the consequences during the Main Sequence phase would bring unavoidable disagreements between observations and models.
One can again predict what can be expected from such a numerical experiment. A lower leads to a lower in Eq. 6, thus to a lower and consequently to a bluer loop. Fig. 3(d) confirms this argument. Again, the loop is not extended enough and even an unrealistic uncertainty of a factor of two on the global energy generation rate cannot explain the disagreement between observations and theory.
Enhancing by a factor two the reaction rate, is also found to have a negligible influence on the blue loop extension.
3.6 Effects of helium
The initial helium content adopted, is expected to have only a minor influence on the blue loop extension, indeed:
-
•
the central helium content during the blue loop episode does not depend on the helium content of the initial homogeneous model . Hence does not influence the He-burning energy production rate because within the inner regions (with the central heavy elements mass fraction) whatever the value is.
-
•
during the blue loop the H-burning shell moves through the “-profile” where varies between (boundary of He core) and (chemically homogeneous region mixed during the dredge-up episode when the model is closed to the Red Giants Branch). These Intermediate values are independent of (obviously excepted values closed to itself)
Therefore the influence of on the blue loop extension is expected to be very small. As a verification, models have been calculated with and which represent two extreme values: is a rather low value for primordial helium and which implies while “reasonable” values are around 2, for a review see Luridiana (2002). The tracks with and in (Fig. 3(e)) show that the initial helium content has no influence on the blue loop extension: the effective temperature of the tip remains equal to 3.76, i.e. K colder than blue edge of IS, even in the favorable scheme of zero overshooting.
3.7 Effects of metallicity
The high sensivity of a blue loop extension to metallicity is well known. The physical origin of this phenomenon is in the H-burning shell where material is processed through CNO cycle. For a fixed heavy elements mixture (here GN93) the lower , the lower , , (respectively C, N and O mass fractions) are. These three elements play the same role of catalysts in chemical reactions, therefore a C, N, O deficiency leads to a lower energy generated. Then, in Eq. 6 remains lower for a longer time and one obtains more extended blue loops. On one hand, the H-burning shell drives the star structure on the Giant Branch, on the other hand, during the blue loop episode, the -burning core pulls the model towards the blue edge, where the main sequence is located. The lower , the stronger He central burning effect.
As a confirmation of this high metallicity sensivity, we have computed an evolution at 3 taking a very low value: i.e. which corresponds to . We compare the resulting extensions in Fig. 3(f). The blue loop crosses the entire IS, the tip reaching a position bluer than the blue edge of IS.
Therefore the only way we have found to extend blue loops towards the high temperature edge of the HR diagram is to decrease the metallicity. In the next section we compare observational constraints and models built with .
4 Models with
4.1 Blue loops at
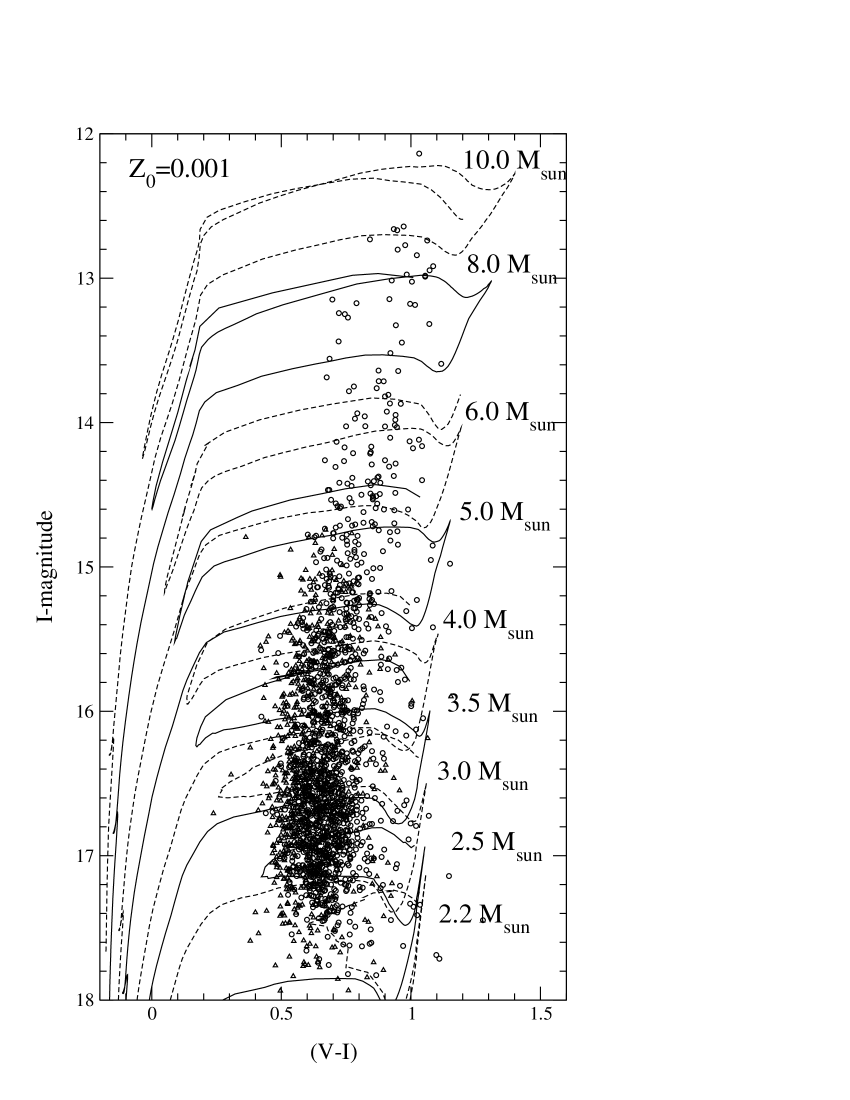
We have calculated a grid of evolutionary tracks at very low metallicity, i.e. . The results are displayed in Fig. 4 where one can remark that the whole observed Instability Strip is crossed by the theoretical tracks, even the fainter part, i.e. the lower region of the color-magnitude diagram. These results suggest that a great part of SMC Cepheids could be metal deficient compared to the mean metallicity of the Small Cloud.
One interesting point is that the shape of the Instability Strip at high magnitude is well reproduced by the decrease of the blue loop extension when going from higher to lower masses.
4.2 Mass-Luminosity relation at
In Fig. 5 we have displayed the Mass-Luminosity relations derived from OGLE observations assuming a metallicity of . Fig. 5b shows a better agreement between and , if we assume mag -consistently with recent determinations- the agreement for low masses is excellent. Unfortunately it remains a discrepancy for higher masses -i.e. for , this point will be discussed within the next section.
5 Conclusion and discussion
Sect. 4 shows that looking for an agreement between models and SMC observations for both blue loop extensions and M-L relations for the SMC gives strong hints that high magnitude (i.e. low mass) SMC Cepheids could be metal deficient compared to the mean metallicity of the SMC; this fact could be explained by a “selection effect”: only stars with low enough metallicity could have an evolutionary track crossing Cepheids Instability Strip. Unfortunately direct spectroscopic determinations of for the SMC Cepheids around I-mag are not yet available. We discuss now a few issues in favor of the above proposition. First we consider another metal poor galaxy and then discuss the information which can be drawn from Cepheids in SMC clusters and beat Cepheids which supports the existence of SMC Cepheids as metal poor as dex.
5.1 Comparison between our model and a very low metallicity Cepheid population
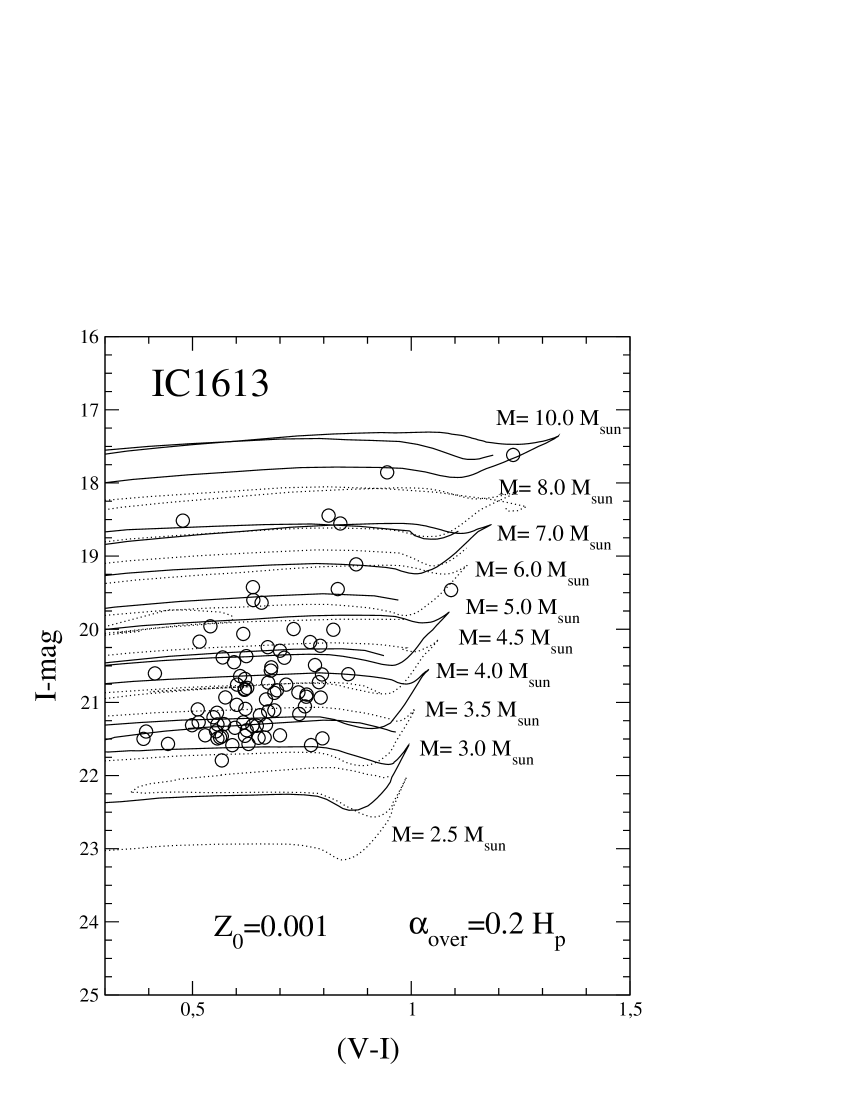
Udalski et al. (2001) provided a sample of Cepheids belonging to the galaxy IC1613 with a metallicity (see Lee et al. 1993). This data set offers the opportunity to check whether our evolutionary models are valid for metallicity as low as the value suspected for SMC Cepheids located below the line in a CM-diagram. Fig. 6 displays OGLE objects and our evolutionary tracks for . The distance modulus for IC1613 is taken to be mag and absorption is (see Udalski et al. 2001); reddening is given by Schlegel et al. (1998). Fig. 6 shows that the evolutionary tracks cross the whole instability strip as defined by the observed Cepheids. For this galaxy, no problem of blue loop exists with our models indicating that the main features of our models likely capture the essential evolutionary properties at low metallicity. One can notice that even a cut-off of OGLE detector around I-mag can not really change our conclusion because the blue loop for 2.5 is extended enough to model Cepheids as faint as I-mag .
5.2 Evidences for metal poor stars within the SMC
Luck et al. (1998) have determined the chemical composition of Cepheids in SMC by means of high resolution spectroscopy. The values found by the authors range between and corresponding to a mass fraction ranging between and , these values bracket the commonly assumed metallicity mean value for SMC, i.e. . However two remarks are in order here: (1) the sample studied by Luck et al. (1998) has a quite poor statistic (6 objects) while OGLE sample contains about 2000 objects; (2) more importantly, as shown by Fig. 1(b) the stars studied by Luck et al. (1998) are objects much brighter than those around I-magn which are not reached by our blue loops. The reason for the choice of bright objects is that spectroscopic determinations are easier for brighter objects. Therefore any biais -concerning high magnitude SMC Cepheids metallicity- cannot be excluded.
On the other hand, one may think that it is possible to infer some indirect information
about the SMC Cepheid metallicity. OGLE team has indeed discovered many stellar clusters
in the SMC, (see Pietrzynski et al. 1998). Moreover Pietrzynski &
Udalski (1999c)
have detected 132 Cepheids belonging to these clusters. One of the main properties of
stars belonging to a given cluster is to present the same chemical composition. Therefore
any indications about metallicity of these SMC clusters gives an information about the
metallicity of Cepheids belonging to clusters. The literature is quite poor about
metallicity determinations for SMC clusters. Table 1 mainly taken
from Crowl et al. (2001) gives metallicity estimations for SMC clusters.
Thanks to a cross identification we have found 2 clusters belonging to the catalogue
of Pietrzynski &
Udalski (1999c) and having a metallicity determination in the
literature: NGC 330 (SMC0107 in OGLE catalogue) and NGC 416 (SMC0158).
However these clusters are known to be young or intermediate-age systems;
one has to check whether the ages of Cepheids are compatible with age of the
cluster hosting them.
In the case of NGC 330 Chiosi et al. (1995) have found a maximum age of 48 Myr; beside this Pietrzynski & Udalski (1999b) have derived from their study Myr. From HST observations Mighell et al. (1998b) estimate an absolute age for NGC 416 of Gyr assuming that Lindsay 1 cluster is 9 Gyr old; Pietrzynski & Udalski (1999b) confirm that NGC 416 is older than 1 Gyr. We underline that neither NGC 330 nor NGC 416 are mentioned in the erratum Pietrzynski & Udalski (1999a).
For the Cepheid (SMC_SC7 206038 in OGLE catalogue) suspected to belong to
NGC 330 if we assume a metallicity () and a mass
about 3.5 consistently with its position within CMD; we found an age
of Myr; assuming () and 3.0
we obtain Myr. Thus the Cepheid is likely a field star and does not
belong to NGC 330.
Stars suspected to be NGC 416 objects have an I-magnitude between and mag; this corresponds to a mass around 4 for (metallicity consistent with cluster one). From our evolutionary calculations we get -for such mass and metallicity- an age of Myr.
Unfortunately this value is not compatible with the estimated age for NGC416; indeed the age spread (probably around Gyr) does not allow such young objects to belong to the cluster. Nevertheless one can notice that the majority of SMC clusters in Tab. 1 are metal deficient, thus SMC stars with metallicity lower than () does exist and the hypothesis of metal deficient SMC Cepheids appears to be reasonable.
| Cluster | Cepheid(s)? | |
|---|---|---|
| NGC 330 | (a) | no |
| NGC 411 | (b) | no |
| NGC 152 | (c) | no |
| Lindsay 113 | (d) | no |
| Kron 3 | (d) | no |
| NGC 339 | (d) | no |
| NGC 416 | (d) | no |
| NGC 361 | (d) | no |
| Lindsay 1 | (d) | no |
| NGC 121 | (d) | no |
| Kron 28 | (e) | no |
| Lindsay 38 | (e) | no |
| Kron 44 | (e) | no |
5.3 Information brought by SMC Beat Cepheids
OGLE Team has discovered a sample of 93 beat Cepheids in the SMC. Udalski et al. (1999) found that 23 pulsate simultaneously on the fundamental mode (hereafter F) and the first overtone (hereafter 1OT), the remaining objects have been found to pulsate simultaneously on the first and second overtones (hereafter 2OT).
In order to derive their Beaulieu et al. (2001) choose three quantities among the four observational ones: , and the periods and ( for F/1OT and for 1OT/2OT); they calculate the theoretical value of which is noted (the observed one being ). They next define the parameter ) allowing a comparison between theory and observations. They explore the influence of different important parameters, particularly distance modulus and reddening and finally conclude that a solution (i.e. ) is found simultaneously for F/1OT pulsators and 1OT/2OT only if the metallicity is settled to (i.e. ).
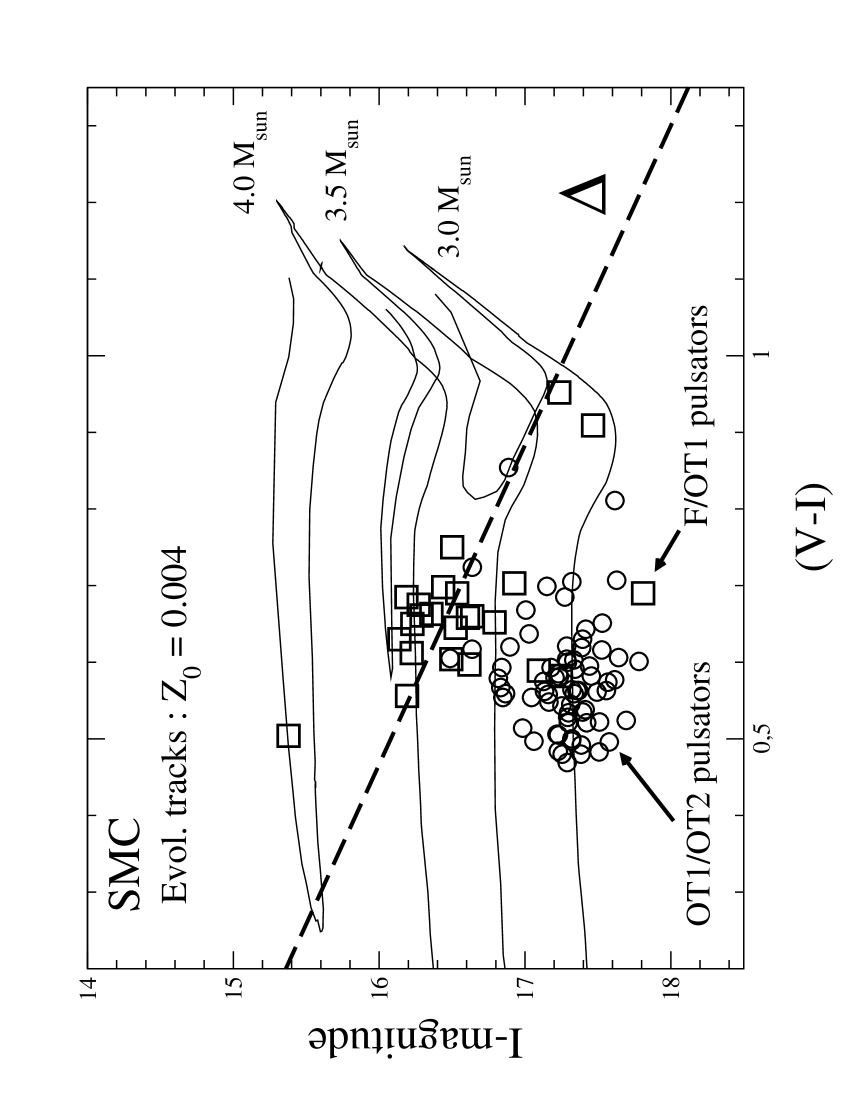
In Fig. 8 we have plotted the observed beat Cepheids together with evolutionary tracks and the straight line defined in Sect. 2. This plot clearly shows that the beat Cepheids are located in the region where we suspect that objects are metal deficient (i.e. with a metallicity around ). All 1OT/2OT pulsators are below (excepted one object) while F/1OT pulsators are scattered slightly above and below.
Thus these pulsation/evolution models of SMC beat Cepheids argue in favor of a relation between a metal deficiency (with respect to the mean value of the SMC) and the existence of SMC Cepheids at low magnitude.
5.4 The case of high mass Cepheid
Although it is slightly out of scope of this paper where we focus on faint SMC Cepheids, we will debate in this paragraph the case of brighter objects: i.e. corresponding to . Whatever is the assumed metallicity: or , few objects with an evaluated mass around () have a in discrepancy with the related .
We can make some hypothesis: as shown in Sect. 2.3.2 with a larger distance modulus -i.e. mag- we get and (compared with the situation with mag), but this extreme value is not able to bring a full agreement between and for brighter objects. On the other hand it is unlike that all these stars would be located deeper in SMC than others.
For a given mass value, a way to enhance the luminosity is to consider a larger overshooting amount. As suggested by Cordier et al. (2002), it can not be excluded that average overshooting amount for intermediate mass stars increases when metallicity decreases; they have derived -assuming for SMC main sequence stars- . With a LMC bump Cepheids study Keller & Wood (2002) infer an overshooting amount ( in our formalism).
We made a test -involving all mass values- with , as expected blue loop extensions are reduced (for low masses tracks the excursion of blue loop within IS is less deep) and luminosity is increased not enough () to get an agreement between and for . Then, to increase the overshooting amount over the whole range of mass is not the solution.
Another possibility is that overshooting can depend on mass, increasing with mass; as suggested for instance by Young et al. (2001). Thus we have concentrated us on models, varying overshooting amount between (our “standard” value here) up to ; this for both metallicities: and . Results are shown in Fig. 7; it is clear that beyond one no longer gets blue loop for . In contrast with blue loop extension decreases, but in a way where Cepheids IS is crossed by tracks. increases reaching large enough value (for , see diamond symbol in Fig. 5(b)) in order to make it up and for . We stress that Keller & Wood (2002) found their quite “high” overshooting amount using a sample of bright LMC Cepheids, this support our proposal of an higher overshooting for brighter Cepheids. One more time our work favors a solution involving low metallicity. Towards high masses, another selection effect could occur if the overshooting increases with mass and reached for masses larger than at low metallicity. A detailed study is needed on this topic and is out of the main goal of this paper.
5.5 Summary
In this paper we have explored two main problems related to the SMC Cepheid population: (1) the blue loop extension for high magnitude stars, (2) the Mass-Luminosity relation. We have first shown that blue loop extension is extended enough only if the metallicity is substantially lower than the commonly used value for SMC objects models.
Evolutionary tracks computed with correctly reproduce the Instability Strip shape for low masses and Mass-Luminosity relation derived from these tracks is in rather good agreement with deduced from observations using a technique similar to Beaulieu et al. (2001) one. The remaining discrepancy for the small population of brighter objects could be explained by a joined effect of low metallicity and rather enhanced core mixing process. Further researches are needed on this subject. We emphasize that Pietrukowicz (2002) -who estimates period change rates of SMC OGLE Cepheids- found also for brighter objects a rather bad agreement between models and observations.
Our point is that all Cepheids below are likely metal poor and stars above belong probably to a “mixed” population. Finally, the present work strongly suggests the existence of an evolutionary selection effect for fainter Cepheids belonging to SMC. High resolution spectroscopic chemical composition determinations for SMC Cepheids through the entire IS and particularly around magnitude are requested to bring definitive arguments in favor or against the present suggestion. This could be possible for a sample of few stars with UVES VLT spectrograph. Results would put a new light on the cosmologically important metallicity dependence of the Cepheids Period-Magnitude relation.
Acknowledgements.
We warmly thank the anonymous referee who contribute to the improvement of this paper with his/her remarks and suggestions. We also thank Jean-Philippe Beaulieu and J.Robert Buchler for valuable discussions; we are also grateful to the OGLE group for providing their data and to people involved inGNU/Linux projects. D. Cordier
thanks E.N.S.C.R. for working facilities and his “Aménagement de service”
during 20022003 Academic Year.
References
- Alexander & Ferguson (1994) Alexander, D. & Ferguson, J. 1994, ApJ, 437, 879
- Alongi et al. (1991) Alongi, M., Bertelli, G., Bressan, A., & Chiosi, C. 1991, A&A, 244, 95
- Alves & Sarajedini (1999) Alves, D. R. & Sarajedini, A. 1999, ApJ, 511, 225
- Angulo et al. (1999) Angulo, C., Arnould, M., Rayet, M., & et al. 1999, Nucl. Phys. A, 656, 3
- Beaulieu et al. (2001) Beaulieu, J. P., Buchler, J. R., & Kolláth, Z. 2001, A&A, 373, 164
- Böhm-Vitense (1958) Böhm-Vitense, E. 1958, Zs. f. Ap., 46, 135
- Bono et al. (2000) Bono, G., Caputo, F., Cassisi, S., Marconi, M., Piersanti, L., & Tornambè, A. 2000, ApJ, 543, 955
- Castelli et al. (1997) Castelli, F., Gratton, R. G., & Kurucz, R. L. 1997, A&A, 318, 841
- Castor (1971) Castor, J. I. 1971, ApJ, 166, 109+
- Caughlan & Fowler (1988) Caughlan, G. & Fowler, W. 1988, Atomic Data Nuc. Data Tables, 40, 283
- Caughlan et al. (1985) Caughlan, G., Fowler, W., Harris, M., & Zimmerman, B. 1985, Atomic Data Nuc. Data Tables, 32, 197
- Charbonnel et al. (1993) Charbonnel, C., Meynet, G., Maeder, A., & Schaerer, D. 1993, A&AS, 101, 415
- Chiosi et al. (1995) Chiosi, C., Vallenari, A., Bressan, A., Deng, L., & Ortolani, S. 1995, aap, 293, 710
- Cioni et al. (2000) Cioni, M.-R. L., Van der Marel, R. P., Loup, C., & Habing, H. J. 2000, A&A, 359, 601
- Cordier et al. (2002) Cordier, D., Lebreton, Y., Goupil, M.-J., Lejeune, T., Beaulieu, J.-P., & Arenou, F. 2002, A&A, 392, 169
- Crowl et al. (2001) Crowl, H. H., Sarajedini, A., Piatti, A. ., Geisler, D., Bica, E., Clariá, J. J., & Santos, J. . C. 2001, AJ, 122, 220
- Eggleton et al. (1973) Eggleton, P., Faulkner, J., & Flannery, B. 1973, A&A, 23, 325
- Grevesse & Noels (1993) Grevesse, N. & Noels, A. 1993, In: Origin and Evolution of the Elements, ed. V.-F. E. Prantzos N. & C. M. (Cambridge University Press, Cambrigge), 14, (GN’93)
- Groenewegen (2000) Groenewegen, M. A. T. 2000, A&A, 363, 901
- Harries et al. (2003) Harries, T. J., Hilditch, R. W., & Howarth, I. D. 2003, MNRAS, 339, 157
- Hill (1999) Hill, V. 1999, A&A, 345, 430
- Iglesias & Rogers (1996) Iglesias, C. A. & Rogers, F. J. 1996, ApJ, 464, 943, (OPAL 96)
- Izotov et al. (1997) Izotov, Y., Thuan, T., & Lipovetsky, V. 1997, ApJS, 108, 1
- Keller & Wood (2002) Keller, S. C. & Wood, P. R. 2002, ApJ, 578, 144
- Kovács (2000) Kovács, G. 2000, A&A, 363, L1
- Landré et al. (1990) Landré, V., Prantzos, N., Aguer, P., Bogaert, G., Lefebvre, A., & Thibaud, J. 1990, A&A, 240, 85
- Laney & Stobie (1994) Laney, C. D. & Stobie, R. S. 1994, MNRAS, 266, 441+
- Lauterborn et al. (1971) Lauterborn, D., Refsdal, S., & Weigert, A. 1971, A&A, 10, 97
- Lebreton et al. (1999) Lebreton, Y., Perrin, M.-N., Cayrel, R., Baglin, A., & Fernandes, J. 1999, A&A, 350, 587
- Lee et al. (1993) Lee, M. G., Freedman, W. L., & Madore, B. F. 1993, ApJ, 417, 553
- Lejeune et al. (1998) Lejeune, T., Cuisinier, F., & Buser, R. 1998, A&AS, 130, 65
- Luck et al. (1998) Luck, R. E., Moffett, T. J., Barnes, T. G., & Gieren, W. P. 1998, AJ, 115, 605
- Luridiana (2002) Luridiana, V. 2002, astro-ph/0209177
- Maeder (1983) Maeder, A. 1983, A&A, 120, 113
- Maeder & Meynet (1987) Maeder, A. & Meynet, G. 1987, A&A, 182, 243
- Maeder & Meynet (2001) —. 2001, A&A, 373, 555
- Magee et al. (1995) Magee, N., Jr., J. A., & Clark, R. 1995, in Atomic Structure Calculations and New Los Alamos Astrophysical Opacities, ed. S. Adelman & W. Wiese, Vol. 78 (Astronomical Society of the Pacific Conference Series (Astrophysical Applications of Powerful New Database)), 51
- Mighell et al. (1998a) Mighell, K. J., Sarajedini, A., & French, R. S. 1998a, AJ, 116, 2395
- Mighell et al. (1998b) —. 1998b, apjl, 494, L189+
- Morel (1997) Morel, P. 1997, A&AS, 124, 597
- Mould et al. (2000) Mould, J. R., Huchra, J. P., Freedman, W. L., Kennicutt, R. C., Ferrarese, L., Ford, H. C., Gibson, B. K., Graham, J. A., Hughes, S. M. G., Illingworth, G. D., Kelson, D. D., Macri, L. M., Madore, B. F., Sakai, S., Sebo, K. M., Silbermann, N. A., & Stetson, P. B. 2000, ApJ, 529, 786
- Peimbert et al. (2000) Peimbert, M., Peimbert, A., & Ruiz, M. . 2000, ApJ, 541, 688
- Piatti et al. (2001) Piatti, A. ., Santos, J. . C., Clariá, J. J., Bica, E., Sarajedini, A., & Geisler, D. 2001, MNRAS, 325, 792
- Pietrukowicz (2002) Pietrukowicz, P. 2002, Acta Astronomica, 52, 177
- Pietrzynski & Udalski (1999a) Pietrzynski, G. & Udalski, A. 1999a, Acta Astronomica, v.49, p. 435 (1999)., 49, 435
- Pietrzynski & Udalski (1999b) —. 1999b, Acta Astronomica, v.49, pp.157-164, (1999)., 49, 157
- Pietrzynski & Udalski (1999c) —. 1999c, Acta Astronomica, 49, 543
- Pietrzynski et al. (1998) Pietrzynski, G., Udalski, A., Kubiak, M., Szymanski, M., Wozniak, P., & Zebrun, K. 1998, Acta Astronomica, 48, 175
- Schaller et al. (1992) Schaller, G., Schaerer, D., Meynet, G., & Maeder, A. 1992, A&AS, 96, 269
- Schlegel et al. (1998) Schlegel, D. J., Finkbeiner, D. P., & Davis, M. 1998, ApJ, 500, 525
- Stanek et al. (1998) Stanek, K. Z., Zaritsky, D., & Harris, J. 1998, ApJ, 500, L141
- Udalski (1998) Udalski, A. 1998, AcA, 48, 113
- Udalski et al. (1999) Udalski, A., Soszynski, I., Szymański, M., Kubiak, M., Pietrzyński, G., Woźniak, P., & Żebruń, K. 1999, AcA, 49, 1
- Udalski et al. (1999) Udalski, A., Soszynski, I., Szymanski, M., Kubiak, M., Pietrzynski, G., Wozniak, P., & Zebrun, K. 1999, Acta Astronomica, 49, 437
- Udalski et al. (2001) Udalski, A., Wyrzykowski, L., Pietrzynski, G., Szewczyk, O., Szymanski, M., Kubiak, M., Soszynski, I., & Zebrun, K. 2001, Acta Astronomica, 51, 221
- Van der Marel & Cioni (2001) Van der Marel, R. P. & Cioni, M. L. 2001, AJ, 122, 1807
- Young et al. (2001) Young, P. A., Mamajek, E. E., Arnett, D., & Liebert, J. 2001, ApJ, 556, 230