Modeling the dynamical evolution of the M87 globular cluster system
Abstract
We study the dynamical evolution of the M87 globular cluster system (GCS) with a number of numerical simulations. We explore a range of different initial conditions for the GCS mass function (GCMF), for the GCS spatial distribution and for the GCS velocity distribution. Our simulations include the effects of two-body relaxation, dynamical friction and mass loss due to stellar evolution.
We first confirm that an initial power-law GCMF like that observed in young cluster systems can be readily transformed through dynamical processes into a bell-shaped GCMF. However, only models with initial velocity distributions characterized by a strong radial anisotropy increasing with the galactocentric distance are able to reproduce the observed constancy of the GCMF at all radii. We show that such strongly radial orbital distributions are inconsistent with the observed kinematics of the M87 globular cluster system.
The evolution of models with a bell-shaped GCMF with a turnover similar to that currently observed in old GCS is also investigated. We show that models with this initial GCMF can satisfy all the observational constraints currently available on the GCS spatial distribution, the GCS velocity distribution and on the GCMF properties. In particular these models successfully reproduce both the lack of a radial gradient of the GCS mean mass recently found in an analysis of HST images of M87 at multiple locations, and the observed kinematics of the M87 GCS. Our simulations also show that evolutionary processes significantly affect the initial GCS properties by leading to the disruption of many clusters and changing the masses of those which survive. The preferential disruption of inner clusters flattens the initial GCS number density profile and it can explain the rising specific frequency with radius; we show that the inner flattening observed in the M87 GCS spatial distribution can be the result of the effects of dynamical evolution on an initially steep density profile.
1 Introduction
A number of recent observational studies have provided detailed information on the properties of the M87 GCS. Most recently, Kundu, Zepf & Ashman (2002) have used multiple HST pointings to show that the turnover of the luminosity function of the GCS (hereafter we will indicate the luminosity function and the mass function of the globular cluster system by GCLF and GCMF respectively) is constant over a large range of galactocentric distances. The data analyzed include clusters up to a projected galactocentric distance equal to about 70 kpc and confirm and extend the lack of radial gradient in the GCLF turnover already found by Kundu et al. (1999) for clusters in the inner regions of M87. Because of the very large number of clusters in the M87 GCS and the high quality of the HST data, the uncertainty in the determination of the GCLF turnover is small and a stringent constraint on its possible radial variation is thus imposed by the new data.
The lack of a radial gradient in the GCS mean luminosity is sometimes interpreted as an indication that evolutionary processes, whose efficiency is known to depend on the galactocentric distance, did not play an important role in determining the current properties of GCSs. However, the studies of the dynamical processes and their effects on the properties of globular clusters are based on fundamental stellar dynamics and there is no way to keep dynamical evolution from occurring. The results of all the theoretical investigations of the dynamical evolution of globular clusters and GCSs (see e.g. Fall & Rees 1977, Gnedin & Ostriker 1997, Murali & Weinberg 1997a,b, Baumgardt 1998, Vesperini 1997, 1998, 2000, 2001 and references therein) show that evolutionary processes lead to the disruption of a significant number of clusters (the exact fraction of the initial number of clusters depending on the properties of the host galaxy; see e.g. Murali & Weinberg 1997a, Vesperini 2000, 2001) and to the modification of the properties of the surviving clusters.
Several recent papers on models of the dynamical evolution of GCSs have addressed the issue of the radial behavior of the GCMF. Vesperini (1998, 2000), in studies of the evolution of the Galactic GCS and of GCSs of elliptical galaxies, has shown that for a log-normal initial GCMF (or more in general for GCMFs which are bell-shaped in ; see Vesperini 2002) with mean mass and dispersion similar to those currently observed, evolutionary processes are very efficient in disrupting a large fraction of clusters but they do not always produce a significant radial variation of the GCMF parameters. On the other hand, several theoretical investigations (see e.g. Baumgardt 1998, Murali & Weinberg 1997a,b, Vesperini 1998,2001) have shown that for a power-law initial GCMF as steep as that observed in young GCS in merging galaxies, evolutionary processes lead to the development of mean mass radial gradients not consistent with observations.
In a recent study of the evolution of the Galactic GCS, Fall & Zhang (2001) have shown that, adopting an initial orbital distribution characterized by a strong radial anisotropy increasing with the galactocentric distance, the final GCMF has a modest radial variation that is in fair agreement with the observed one, even for a steep power-law for the initial GCMF. Nevertheless, the radial anisotropy necessary to obtain the desired results is very large and, although the initial anisotropy can be reduced by disruption of clusters on more eccentric orbits, observational estimates of the current anisotropy of the Galactic GCS (see e.g Dinescu, Girard & van Altena 1999) indicate a much smaller anisotropy.
In this paper we will model the evolution of the M87 GCS and explore the range of initial conditions leading to final properties consistent with those observed. The GCLF properties determined by Kundu et al. (2002) and the kinematical properties determined by Cote et al. (2001), Romanowsky & Kochanek (2001), Cohen (2000) and Cohen & Ryzov (1997) will be used to constrain viable initial conditions. The outline of this paper is the following. In section 2 we describe the method used for our study and the initial conditions considered; in section 3 we show the results obtained, in section 4 we discuss our results and in section 5 we summarize our conclusions.
2 Method and initial conditions
The method we use to follow the evolution of a model GCS is the same as that adopted in Vesperini (2000,2001) to study the evolution of GCS in elliptical galaxies. The evolution of the masses of individual clusters is calculated using the results of N-body simulations by Vesperini & Heggie (1997). The effects of mass loss due to stellar evolution (assuming a stellar IMF with a slope ; similar results are obtained if the 2-slope power-law stellar IMF suggested by Kroupa (2001) is adopted), two-body relaxation, dynamical friction and of the tidal field of the host galaxy have been included. The mass loss rate due to two-body relaxation has been calculated assuming the tidal radius of each cluster is determined by the pericentric distance. We refer the reader to Vesperini (2000) for further details.
We adopt a mass model for M87 proposed by McLaughlin (1999a) on the basis of various observational constraints available on the stellar and dark matter distribution in M87 and the Virgo Cluster; in this model, adopting a distance of 15 Mpc to M87, the total mass enclosed within a radius is equal to
| (1) | |||||
For the initial spatial distribution of the GCS we have considered the following profiles:
-
A)
a Navarro, Frenk & White (1996) (hereafter NFW) profile with scale radius, , equal to 9.1 kpc. This model has been shown (McLaughlin 1999b) to fit the observed surface number density profile of the M87 GCS.
-
B)
An NFW profile with kpc for kpc and an NFW profile with kpc for kpc. The choice of the NFW profile with kpc for kpc, where there are no observational constraints on the GCS spatial distribution, has been proposed by McLaughlin (1999b) and it relies on the assumption that the density profile of the GCS becomes the same as that of gas and stars at kpc.
-
C)-D)
It has been often claimed that the inner flattening in the spatial distribution of the M87 GCS can not be the result of the effects of dynamical disruption of clusters (Lauer & Kormendy 1986). In order to further explore if this is indeed the case we have also considered two profiles equal to those considered in A) and B) above but with kpc instead of the current best fit value of 9.1 kpc, giving much more concentrated initial GCS profile.
As for the initial GCMF, we have restricted our choice to the functional forms and the parameters indicated by observational studies of young and old cluster systems: our fiducial choice was a power-law function, for , with index as observed in young clusters systems in merging galaxies (see e.g. Zepf et al. 1999 and Whitmore 1999 for a review). Since, with an initial power-law GCMF, none of our models satisfied all the observational constraints, we have explored the evolution of GCSs with a two-slope power-law with for and for . The latter GCMF is bell-shaped with a turnover at if binned in (see e.g. McLaughlin 1994) and is similar to that currently observed in old cluster systems (see e.g. Ashman & Zepf 1998, Harris 2001). As discussed in Vesperini (2002), the evolution of this GCMF is not significantly different from that of other bell-shaped GCMFs, such as a log-normal or a t-Student distribution, with the same turnover.
The initial density profiles and GCMFs considered are summarized in Table 1.
As for the GCS velocity distribution, we adopted an initial distribution characterized by a radial anisotropy increasing with the galactocentric distance as in the Osipkov-Merrit models (Osipkov 1979, Merritt 1985); for these models the ratio of the radial to the tangential velocity dispersion increases with galactocentric distance, , as
| (2) |
Beyond the anisotropy radius, , the distribution is dominated by radial orbits whereas for , it is essentially isotropic. According to the calculations of Fall & Zhang (2001), for the Galactic GCS, this distribution along with a particular choice of the anisotropy radius ( kpc) appears to be the only one leading to a GCS mean mass radial gradient in fair agreement with observations if a power-law initial GCMF as steep as that of young cluster systems in merging galaxies is adopted.
In order to fully explore the dependence of the GCS evolution on the initial anisotropy in the velocity distribution, for each of the initial density profiles mentioned above, simulations with initial values of ranging from 1 kpc to 250 kpc have been carried out.
Each GCS investigated was initially made of 400000 clusters with positions randomly drawn from the spatial profiles described above; given the current position of a cluster, , the local radial velocity dispersion was calculated using the Jeans equation and the local tangential velocity dispersion was then calculated using the value of at ; the radial and the tangential velocities of each cluster were then drawn from Maxwellian velocity distributions with radial and tangential dispersions calculated above. This method, introduced by Hernquist (1993), has been used in many studies to set initial conditions for N-body simulations of both spherical and disk galaxies.
The evolution of each GCS has been followed until Gyr and the GCS properties at several intermediate ages have also been studied.
3 Results
3.1 Power-law initial GCMF
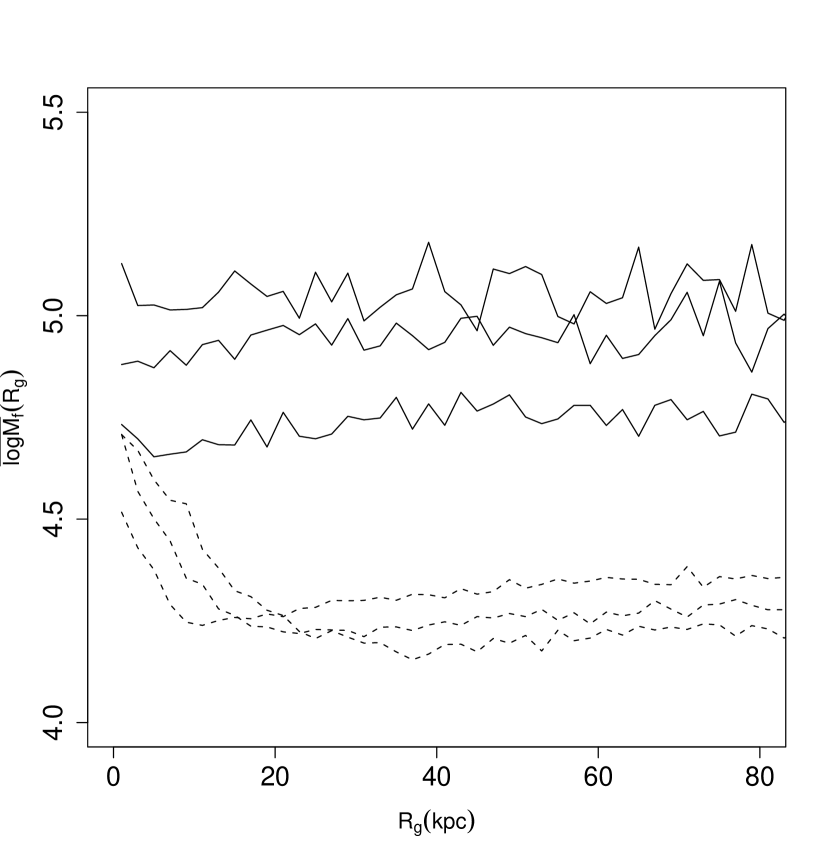
In Fig. 1, we plot the mean mass of the globular clusters against the projected galactocentric distance for theoretical models with different initial anisotropy radii. We also plot the observational data from Kundu et al. (2002) analysis. The absence of any significant radial gradient in the mean mass observed for the M87 GCS requires small values of the initial anisotropy radius ( kpc). Initial conditions with anisotropy radii larger than 3 kpc produce final mean masses smaller than those observed and steep radial gradients inconsistent with data.
We have also considered possible radial variations in for the M87 GCS. The only observed property of the globular clusters that varies with galactocentric radius which is relevant for is the ratio of blue to red globular clusters, which increases with galactocentric distance for M87 (Kundu et al. 2002) as it does for most other galaxies (see Ashman & Zepf 1998). This color difference tends to produce a difference in for typical models of stellar populations, but this difference is much smaller than the mass variation predicted by models of dynamical evolution with a power-law initial GCMF and anisotropy radii larger than a few kpc. Specifically, using current stellar populations models (Bruzual & Charlot 2000, Maraston et al. 2002) we find that for a range of possible age and metallicity combinations that are consistent with the observed colors of the red and blue populations of globular clusters. Applying this estimate to the M87 system, for which we approximate the color gradient by adopting a ratio of the number of red to blue clusters equal to 1 for kpc and equal to 0 beyond 20 kpc, we find the inner clusters would have a mass-to-light ratio 1.3 times larger than the mass-to-light ratio of outer clusters leading to a . This is significantly smaller than the radial gradient obtained in models with large initial anisotropy radii. Moreover, the mean mass of outer clusters from simulations with large anisotropy radii is much smaller than the mass obtained from the observed mean luminosity with any reasonable value of the mass-to-light ratio.
This comparison with the observational constraints on the radial variation of the mean mass of clusters has significantly narrowed the range of possible initial values of for the M87 GCS with a power-law initial GCMF.
We now turn our attention to the observational constraints imposed by the kinematics of the M87 GCS. In fig.2 we show the observed projected velocity dispersion profile of the M87 GCS as determined by Cote et al. (2001) along with the dispersion profiles of various models with different orbital anisotropy. Density profile A (fig.2a), density profile B (fig.2b) and an Osipkov-Merritt radial profile for the anisotropy (see eq.2 above) are used to calculate the theoretical profiles. Values of larger than 50 kpc are necessary to fit the projected velocity dispersion profile if density profile A is adopted and larger than 200 kpc for density profile B. These values are much larger than the initial anisotropy radius required to produce a radial gradient of the mean mass of clusters consistent with observations. Fig. 3 shows the final projected velocity dispersion profiles from our simulations for initial values of leading to final GCMF properties consistent with observations: it is clear that these profiles do not fit the observational data. For the small initial values of necessary to produce GCMF properties consistent with observations, the number density profile does not evolve significantly (see discussion below) and, therefore, simulations starting with profiles C and D lead to both kinematical properties and final density profiles inconsistent with observations.
Fig.4 shows the radial profile of at the end of the simulations with initial and kpc and with initial density profile A, and with initial and kpc with initial density profile B: the preferential disruption of clusters on high eccentricity orbits is not sufficient to reduce the strong initial anisotropy to a level consistent with observations; the profile from the most and the least anisotropic models used to fit the observed velocity dispersion profile in fig. 2 along with the value of of the different models proposed by Romanowsky & Kochanek (2001) calculated at the outermost distance constrained by observations are also shown in fig.4.
It is thus clear from these results that, adopting a strong initial radial anisotropy increasing with galactocentric distance, although necessary to produce final GCMF properties consistent with observations from a steep initial power-law GCMF, is not a viable solution as the final anisotropy is stronger than shown by observations of the radial velocities of the globular clusters. It is also important to point out that, although numerical simulations of galaxy formation predict a radial anisotropy increasing with galactocentric distance, the initial anisotropy required to obtain GCMF properties consistent with data is much stronger than that found in simulations. For example, numerical simulations of the formation of giant galaxies at the center of groups and clusters carried out by Dubinski (1998) predict a growing from 0 to 2 from the center of the galaxy to 100 kpc; the initial anisotropy required to fit the GCMF properties in our models is such that at 100 kpc.
Fig. 5 shows the time evolution of for two models with equal to 2 and 150 kpc. In the model with initial anisotropy radius equal to 2 kpc the mean mass profile is always approximately flat and, as a result of the preferential disruption of low-mass clusters, the GCS mean mass increases with time. In the model with kpc, a strong radial gradient quickly develops and it becomes steeper and more extended as the system evolves; the quick formation of the mean mass radial gradient implies that a significant radial gradient would have to be expected in models with large anisotropy radii even if the time needed for the potential of M87 to reach its equilibrium state were considered and the GCS evolved in the current M87 potential for a time shorter than that (15 Gyr) considered in our simulations.
As shown above, none of the initial conditions considered leads to final properties consistent with both the observed GCLF properties and the observed kinematical properties. Although it is therefore not necessary to explore the evolution of the GCS number density profile to further constrain the range of viable initial conditions, we conclude this subsection with a few remarks on the evolution of the GCS spatial distribution as this can shed further light on the GCS evolution.
Fig.6a and 6b show the final GCS surface density for a few different initial values of along with the initial profile (profile A for fig.6a and profile C for fig.6b). The initial velocity distribution adopted is such that the anisotropy increases with galactocentric distance and, in particular, radial orbits dominate beyond . For small values of , most clusters, regardless of their current galactocentric distances, have small pericentric distances (see fig.8a) and, since we have assumed that the pericentric distance determines the timescale of evolution of clusters, the disruption rate is approximately constant and independent of the current galactocentric distances of clusters (see fig.7). As a consequence of that, the shape of the final spatial profile is very similar to the initial one; this is also the reason why small values of do not produce a gradient in the mean mass: for small values of , clusters at any distance from the galactic center are disrupted and lose mass at approximately the same rate. More in general, no radial gradient in any other cluster property will be produced as a result of evolution for GCS with initial small values of . Note that if the disruption rate does not depend on galactocentric distance, the decrease of specific frequency in the inner regions of M87 reported by McLaughlin (1999b; see Rhode & Zepf 2001 for a similar radial dependence of the specific frequency in NGC 4472) can not be ascribed to dynamical evolution and it should be explained in terms of a radial dependency of cluster formation efficiency.
As increases and the velocity distribution becomes more isotropic, the range of pericentric distances broadens (see fig.8b) and clusters closer to the center of the host galaxy are preferentially disrupted (see fig.7); the disruption rate is therefore higher near the center of the galaxy and a central flattening of the density profile ensues. Therefore we find that evolutionary processes, in particular disruption of inner low-mass clusters, can be responsible for the observed central flattening in the spatial distribution of the M87 GCS (see also Murali & Weinberg 1997a, Capuzzo Dolcetta & Tesseri 1997) and, contrary to previous claims, this does not have to due to initial conditions.
3.2 Two-slope power-law initial GCMF
As discussed in the previous subsection, starting with a power-law initial GCMF similar to that of young GCSs observed in merging galaxies, we could not find any model satisfying all the observational constraints. We have therefore continued our investigation by exploring the evolution of GCSs with a two-slope power-law initial GCMF. The parameters of the initial GCMF adopted are summarized in Table 1. We note that this GCMF is bell-shaped if binned in and, as discussed in Vesperini (2002), the results obtained using this functional form for the initial GCMF do not differ significantly from those obtained adopting other bell-shaped functions often used in the literature to fit the GCLF of old GCS, such as a log-normal, or a t-Student distribution (see e.g. Secker 1992). As shown in the previous subsection, an initial number density profile similar to that observed preserves its shape only for an initial velocity distribution characterized by a strong radial anisotropy inconsistent with the kinematical data available. For this reason, here, we focus our attention only on number density profiles C and D.
Fig.9 shows the radial profile for our simulations of the M87 GCS with different initial values of : the GCS final and its radial profile are consistent with the observed mean mass and lack of a radial gradient in the mean mass for the entire range of values of considered and no constraint on the anisotropy of the initial velocity distribution is imposed by the final GCMF properties.
In fig.10 we compare the final projected velocity dispersion radial profile from our simulations of M87 GCS with that determined by Cote et al’s observational data. Fig. 10a shows the results for initial number density profile C and kpc; initial values of the anisotropy radius around 60 kpc ( kpc) appear to be those which better fit the observed velocity dispersion profile, but all the profiles resulting from simulations with initial anisotropy radii ranging from 30 kpc to 200 kpc fall within the confidence limits and increase with radius as in the observed profile. As expected (see fig.2 above), if initial number density profile D is adopted (fig.10b), larger initial values of ( kpc) are required to obtain final velocity dispersion profiles fitting the data.
In fig. 11 we compare the theoretical profile obtained in the simulations leading to final GCMF properties and velocity dispersion profile consistent with observations and the profile derived from our fits in fig.2; fig.11 shows that the results from our simulations are consistent with the constraints on the anisotropy imposed by observational data.
Finally, in fig.12 we compare the observed surface density profile with the final surface density profile from our simulation with initial density profile C and initial equal to 60 kpc. Final surface density profiles from simulations with kpc are essentially indistinguishable from that shown in fig.12. This figure shows that a density profile initially more peaked than the observed one can evolve, as a result of the preferential disruption of inner clusters, toward a final shape in good agreement with the observed one.
Fig.13 shows the radial dependence of the fraction of surviving clusters; assuming a similar initial density profile for stars and for the GCS, this plot clearly shows that disruption can produce the observed central flattening of the GCS density profile and explain a rising local specific frequency up to about 20-25 kpc.
A large fraction of the total initial GCS mass is lost because of cluster disruption and mass loss from surviving clusters. Although the majority of the mass lost is from clusters in the inner regions of the galaxy, a full understanding of the relevance of this mass to the build-up of the central black hole would require a careful study of the orbital evolution of the mass lost from clusters which is beyond the scope of this paper.
The dependence of the mass loss on the initial mass of clusters is shown in Fig. 14. This figure shows the ratio of the final to the initial mass of surviving clusters, , versus the initial mass of clusters from one of our simulations: as expected, most of the surviving low-mass clusters have lost more than half of their initial mass but it is interesting to point out that this is also the case for a large number of clusters with high initial mass. Although, as expected, low-mass clusters are preferentially disrupted by dynamical processes, a significant fraction of clusters with large initial masses are disrupted as well; for example, for a model with initial density profile C and kpc, about 40 per cent of the initial population of clusters with is disrupted by evaporation in 15 Gyr.
The results of the simulations discussed in this subsection show that, starting from a two-slope power-law initial GCMF with parameters similar to those currently observed in old GCSs, it is possible to produce models satisfying all the observational constraints (the two-slope power-law GCMF adopted is bell-shaped if binned in log M and the results would be similar if other bell-shaped GCMFs with the same initial turnover were adopted). Additional observational data, particularly on the kinematics of the M87 GCS, would be valuable to further constrain the range of viable initial conditions.
4 Discussion
The simulations carried out in this investigation to explore the range of viable initial conditions for the M87 GCS and the role of evolutionary processes have shown that models with a power-law initial GCMF require a very strong initial radial anisotropy to avoid the development of a steep mean mass radial gradient inconsistent with the roughly constant radial profile observed. On the other hand, adopting the strong radial anisotropy required to obtain a flat radial profile leads to final kinematical properties inconsistent with the kinematical data available, which are best-fit by models with a much weaker radial anisotropy. We have explored the role of several factors which could have affected this conclusion but we found it to be very robust. In particular we have shown that a steep radial gradient in models with kinematical properties matching the observed kinematical data develops in a few gigayears and even if the current M87 potential has not been in place for one Hubble time, a radial gradient inconsistent with observational data is still expected. We have also considered the effect of a radial variation of the mass-to-light ratio, but the radial gradient obtained from the observed radial profile of the mean luminosity is still much smaller than that produced in theoretical models. In our simulations we started with an initial GCMF independent on the galactocentric distance; although it would be possible to assume a GCMF with an ad hoc initial radial variation to counteract the gradient produced by evolutionary processes, there is neither theoretical nor observational support for such a choice.
As already shown in a number of previous theoretical investigations, a power-law initial GCMF can be turned by the evolutionary processes considered in our study into a bell-shaped (in ) GCMF resembling the GCMF of old GCSs. However, if the evolution is driven only by disruption and evolution due to two-body relaxation, interaction with the tidal field of the host galaxy and dynamical friction, none of the models with a power-law initial GCMF we have studied could match both the observed kinematical properties and the observed radial profile.
Our study shows that in models starting with a bell-shaped initial GCMF with parameters similar to those observed, evolutionary processes lead to final properties satisfying all the observational constraints ( radial profile, spatial distribution and kinematical data). If the initial GCMF is indeed a power-law, as both observational studies of young cluster systems and theoretical studies of cluster formation suggest, the details of the evolution of an initial power-law GCMF into a bell-shaped GCMF are still to be clarified.
We are currently exploring this issue by focussing our attention on the effects of clusters disruption (see e.g. Chernoff & Weinberg 1990, Fukushige & Heggie 1995) caused by the early mass loss due to the evolution of massive stars (Vesperini & Zepf 2003). In particular we are studying to what extent early disruption of clusters can alter the initial GCMF and how the evolution of the initial GCMF depends on the distribution of cluster concentrations and on the correlation of cluster concentrations with other cluster properties.
5 Conclusions
In this paper we have carried out a number of simulations of the M87 GCS evolution. We have considered a number of different initial conditions and determined which can lead, driven by the effects of internal relaxation, interaction with the tidal field of the host galaxy and dynamical friction, to final properties consistent with the observed GCS properties (radial profile of the GCS mean mass, GCS spatial distribution and GCS kinematical properties).
We have adopted two different initial GCMF and focussed our attention only on the functional forms and the parameters indicated by observational studies of young and old cluster systems: a power-law similar to that observed in young cluster systems in merging galaxies and a two-slope power-law with parameters similar to that currently observed in old cluster systems. The initial velocity distribution considered is such that the ratio of the radial to the tangential velocity dispersion increases with the galactocentric distance as in the Osipkov-Merritt models (); a wide range of values for the anisotropy radius have been considered ( kpc). NFW number density profiles with different values of the scale radius have been studied (see Table 1 for a summary of the initial conditions considered).
For a power-law initial GCMF we could not find any initial condition leading to final properties satisfying all the observational constraints. For the two-slope power-law initial GCMF considered here (but the results are similar for other initial GCMF bell-shaped in such as a log-normal or a t-Student distribution) we found a range of initial conditions whose evolution lead to final properties consistent with all the observational constraints.
In particular we find that:
-
1.
for a power-law initial GCMF, only models with a strong initial radial anisotropy fit the flat profile observed. Specifically, only models with an initial value of the anisotropy radius kpc have a final mean mass radial profile fairly matching the observed ;
-
2.
the small initial values of necessary to obtain a flat mean mass radial profile from a power-law initial GCMF lead to final kinematical properties characterized by a strong radial anisotropy. This is inconsistent with observational kinematical data which, instead, favor models characterized by more isotropic velocity distributions.
-
3.
For a two-slope power-law initial GCMF with parameters similar to those observed in old GCSs, the final radial profile is approximately flat and consistent with observations for all the values of considered ( kpc) and for all the initial number density profiles considered.
-
4.
For the two-slope power-law initial GCMF adopted in this study, a number of the models studied also have final kinematical properties and final spatial distributions consistent with observations and they, therefore, satisfy all the observational constraints available. In particular for the initial number density profile C (single NFW profile with initial scale radius equal to 0.1 kpc; see Table 1) values of the anisotropy radius larger 30 kpc lead to final kinematical properties consistent with observations with the best-fitting models being those with kpc. For this range of values of , the initially peaked spatial distribution significantly flattens as a results of the preferential disruption of inner clusters and the final surface number density is perfectly consistent with observations. For the initial number density profile D (double NFW profile with scale radii equal to 0.1 and 560 kpc; see Table 1) more isotropic initial velocity distributions are necessary to produce final kinematical properties consistent with observations ( kpc).
-
5.
Although low-mass clusters are those preferentially affected by evolutionary processes, we have shown that for a significant fraction of clusters with initial masses larger than the current mass is less than 50 per cent of the initial mass.
-
6.
We have explored the dependence of the fraction of disrupted clusters on the galactocentric distance and shown that, although clusters are disrupted more efficiently at small galactocentric distances, disruption can be significant over a large radial range and explain a rising local specific frequency out to large radii.
In a future work (Vesperini & Zepf 2003) we will study the role of early disruption of clusters with different initial concentrations caused by the mass loss due to the evolution massive stars and we will explore the effect of this process on the evolution of the GCMF.
ACKNOWLEDGMENTS
The authors gratefully acknowledge support from NASA via the ATP grant NAG5-11320, the LTSA grant NAG5-11319 and grant AR-09208.01 from Space Telescope Science Institute, which is operated by AURA under NASA contract NAS 5-26555. We thank D.E. McLaughlin for kindly providing us with the data of the M87 GCS velocity dispersion profile and an anonymous referee for useful comments.
REFERENCES
Ashman K.M., Zepf S.E., 1998, Globular Cluster Systems, Cambridge
University Press
Baumgardt, H., 1998, A&A, 330, 480
Bruzual, A.G., Charlot, S. 2000, private communications
Capuzzo Dolcetta, R., Tesseri, A., 1997, MNRAS, 292, 808
Chernoff D.F., Weinberg M.D., 1990, ApJ, 351, 121
Cohen, J., 2000, AJ, 119, 162
Cohen, J., Ryzhov, A., 1997, ApJ, 486, 230
Cote, P., et al., 2001, ApJ, 559, 828
Dinescu, D.I., Girard, T.M., van Altena, W.F., 1999, AJ, 117, 1792
Dubinski, J., 1998, ApJ, 502, 141
Fall, S.M., Rees, M.J., 1977, MNRAS, 181, 37P
Fall, S.M., Zhang, Q., 2001, ApJ, 561, 751
Fukushige T., Heggie, D.C., 1995, MNRAS, 276, 206
Gnedin O.Y., Ostriker J.P., 1997, ApJ, 474, 223
Harris, W.E., 2001, in Star Clusters, Lectures for 1998 Saas-Fee
Advanced School, L. Labhardt, B. Binggeli eds., (Springer-Verlag,
Berlin, 2001)
Hernquist, L., 1993, ApJS, 86, 389
Kroupa, P., 2001, MNRAS, 322, 231
Kundu A., Whitmore B.C., Sparks W.B., Macchetto F.D., Zepf S.E.,
Ashman K.M., 1999, ApJ 513, 733
Kundu, A., Zepf, S.E., Ashman, K.M., 2002, in preparation
Lauer, T. R., Kormendy, J., 1986, ApJ, 303, L1
Maraston, C. et al., 2002, A&A submitted
McLaughlin D.E. 1994, PASP, 106, 47
McLaughlin D.E. 1999a, ApJ, 512, L9
McLaughlin D.E. 1999b, AJ, 117, 2398
Merritt, D., 1985, AJ, 90, 1027
Murali C., Weinberg M.D., 1997a, MNRAS, 288, 767
Murali C., Weinberg M.D., 1997b, MNRAS, 291, 717
Navarro, J., Frenk, C., White, S., 1996, ApJ, 462, 563
Osipkov, L.P., 1979, PAZh, 5, 77
Rhode,K.L., Zepf, S.E., 2001, AJ, 121, 210
Romanowsky, A.J., Kochanek, C.S., 2001, ApJ, 553, 722
Secker,J., 1992, AJ, 104, 1472
Vesperini, E., 1997, MNRAS, 287, 915
Vesperini, E., 1998, MNRAS, 299, 1019
Vesperini, E., 2000, MNRAS, 318, 841
Vesperini, E., 2001, MNRAS, 322, 247
Vesperini, E., 2002, in Grebel E.K., Geisler D., Minniti D. eds.,
Extragalactic Star Clusters, p.664
Vesperini, E., Heggie, D.C., 1997, MNRAS, 289, 898
Vesperini, E., Zepf, S.E., 2003, ApJ, 587, L97
Whitmore, B.C., 1999, in Barnes J.E., Sanders D.B., eds., Proc. IAU
Symp. 186, Galaxy interactions at low and high redshift. Kluwer,
Dordrecht, p.251
Zepf, S.E., Ashman, K.M., English, J., Freeman, K.C., Sharples, R.M.,
1999, AJ, 118, 752
| id. | Number density profile: |
|---|---|
| A | kpc |
| B | for kpc; kpc for kpc |
| C | kpc |
| D | for kpc; kpc for kpc |
| Initial GCMF: | |
| 1PL | for |
| 2PL | for and for |
| Initial anisotropy profile: | |
| kpc | |
![[Uncaptioned image]](/html/astro-ph/0305064/assets/x1.png)
![[Uncaptioned image]](/html/astro-ph/0305064/assets/x2.png)