RXTE, ROSAT and ASCA Observations of G347.30.5
(RX J1713.73946): Probing Cosmic-Ray Acceleration
by a Galactic Shell-Type Supernova Remnant
Abstract
We present an analysis of the X-ray spectrum of the Galactic shell-type SNR G347.30.5 (RX J1713.73946). This SNR is a member of a growing class of SNRs which are dynamically young, shell-type sources that emit non-thermal X-rays from specific regions on their outer shells. By performing a joint spectral analysis of data from observations made of G347.30.5 using the PSPC, the GIS and the PCA, we have fit the spectra of particular regions of this SNR (including the bright northwestern and southwestern rims, the northeast rim and the interior diffuse emission) over the approximate energy range of 0.5 through 30 keV. We find that fits to the spectra of this SNR over this energy range using the model were superior to a simple power law model or the model. We find that the inclusion of a thermal model with the model helps to improve the fit to the observed X-ray spectrum: this represents the first detection of thermal X-ray emission from G347.30.5. Thermal emission appears to be more clearly associated with the diffuse emission in the interior of the SNR than with the bright X-ray emitting rims. A weak emission feature seen near 6.4 keV in the PCA spectrum most likely originates from diffuse X-ray emission from the surrounding Galactic Ridge rather than from G347.30.5 itself. We have analyzed our PCA data to search for pulsations from a recently discovered radio pulsar (PSR J17133949) which may be associated with G347.30.5, and we do not detect any X-ray pulsations at the measured radio period of 392 ms. Using the best-fit parameters obtained from the model, we estimate the maximum energy of cosmic-ray electrons accelerated by the rims of G347.30.5 to be 19-25 TeV (assuming a magnetic field strength of = 10G), consistent with the results of Ellison et al. (2001). We present a broadband (radio to -ray) photon energy-flux spectrum for the northwestern rim of G347.30.5, where we have fit the spectrum using a more sophisticated synchrotron-inverse Compton model with a variable magnetic field strength. Our fit derived from this model yields a maximum energy of only 8.8 TeV for the accelerated cosmic-ray electrons and a much greater magnetic field strength of 150 G: however, our derived ratio of volumes for TeV emission and X-ray emission based on this fit – TeV/X-ray 1000 – is too large to be physically acceptable. We argue that neither non-thermal bremsstrahlung nor neutral pion paritcle decay can adequately explain the TeV emission from this rim, and therefore the physical process responsible for this emission at this site is currently uncertain. Finally, we compare the gross properties of G347.30.5 with other SNRs known to possess X-ray spectra dominated by non-thermal emission.
1 Introduction
Supernova remnants (SNRs) are considered the leading candidates for the accelerators of cosmic-rays to at least the “knee” of the cosmic-ray energy spectrum ( 3000 TeV). While the relationship between SNRs and cosmic-ray acceleration has received extensive attention in the literature (Bell, 1978a, b; Axford, 1981; Blandford & Eichler, 1987; Jones & Ellison, 1991; Malkov & Drury, 2001), most of this discussion has been theoretical, with only a limited amount of observational data to consider. One major unresolved issue related to cosmic-ray acceleration by SNRs is the maximum energy cutoff attained by cosmic-ray particles accelerated by the shock front: for samples of young shell-type X-ray emitting SNRs located in the Galaxy and the Large Magellanic Cloud, Reynolds & Keohane (1999) and Hendrick & Reynolds (2001) estimated values for cutoff of 200 TeV and 80 TeV, respectively, both well below the cosmic-ray energy spectrum “knee.” Progress on this issue has been limited due to the lack of both X-ray and TeV observations of SNRs with the angular and spectral resolution needed to probe the acceleration process.
Recently, however, high spatial resolution observations of SNRs at X-ray energies have become feasible for the first time using such X-ray observatories as , , and . These high resolution observations yield spatially-resolved spectroscopy of X-ray emitting features within the SNR, particularly the X-ray luminous rims that are associated with the expanding shock fronts of SNRs. By performing a detailed spectral analysis of X-ray emission from the rims of SNRs, corresponding to shock fronts where interstellar or circumstellar material is being swept up, the cosmic-ray acceleration process may be probed. Initial insights on cosmic-ray acceleration by SNRs have been gleaned from , and observations of the high-energy X-ray emission from such SNRs as Cas A and SN 1006 (Willingale et al., 1996; Allen et al., 1997; Keohane, 1998; Dyer et al., 2001; Allen, Petre & Gotthelf, 2001), but a thorough multi-wavelength study of SNRs is required in order to obtain a detailed understanding of the cosmic-ray acceleration process.
In this paper, we present our analysis of the non-thermal X-ray emission from the Galactic SNR G347.30.5 (also known as RX J1713.73949). First discovered during the Röntgensatellit () All Sky Survey (Pfeffermann & Aschenbach, 1996), this SNR has attracted a considerable amount of interest from the astronomical community. G347.30.5 is one of the brightest Galactic X-ray SNRs known with an X-ray flux density of 4.4 10-10 erg cm-2 s-1 (Pfeffermann & Aschenbach, 1996). Subsequent studies of this SNR based on and observations (Koyama et al., 1997; Slane et al., 1999) revealed that most of its X-ray emission is non-thermal and most likely produced by the synchrotron process. Unlike the X-ray spectra typically seen from most other SNRs, no thermal line emission was detected from any portion of G347.30.5 by these previous studies. The detection of non-thermal X-ray emission from this SNR has made G347.30.5 one of the prime examples of an SNR acting as an accelerator of cosmic-ray particles. In addition, Muraishi et al. (2000) detected emission from TeV photons located on the northwestern rim of G347.30.5: those authors argued that these photons were produced by the inverse-Compton scattering process, with cosmic microwave background photons scattering off high-energy cosmic-ray electrons accelerated along the shock front of this SNR. This result makes G347.30.5 only the third shell-type SNR besides SN 1006 (Koyama et al., 1995) and Cas A (Aharonian et al., 2001) reported to produce TeV emission. A detailed analysis of the evolutionary state of G347.30.5 using radio, X-ray and TeV observations of the bright northwestern rim was given by Ellison et al. (2001). Those authors also estimated the maximum energy of cosmic-ray protons accelerated by G347.30.5 to be approximately 20 TeV. Butt et al. (2001) argued that this SNR is accelerating cosmic-ray nuclei as well as cosmic-ray electrons based on positional coincidence between the northeastern rim of G347.30.5 and the -ray source 3EG J17143857 (Hartman et al., 1999), which is positionally coincident with a molecular cloud: this cloud is assumed to be interacting with G347.30.5. Cosmic ray acceleration by this SNR was also discussed by Enomoto et al. (2002), who presented a TeV spectrum for the northwestern rim of G347.30.5 and argued that this spectrum is best fit by the decay of neutral pion (0) particles rather than an inverse Compton spectrum of upscattered cosmic background photons. These pions are presumed to be produced by the collision of cosmic-ray protons (assumed to be accelerated by G347.30.5) with protons in the molecular cloud, as described by Enomoto et al. (2002). This result is in part based on the assumption that 3EG J17143857 is associated with G347.4-0.5 and, if correct, would represent significant observational evidence for cosmic-ray proton acceleration by an SNR (Aharonian, 2002). However, Reimer & Pohl (2002) and Butt et al. (2002) have disputed the association with the -ray source and instead claim that, while G347.30.5 is very likely an accelerator of cosmic-ray electrons, no convincing evidence yet exists that it accelerates hadrons as well. Other recent work on G347.30.5 includes modeling of the spectrum of AX J1714.13912, a hard X-ray source associated with 3EG J17143857 (Uchiyama et al., 2002), the discovery of fine-structure filaments associated with the northwestern rim of G347.30.5 (Uchiyama et al., 2003) and finally, a discussion of the flux of high energy neutrinos from the northwestern rim of this SNR, assuming that the TeV spectrum is produced by the decay of neutral pions, which yield neutrinos in the decay process (Alvarez-Muñiz & Halzen, 2002). In this paper, we present a spatially-resolved broadband spectral analysis of G347.30.5 in order to analyze the high energy emission from this SNR and probe cosmic-ray acceleration by this source. Like many Galactic SNRs, the distance to G347.30.5 and its age are not well known: early studies of this SNR suggested a low distance of about 1 kpc assuming G347.30.5 is in the Sedov stage of evolution (Pfeffermann & Aschenbach, 1996) or that it is associated with the historical supernova of 393 A.D. (Wang, Qu & Chen, 1997). In addition, Koyama et al. (1997) derived a distance of 1 kpc by comparing their measurement of the column density toward this source with the total column density in the direction of the Galactic Center. Such a low distance suggests that G347.30.5 is a young SNR with an age of about 2000 years. However, a subsequent analysis by Slane et al. (1999) instead favored a larger distance of 6 kpc based on a postulated association between G347.30.5, an HII region and a complex of three molecular clouds: such a distance would imply a much greater age of about 104 years. We will adopt a distance to G347.30.5 of 6 kpc for this paper in order to be consistent with the analyses presented by Slane et al. (1999) and Ellison et al. (2001) as well as the putative association between this SNR and the recently discovered pulsar J1713-3949, believed to lie at a distance of 5.00.2 kpc based on measurements of its dispersion measure (Crawford et al., 2002).
The organization of this paper is as follows: in Section 2, we describe the observations of G347.30.5 using ROSAT (Section 2.1), ASCA (Section 2.2) and RXTE (Section 2.3). While the ROSAT and ASCA observations have been presented previously, the RXTE observations are presented here for the first time. The spectral fitting and analysis for the datasets from all of the observations are described in Section 3, including descriptions of the models used to fit the non-thermal and thermal components to the X-ray emission. The results of this spectral fitting are presented in Section 4: we discuss in turn the maximum energies of electrons shock-accelerated by G347.30.5 (Section 4.1), our search for thermal X-ray emission from different regions of this SNR (Section 4.2), and the nature of the weak emission line found in the RXTE PCA spectrum of this source (Section 4.3). In our RXTE PCA data, we have searched for pulsed X-ray emission from the recently detected radio pulsar which is possibly associated with the discrete X-ray source seen at the center of G347.30.5: we describe this search in Section 4.4. A study of the broad-band spectrum of the northwestern rim of G347.30.5 from radio to -ray wavelengths is presented in Section 5. Comparisons between G347.30.5 and two similar SNRs (SN 1006 and G266.21.2) are presented in Section 6, and lastly the conclusions are given in Section 7.
2 Observations and Data Reduction
In this Section we discuss the X-ray observations that were used in this analysis, including the instruments used and the data reduction processes. These observations include archived data from observations of G347.30.5 that were made using the Position Sensitive Proprtion Counter (PSPCB, hereafter referred to as just PSPC) of and the Gas Imaging Spectrometer (GIS) of . We include our observations of this SNR using the Proportional Counting Array (PCA) of the Rossi X-ray Timing Explorer (). These data sample the X-ray emission from G347.30.5 over nearly two full decades of energy (0.5 keV to 30 keV). Details of the observations for each instrument are provided in Table 1.
2.1 PSPC Observations and Data Reduction
observed G347.30.5 at a location near the center of the remnant using the PSPC, a multiple-wire proportional counter sensitive to photons that have energies between approximately 0.1 and 2.0 keV. The energy resolution / is 0.43 at 0.93 keV and the field of view of the telescope is 2∘. For our off-axis observations, the angular resolution is 50 arcseconds (50% encircled-photon radius), and the maximum on-axis effective area of the system is about 260 cm2 (Pfeffermann et al., 1987).
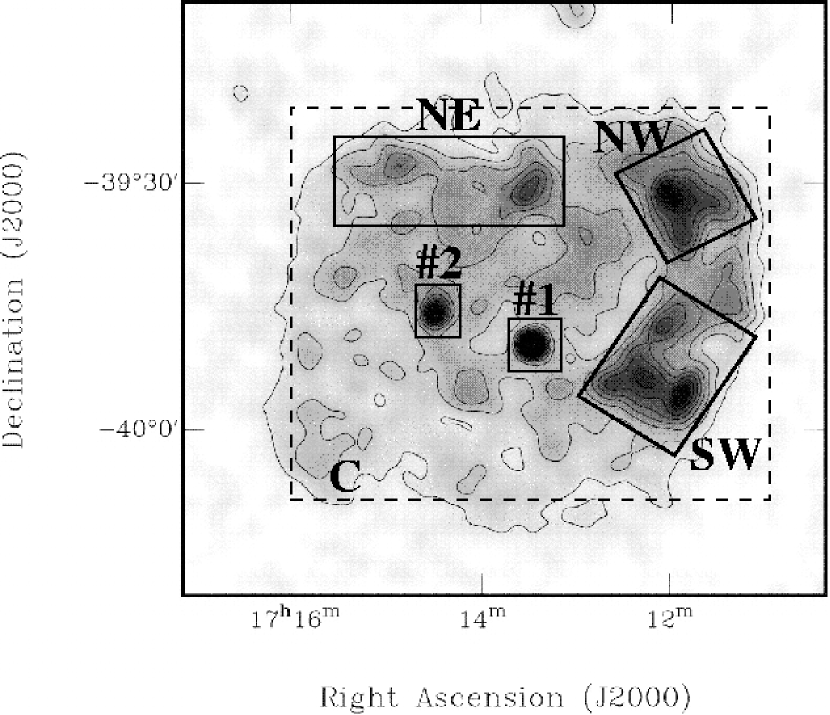
Spectra were constructed using the PSPC data for four spatially separate regions: the luminous northwestern and southwestern rims, the northeastern rim and the interior region. This final region was considered in order to analyze diffuse emission from the interior of the SNR. Emission from the two bright interior point sources – 1WGA J1714.43945 and 1WGA J1713.43949 (Pfeffermann & Aschenbach, 1996; Slane et al., 1999) – were subtracted from this region before a spectrum was extracted. The former source appears to be associated with a foreground star while the latter may be the X-ray counterpart to a recently-discovered radio pulsar. This radio pulsar may in turn be associated with G347.30.5: we will discuss this source in more detail in Section 4.4. An image from the PSPC observation appears in Figure 1 with the positions of these regions indicated. Fits to the spectra extracted from these regions will be described in Section 3.2.
2.2 GIS Observations and Data Reduction
The instruments on (Tanaka, Inoue & Holt, 1994) observed locations on the southwestern rim, the northwestern rim and the northeastern rim of G347.30.5. While both the GIS and the Solid-State Imaging Spectrometer (SIS) aboard collected data during these observations, the GIS has a larger field of view so only the data from the GIS were considered for the present study. The GIS consists of two units (denoted as GIS2 and GIS3) of imaging gas scintillation proportional counters with a sealed-off gas cell equipped with an imaging phototube: for our research, we only considered data collected by the GIS2 unit. The GIS is sensitive over the energy range of approximately 0.7 - 10 keV and has an energy resolution of / = 0.078 at 6 keV (Ohashi et al., 1996; Makishima et al., 1996). The field of view of the GIS is 22 in radius and the maximum effective area for our off-axis observations is 94 cm2 at 2.07 keV. The data from these observations were reduced using standard GIS reduction techniques as described in “The Data Reduction Guide, Version 2.0.” The reduction process filtered data for elevation angle, stable pointing directions, the South Atlantic Anomaly and cut-off rigidity. The data were also screened for characteristics of the GIS internal background and screening based on event locations and rise time. The standard script “ASCASCREEN” was run in order to accomplish much of this reduction. We extracted spectra for the northwestern rim, the southwestern rim and the northeast rim of the SNR using the same regions as in the PSPC spectral analysis. Fits to these spectra will be discussed in detail in Section 3.2.
2.3 PCA Observations and Data Reduction
G347.30.5 was observed by the PCA with a pointing position that was offset by 7.8′ from the nominal center of the SNR to avoid contaminating flux from three nearby X-ray binaries (4U1708408, 1RXS J170849.0400910 and GPS1713388) that appear close to G347.30.5 in the sky. Each of these X-ray binaries is located approximately 1∘ from the pointing position, so none of them appeared within the field of view (1∘ FWHM) of the RXTE PCA observation. Therefore, effects of contaminating flux from these X-ray binaries may be safely ignored.
The PCA is a spectrophotometer comprised of an array of five coaligned proportional counter units that are mechanically collimated to have a field of view of 1∘ FWHM. The array is sensitive to photons that have energies between approximately 2 and 60 keV. The energy resolution / of the array is 0.18 at 6 keV, and the maximum on-axis collecting area is about 6000 cm2 at 9.72 keV. The PCA data were screened to remove the time intervals during which (1) one or more of the five proportional counter units is off, (2) G347.30.5 is less than 10∘ above the limb of the Earth, (3) the background model is not well-defined and (4) the pointing direction of the detectors is more that 0∘.02 from the nominal pointing direction in either right ascension or declination. After screening the data using these criteria, a final dataset was prepared. The PCA background spectrum for G347.30.5 was estimated using the the FTOOL 111See http://heasarc.gsfc.nasa.gov/docs/software/ftools/ftools_menu.html for more information about FTOOLS..
G347.30.5 lies toward the direction of the Galactic Ridge (GR), a region of the Galaxy which features extensive diffuse X-ray emission as described by Valinia & Marshall (1998). G347.30.5 falls within the sub-region of the GR denoted as R1 by those authors: for this sub-region, Valinia & Marshall (1998) obtained a best-fit for the observed X-ray emission using a two component model. The first component is a Raymond-Smith plasma component (Raymond & Smith, 1977) – denoted as – which describes the emission spectrum from a hot diffuse gas, including line emissions from several elements. Using this model, with abundances frozen to solar, Valinia & Marshall (1998) obtained a temperature of = 2.9 keV for the thermal emission from this sub-region of the GR. The second component was a simple power law (denoted as ) which models the non-thermal emission from this sub-region: Valinia & Marshall (1998) obtained a photon index of 1.8 for this component. Lastly, the derived column density for the spectral fit was H = 1.81022 cm-2. To sample this background X-ray emission, two additional observations were made with the PCA of fields adjacent to the field observed in the pointed observation of G347.30.5: we denote these fields as Background Region 1 and Background Region 2, respectively (see Table 1). We note that the approximate pointing errors for all of the PCA observations are 8″. Data from these two observations were reduced in the same way as the data from the pointed observation of G347.30.5. In Figure 2, we present spectra extracted for the on-source observation and both of the background observations. We will return to a discussion of X-ray emission from the GR in Section 4.3.
3 Spectral Fitting and Analysis
3.1 The Spectrum of G347.30.5
After reducing all of the data, we proceeded to perform spectral-fitting analysis using the X-ray spectral-fitting package 222See http://heasarc.gsfc.nasa.gov/docs/xanadu/xspec/index.html for more information about XSPEC., first considering the PCA data. Given that the X-ray emission from G347.30.5 is known to be almost entirely non-thermal and probably produced by electrons emitting synchrotron radiation, we used three models for non-thermal X-ray emission to fit the data: a simple power law, the model and the model. An emission feature is seen in the PCA spectrum near 6.4 keV: to model this feature, we included a Gaussian component with each of the models used in the spectral fitting (see Section 4.3 for a more detailed discussion about this apparent feature). In all cases, photoelectric absorption along the line of sight was modeled using the Wisconsin (Morrison & McCammon, 1983) cross-sections and relative abundances of elements as described by Anders & Ebihara (1982).
: Earlier studies of the X-ray spectra associated with the bright rims of G347.30.5 by Koyama et al. (1997) and Slane et al. (1999) revealed that the X-ray emission from the northwestern rim, the southwestern rim and the eastern region of G347.30.5 could all be adequately fit using a simple power law (with a photon index of 2). These fits were made based on and observations (extending to approximately 10 keV), and we performed a fit to the data using a power law with approximately the same index. We included a second component, a Gaussian with a line width frozen to 0 keV, to fit the apparent emission feature seen near 6.4 keV. We discuss this emission feature in more detail in Section 4.3.
Figure 3 shows a POWER LAW+GAUSSIAN fit to the spectrum extracted from the PCA observations, using an photon index of 2.33 to correspond to the weighted mean value of photon indices obtained in the fits made to the northwestern rim, southwestern rim and eastern region of G347.30.5 by Slane et al. (1999). Clearly, this model did not fit the data in this energy range, yielding a reduced 2 of 482. Even when the photon index was a free parameter, an acceptable fit was still not obtained: in Figure 4, we plot the results of a POWER LAW+GAUSSIAN fit where we fit the photon index. In this Figure, the photon index is 2.61, yielding a 2 of 1808 for 49 degrees of freedom (a reduced 2 of 36.9). While this is certainly an improvement, this model still does not fit the data. We conclude that the power law models employed by Slane et al. (1999) over the energy ranges sampled by and cannot be extended into the energy range. The energy distribution of the electrons that produce the observed X-ray spectrum is therefore inconsistent with a simple power law.
: The second model used in our analysis was , which describes a synchrotron spectrum from an electron distribution limited by particle escape above some energy. This model was used by Dyer et al. (2001) to sucessfully fit the X-ray spectrum of SN 1006, and thorough descriptions of this model are presented by Reynolds (1996) and Reynolds (1998). The model describes electrons which are shock-acclerated in a Sedov blast wave encountering a constant-density medium containing a uniform magnetic field. This model also includes variations in electron acceleration efficiency with shock obliquity and post-shock radiative and adiabatic losses.
In Figure 5, we present a fit to the spectrum using the model combined with the model. Similar to our attempts to fit the spectrum with a + model, we could not obtain an acceptable fit to the spectrum of G347.30.5 using this model. For the plotted model, the corresponding ratio of 2 to degrees of freedom is 2451/48 = 51.07. We therfore conclude that the model, like the model, does not properly describe the non-thermal X-ray emission seen from this SNR.
: The third model we considered is denoted as : it was described by Reynolds (1998), Reynolds & Keohane (1999) and Hendrick & Reynolds (2001), with the latter two papers implementing the model in their study of the maximum energies of electrons accelerated by samples of SNRs in the Galaxy and the Large Magellanic Cloud, respectively. The model describes a synchrotron spectrum from an exponentially cut off power law distribution of electrons in a uniform magnetic field. The photon spectrum is itself a cut-off power law, rolling off more slowly than an exponential in photon energies. Though this model is an oversimplification, it is more realistic than a power law and it does give the maximally curved physically plausible spectrum. This spectrum can in turn be used to set limits on maximum accelerated electron energies even in remnants whose X-rays are thermal. The model assumes an electron energy spectrum e() of the form
| (1) |
where is a normalization constant derived from the observed flux density of the region of the SNR at 1 GHz, is defined as 2+1 (where is the radio spectral index) and cutoff is the maximum energy of the accelerated cosmic-ray electrons. A crucial advantage of this model (as well as the model) is that a resulting fit may be compared with two observable properties of an SNR, namely its flux density at 1 GHz and . Finally, one of the fit parameters for the and models is the cutoff frequency of the synchrotron spectrum of the electrons. This quantity is defined as the frequency at which the flux has dropped by a factor of 10 from a straight power law. We can express in a way which is quantitatively consistent with previous work (Reynolds, 1998; Reynolds & Keohane, 1999; Hendrick & Reynolds, 2001) as
| (2) |
where is the magnetic field strength of the SNR in G, assuming the electrons are moving perpendicular to the magnetic field. By using the value for returned by as well as the normalization factor , the synchrotron spectrum of the shock-accelerated electrons can be adequately described. Moreover, an estimate for the maximum energy cutoff for the shock-accelerated electrons can also be derived.
In Figure 6, we present a fit to the spectrum using the model. Clearly, this model gives the best-fit to the spectrum of G347.30.5 over this energy range: the corresponding value for 2/degrees of freedom is 207.98/48 = 4.33, which is a considerable improvement (though still not statistically acceptable) over the fits obtained by both the model and the model. The normalization for the component of this fit indicates that the flux density at 1 GHz for the entire SNR is 6.9 0.2 Jy (90% confidence limits). This value is marginally consistent with the weak radio emission seen from this SNR, known to be dominated by a source of emission at the northwestern rim of G347.30.5 with a corresponding flux density of 4 1 Jy (Ellison et al., 2001). Moreover, the broad field of view of the PCA certainly intercepts diffuse X-ray flux from other sources besides G347.30.5, which leads to a corresponding increase in the value for returned by the fit. We also note that by using the best fit value for cutoff, Equation 2 yields cutoff 68 TeV (assuming a magnetic field strength of 10 G). This is in good agreement with the value of cutoff obtained by Ellison et al. (2001) using a similar value for μG with different models. Based on our success in fitting the spectrum of G347.30.5 with the model, we conclude that the energy distribution of the highest energy cosmic-ray electrons accelerated by this SNR is consistent with an exponentially cut-off power law.
3.2 Joint Spectral Fitting of PSPC, GIS and PCA Data
We next applied the model to the X-ray spectrum of G347.30.5 as observed by the PSPC and the GIS as well as the PCA. We took advantage of the spatial resolving capabilities of the PSPC and the GIS in order to simultaneously fit spectra extracted from particular regions of the SNR. We simultaneously fit eight different X-ray spectra: the spectra for the northwestern rim, the southwestern rim, the northeastern rim and the diffuse central emission (with the two interior point sources omitted) as observed by the PSPC, the spectra for the northwestern rim, the southwestern rim and the northeastern rim as observed by the GIS and finally the spectra for the whole SNR as observed by the PCA.
Two models (each a combination of a thermal component and a non-thermal component) were used for the joint spectral-fitting process – namely a + model and an + model – in order to fit both the thermal and non-thermal components respectively in the individual specta. In their study of the X-ray spectrum of G347.30.5 based on PSPC and GIS data, Slane et al. (1999) found no evidence for thermal emission from any portion of the SNR. We revisted this issue by testing whether the joint fit to the individual spectra would be improved by the inclusion of a thermal component. Both thermal models describe the emission spectrum from a hot diffuse gas, including line emission from several elements, that is in a state of collisional ionization equilibrium. Both of these models have a common set of parameters: a plasma temperature , an abundance , a redshift and an emission measure . For the purposes of the present work, we froze the values of and to unity (i.e., solar abundance) and zero, respectively. The emission measure is defined as
| (3) |
where is the distance to the source in centimeters and e and H are the electron and hydrogen densities, respectively, in units of cm-3. We can evaluate this expression as follows: we recall that we have assumed a distance of 6 kiloparsecs to G347.30.5 and we note that the angular size of this SNR is 65 55 (Green, 2001), therefore the corresponding linear radius is 1.65 1020 cm. Assuming a spherical volume for the SNR with a filling factor of one-quarter (that is, assumed only one-quarter of the total volume of the SNR is filled with thermal particles that produce the observed emission), as well as uniform values for e and H throughout the volume, then Equation 3 yields
| (4) |
We can estimate the ambient densities of hydrogen surrounding G347.30.5 from the values obtained from the spectral fits for (assuming e = 1.2 H). We will continue this discussion when we describe our detection of thermal X-ray emission from G347.30.5 in Section 4.2.
We have modeled the background diffuse X-ray emission from the GR as observed by the PCA with the same two component model used by Valinia & Marshall (1998) mentioned earlier, namely a + model where the abundance is frozen to solar values and the redshift is frozen to zero. We froze the values for , photon index and H to be 2.9 keV, 1.8 and 1.8 1022 cm-2, respectively: these are the same best-fit values measured by Valinia & Marshall (1998). The normalizations for the and components were left as free parameters.
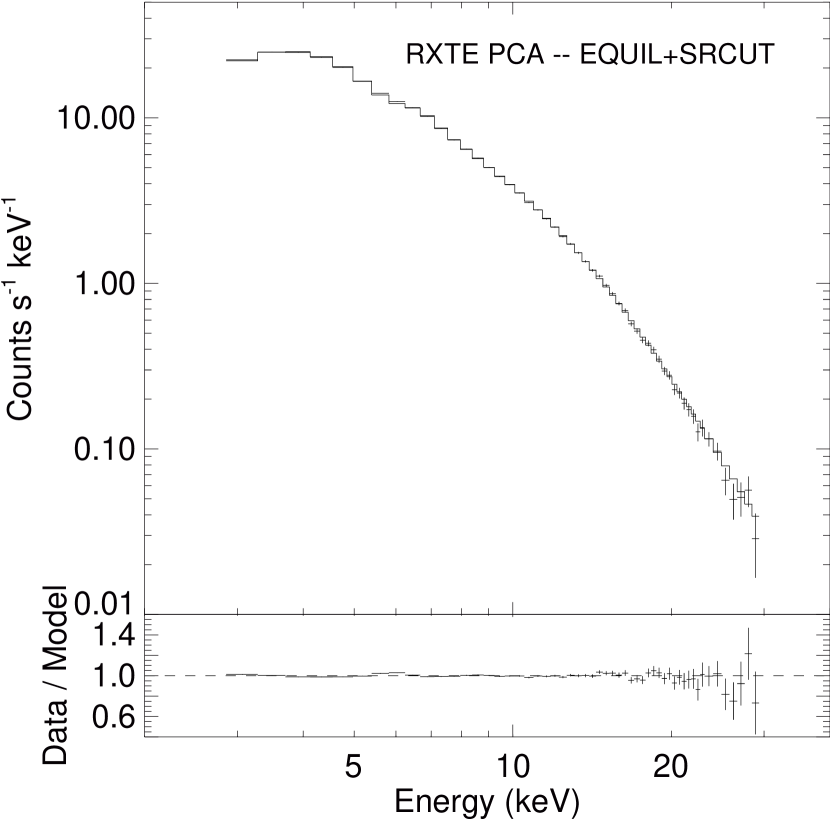
In Figures 7 through 9, we present data, fits and residuals for the spectra extracted from the PSPC regions (Figure 7), the GIS regions (Figure 8) and the whole SNR as observed by the PCA (Figure 9) using the + model. Similarly, in Figures 10 through 12, we present data, fits and residuals for the same set of spectra using the + model. In Tables 2 and 3, we present the fit parameters for the depicted fits: the quality of the two fits is comparable for the two models (a 2/degrees of freedom of 808.25/471 = 1.72 for the + model compared to a 2/degrees of freedom of 843.76/472 = 1.79 for the + model for 501 pulse height amplitude bins). We emphasize that, for both two-component models, the fits successfully reproduce the observed radio properties of G347.30.5, namely the two estimates for the flux densities at 1 GHz for the northwestern rim are both consistent with the observed value of 4 1 Jy (Ellison et al., 2001). Also, the estimates for the flux densities at that frequency for the other portions of the SNR are very modest, also consistent with observations. In the next section we discuss these fit parameters in more detail.
4 Results
4.1 Cutoff Energies of Electrons Shock-Accelerated by G347.30.5
The electron energy e associated with synchrotron photons radiated at energy X is given by the relation
| (5) |
We can use this equation and the values for cutoff derived by our fits to estimate the maximum energy cutoff of the electrons accelerated by G347.30.5. We took four values for cutoff yielded by our fits to the emission from the northwestern rim and the diffuse central emission using the + model and the + model. Using Equation 5, X = cutoff yields an estimate for cutoff (assuming a magnetic field of 10 G), and we list our calculated values for cutoff in Table 4. These values range from approximately 19 TeV to 25 TeV and are consistent with the values obtained by Ellison et al. (2001). We agree with the results and arguments of Slane et al. (1999) and Ellison et al. (2001) that G347.30.5 is accelerating cosmic-ray electrons to the “knee” energy of 3000 TeV. In Section 5, we describe a more rigorous attempt to estimate the maximum energy of cosmic-ray electrons accelerated by this SNR, where we simultaneously consider radio, X-ray and TeV emission from the northwestern rim. We will employ a more sophisticated fitting method where the ambient magnetic field strength is allowed to vary.
4.2 Thermal X-ray Emission from G347.30.5?
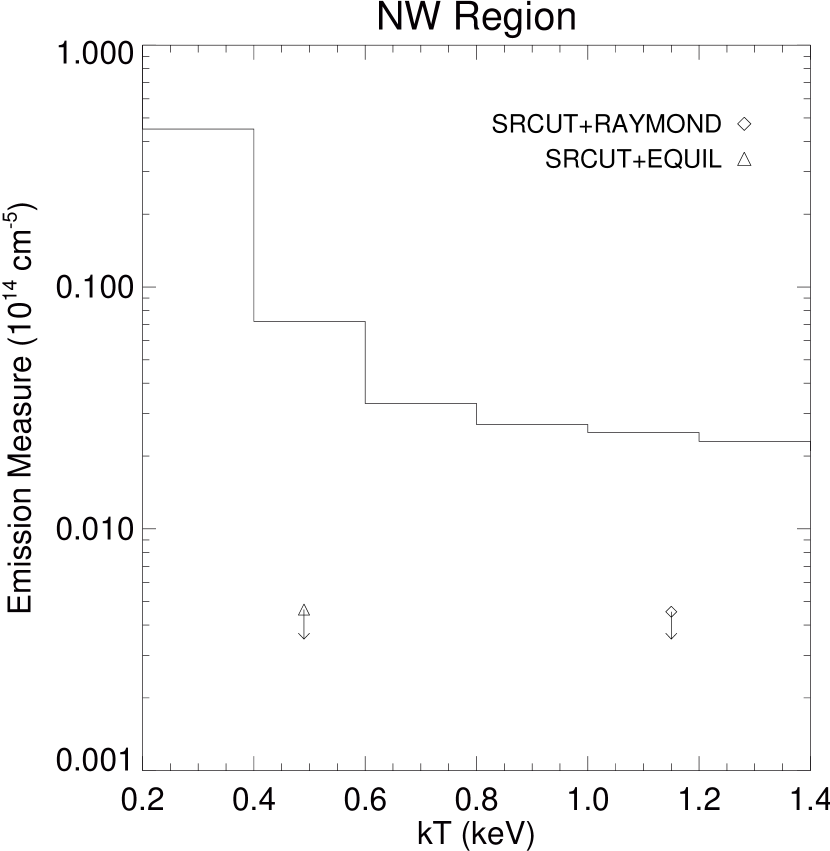
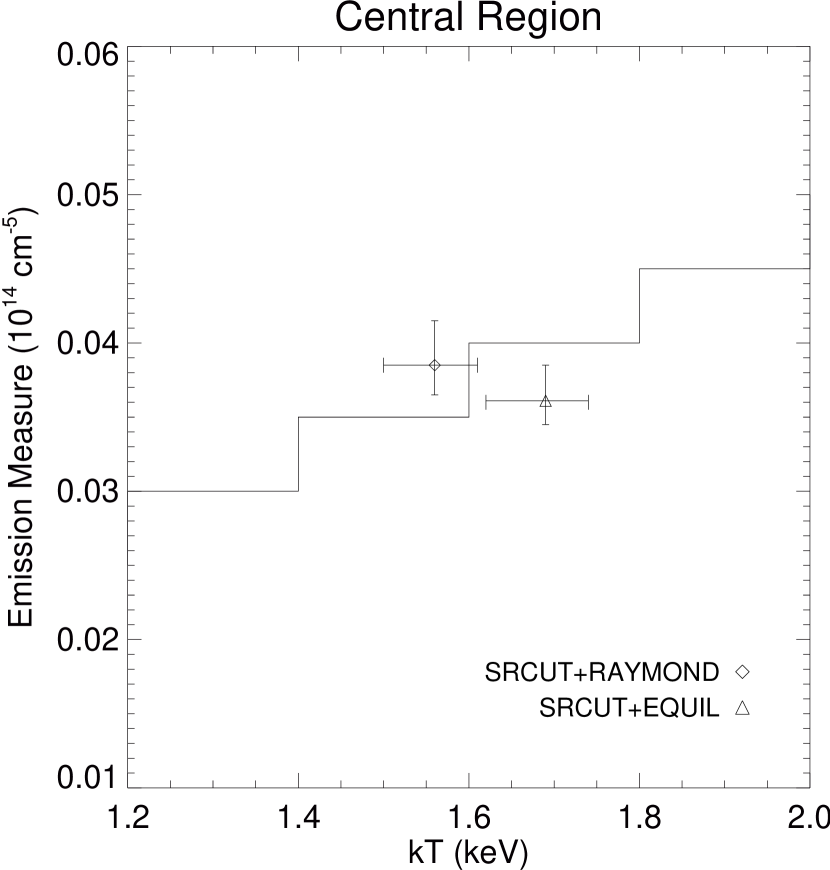
Previous X-ray observations of G347.30.5 by Koyama et al. (1997) and Slane et al. (1999) found no evidence for thermal emission from any portion of this SNR. Slane et al. (1999) placed upper limits on the amount of thermal emission as a function of for both emission from the northwestern rim and the central diffuse emission of G347.30.5. By including a thermal component in fits to the X-ray emission from G347.30.5, we re-examine the upper limits on thermal emission derived by Slane et al. (1999).
In Table 4, we present values for cutoff, , H and e = 1.2 H, as calculated from our model fit values for , and Equation 4. We have considered only the fit values for the northwestern rim and the central diffuse emission based on the results of both the + model and the + model. For the northwestern rim, we can only provide upper limits for H and e. In Figures 13 and 14, we plot our values for for the northwestern rim and the central diffuse emission, respectively, against the upper limits derived by Slane et al. (1999). We find that for the northwestern rim, our values for fall well below the upper limits of Slane et al. (1999), but for the diffuse emission form the central region, our values for more closely straddle the upper limits, and in the case of + our value exceeds the upper limit. This result indicates the first detection of thermal X-ray emission from G347.30.5: we speculate that earlier work may have missed this thermal emission because earlier efforts had concentrated on the non-thermal properties of this SNR (particularly the bright rims of this SNR) and only considered a narrower energy range of the spectrum of G347.30.5. In addition, the rather large angular size of this SNR makes it difficult to completely sample all of its X-ray properties. A more thorough understanding of the rather modest thermal emission from this SNR will require additional observations and modeling.
4.3 The Detection of Iron Emission – Galactic Ridge Background?
We now comment on a modest spectral feature seen near 6.4 keV in the PCA spectrum of G347.30.5 and at a similar energy in the spectra from the two background observations also made with the PCA. This emission feature may be associated with iron, which is known to produce a broad set of emission features between the energies of 6 keV and 7 keV. One possibility to consider is that the feature is produced by thermal emission from G347.30.5: we note that Bykov (2002) has recently argued that fast moving isolated fragments of SN ejecta composed of heavy elements (such as iron) should produce K fluoresence emission lines at X-ray energies, and that the iron K fluoresence emission line energy is known to be approximately 6.4 keV. A second possibility is that the feature originates from diffuse emission associated with the GR, which is seen in projection beyond G347.30.5. The large field of view of the PCA (approximately 1∘ FWHM) and the lack of imaging capabilities of this instrument make it difficult to clearly associate this feature with either G347.30.5 or the GR. Recently, Tanaka (2002) presented an analysis of spectral features – including the iron K fluoresence emission line – associated with different portions of the GR, as observed by the SIS.
In Table 5, we present the line energies and normalizations (along with the 90% confidence limits for these values) for the emission feature as seen in the PCA spectra of G347.30.5 and the two background pointings. We also performed a simultaneous fit of the emission feature as seen in the three spectra, where the line energies and the normalizations for the feature as seen in each spectra were fixed to be the same. We also present the best-fit values for the line energy and the normalization for the joint fit as well. Notice that in each case, the line energies and the normalizations are all approximately the same, within the confidence limits. In order to check for any instrumental effects that may be corrupting the data, we obtained archived data from an PCA observation of Cas A made on 1999 August 5 (OBSID 40806010400): we selected this particular observation of Cas A for analysis because it took place nearly contemporaneously to our G347.30.5 observation (less than two months later). Using the same data reduction techniques described in Section 2.3, we generated a source spectrum of Cas A and measured both the line energy and the normalization of the iron K emission line seen in the spectrum of Cas A. We measured a line energy of 6.66 keV, which is in good agreement with the energy of this emission line in the SIS spectra of Cas A as observed by Holt et al. (1994). Thus, we conclude that there are no instrumental effects that are corrupting our analysis of the emission feature near 6.4 keV.
We therefore hypothesize that the spectral feature seen in the PCA is not associated with G347.30.5 for two major reasons. First, this feature was not detected by either Slane et al. (1999) or by us during the analysis of GIS observations of this SNR which sampled the energy range which includes this spectral feature. Second, by inspection of Figure 2 and Table 5, it is clear that the emission feature is seen in both the on-source PCA pointing and the two background pointings, and the line energies and normalizations of the emission features for all three pointings are similar. If this feature was associated with G347.30.5 rather than the GR, we would expect that the line energy and/or the normalization in the source region would significantly differ from the values seen for the feature in the two background pointings. In the study of spectral features observed from diffuse X-ray emission from the GR, Tanaka (2002) found that only diffuse emission from within 1∘ of the Galactic Center exhibited a feature near 6.4 keV, while the diffuse line spectrum from two other regions – centered at longitudes of 10∘ and 28.5∘, respectively – were dominated instead by a feature near 6.7 keV. Because neither of these two regions include the positions of G347.30.5 or the two background regions, however, we argue that the results from Tanaka (2002) are not applicable to our study presented here. We therefore conclude that the spectral feature is not associated with G347.30.5 and instead originates in the diffuse X-ray emission from the GR seen in projection beyond G347.30.5.
4.4 X-ray Pulsations from the Radio Pulsar PSR J17133949 (Possibly Associated with 1WGA J1713.43949 and G347.30.5)?
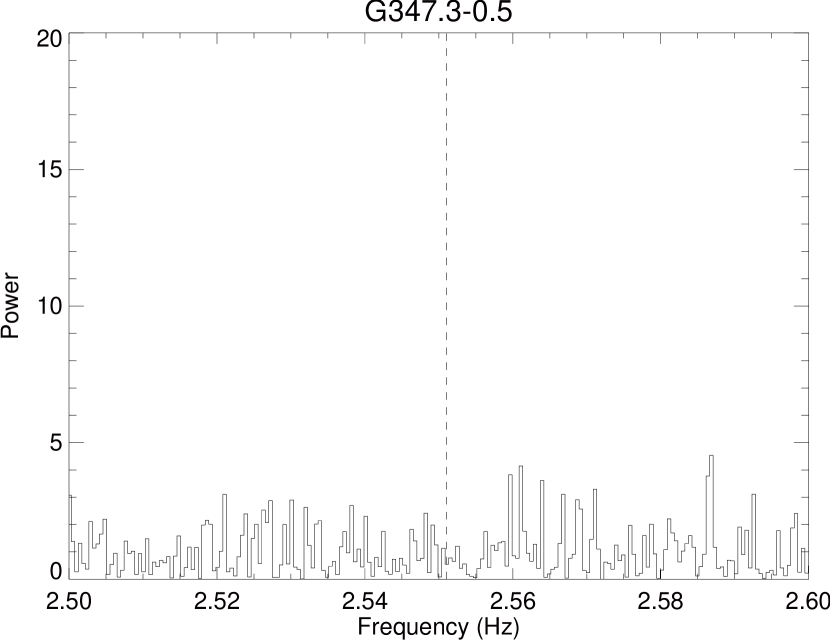
Recent radio observations of 1WGA J1713.43949 (the X-ray source centrally located inside G347.30.5) by Crawford et al. (2002) discovered a new pulsar (PSR J17133949) with a period of 392 ms within 7 arcminutes (the discovery beam radius) of the X-ray source. Crawford et al. (2002) derived a distance of 5.00.2 kiloparsecs to this source, which is consistent with the distance estimate to G347.30.5 of Slane et al. (1999). The position of 1WGA J1713.43949 near the center of G347.30.5 suggests that the X-ray source (as well as the radio pulsar) and the SNR are associated. In addition, the position of G347.30.5 itself near a molecular cloud also suggests that the SNR was produced by a massive star in a core collapse SNe: these types of SNe are expected to produce neutron stars. To further investigate the nature of 1WGA J1713.43949, we performed a timing analysis of our PCA data to search for pulsations from this source.
In Figure 15, we present a power spectrum of our PCA data over the frequency range of 2.5 through 2.6 Hz with a dashed vertical line indicating a period of 392 ms (2.55 Hz). We find no evidence for pulsations in our spectrum at any frequency, including 2.55 Hz. Our failure to detect pulsations from this central source may be explained by several factors, such as significant contaminating diffuse background emission from the GR, cosmic ray background and finally emission from the SNR dominating over emission from a pulsar over the energy range sampled by our PCA observation. Pointed high angular resolution X-ray observations would be much more sensitive to pulsed X-ray emission from this source.
5 The Broadband Energy Spectrum of the Northwestern Rim of G347.30.5
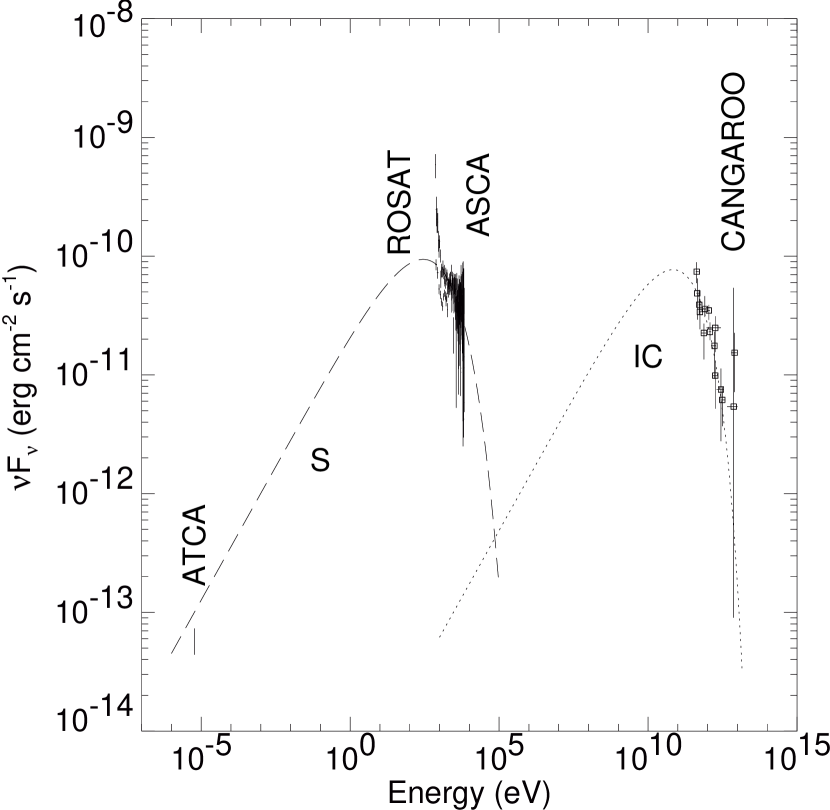
In Figure 16, we present a broadband energy spectrum of the northwestern rim of G347.30.5 ranging from radio through -ray energies. We have constructed this diagram using published values for the 1 GHz radio observation of G347.30.5 by the Australian Telescope Compact Array (ATCA) as presented by Ellison et al. (2001), the PSPC and GIS data described previously in this paper and data from the CANGAROO observation at TeV energies of the spectrum of this rim as published by Enomoto et al. (2002). Using the software package333See http://space.mit.edu/ASC/ISIC/ for more information about . (Houck & Denicola, 2000), we obtained a fit to the energy spectrum using a model that includes multiple high energy processes associated with SNRs, as indicated by separate curves. These curves indicate the emission profile expected by a shock-accelerated population of electrons from two different processes: synchrotron emission (as indicated by the curve labeled “S”), and inverse-Compton emission from cosmic microwave background photons that have been upscattered to TeV energies by energetic cosmic-ray electrons (the curve labeled “IC”). These emission models are consistent with the models employed by Sturner et al. (1997), and a detailed discussion of the high energy emission from non-linear shock acceleration processes associated with SNRs is given by Baring et al. (1999). From our fit to the GIS data and the TeV data, we have derived estimates for cutoff for the accelerated cosmic-ray electrons and magnetic field strength . For the depicted fit, the ratio of 2 to the degrees of freedom is 191.78/113 = 1.70. Based on this fit, we estimate a value of only 8.8 TeV for cutoff of the accelerated cosmic-ray electrons and a corresponding magnetic field strength of = 150 G. This value for cutoff is sharply lower (but still consistent) with the upper limit derived by Ellison et al. (2001), while the corresponding value for is considerably larger than the value of 10G assumed by Slane et al. (1999). There is also a modest amount of overlap between our range of values for and the the range suggested by Enomoto et al. (2002) (10 G – 100 G). However, the physical plausibility of this fit may be questioned based on the value derived for the ratio of the volumes for TeV emission and X-ray emission from the northwestern rim – that is, TeV/X-ray. In contrast to Enomoto et al. (2002), who fixed this ratio to equal unity, we allowed this ratio to vary and obtained a value of TeV/X-ray 1000, with a lower limit of 360, assuming that the power law index is 2.1 (derived from our from our model fits where = 0.55) and that there is no curvature to the electron spectrum. This ratio is too high to be physically acceptable, and suggests that the TeV emission from the northwestern rim of G347.30.5 is not produced by inverse Compton scattering of cosmic microwave background photons off high energy electrons accelerated along this rim of the SNR.
Nonetheless, while this TeV emission may not be produced by inverse Compton scattering, we argue that neutral pion decay also cannot produce this emission. We point out that in arguing that the TeV emission is produced by neutral pion decay, Enomoto et al. (2002) assumed an extremely large ambient density ( 100 cm-3 if a distance of 6 kpc to G347.30.5 is assumed) for the northwestern rim of the SNR. Our fits to the thermal component of the X-ray emission from the northwestern rim and the central diffuse emission yield a dramatically lower ambient density ( 0.05-0.07 cm-3) and make the conclusions of Enomoto et al. (2002) seem untenable. Slane et al. (1999) also concluded that G347.30.5 is expanding into an ambient interstellar medium with an extremely low density, and suggested that the SNR is expanding into the evacuated wind-blown cavity created by the stellar progenitor: we agree with this finding, and suggest that while G347.30.5 may have formed in the vicinity of dense molecular clouds, it has not yet begun to interact with these clouds. We also note that the observed TeV emission is observed to be centered on the northwestern rim of the SNR and not on the adjacent cloud, as assumed by Enomoto et al. (2002). Finally, Reimer & Pohl (2002) noted that if the flux of the GeV emission from the -ray source 3EG J17143857 can be used to constrain the neutral pion decay spectrum fit presented by Enomoto et al. (2002): if this source is associated with the northwestern rim of G347.30.5, its flux must be taken into account in all spectral fits, while if the -ray source is not associated with this rim, then the GeV emission may be treated instead as upper limits on flux along this energy range. Reimer & Pohl (2002) showed that the flux from the neutral pion decay spectrum fit exceeded the observed GeV emission by a factor of three, therefore strongly arguing against neutral pion decay as the process responsible for the TeV emission. For these reasons, we argue that the TeV emission observed from the northwestern rim of G347.30.5 is not produced by neutral pion decay. We also comment that if the ambient density is as low as inferred by our estimates, the process of non-thermal bremsstrahlung emission – as well as neutral pion decay – will be significantly suppressed. A non-thermal bremsstrahlung origin for the TeV emission may also be ruled out because a spectrum generated by this process would – like the spectrum produced by neutral pion decay – exceed the observed GeV emission. In conclusion, we state that none of the known high energy processes associated with SNRs – inverse Compton scattering, neutral pion decay and non-thermal bremsstrahlung – can adequately fit the observed TeV emission from the northwestern rim. From the work of Ellison et al. (2000), we suspect that all models of high energy emission from SNRs over broad energy ranges must take into account some curvature in the energy spectrum of accelerated electrons rather than assuming simple power laws. In such a case, one of these emission processes may be able to adequately fit the observed TeV emission from the northwestern rim of G347.30.5 – and perhaps the rims of other SNRs detected at such high energies – after all. We will discuss such curvature in the energy spectra of SNRs in more detail in a future work.
Lastly, we consider the putative association between G347.30.5 and the X-ray source AX J1714.13912, a hard spectrum source coincident with a molecular cloud located along the northeastern rim of G347.30.5. Uchiyama et al. (2003) presented an analysis of the spectral properties of this source using data from ASCA observations. The X-ray spectrum of this source was best fit by a power law with a rather flat photon index of =1.0, prompting Uchiyama et al. (2003) to argue that such a spectrum was best interpreted as non-thermal bremsstrahlung emission from particles accelerated at the shock interface between the northeastern rim of G347.30.5 and the molecular cloud. Despite the spatial proximity between G347.30.5 and the molecular cloud (and, by extension, AX J1714.13912), the evidence for the association between these sources is not compelling because, based on simulations of the interactions between SNRs and interstellar clouds (Jun & Jones, 1999), we expect the amount of radio emission from both the SNR and the cloud to dramatically increase as a result of the interaction. Jun & Jones (1999) also predict that if the SNR has overtaken the cloud, the radio emission from the SNR would “wrap around” the cloud, and such a morphology should be readily apparent. Radio images of G347.30.5 and its surrounding environment have been made with the Molonglo Observatory Synthesis Telescope (MOST) (Roberts, 1994) and presented by Slane et al. (1999) (at the frequency of 843 MHz) and Ellison et al. (2001) (at the frequency of 1.4 GHz). Inspection of these images reveals little (if any) radio emission at either the position of AX J1714.13912 or the northeastern rim of G347.30.5, and no evidence for a “wrap around” morphology in the radio emission. The failure to detect radio emission from the hard X-ray source or the northeastern rim of the SNR and a “wrap around” morphology to the radio emission argues against an interaction taking place at that site. Another reason to doubt that an interaction is taking place between G347.30.5 and the molecular cloud is related to the ratio of emission from rotational transitions of CO molecules, CO(=21)/CO(=10), as measured at the site of the cloud. An enhanced value for this ratio (such as a value of 1.2 or greater) is thought to indicate that an interaction is taking place between the cloud and a shock, such as the one associated with an SNR (Seta et al., 1998). Both Slane et al. (1999) and Butt et al. (2001) found an enhanced value for this ratio for the cloud along the northeastern rim of the SNR, but we suggest that in this particular case the enhanced CO(=21)/CO(=10) ratio and the low ambient density of the SNR cannot be reconciled, and that (as mentioned before) G347.30.5 is not currently interacting with this molecular cloud. Butt et al. (2001) measured a value for the flux ratio CO(=21)/CO(=10) of 2.40.9: according to Draine & Roberge (1984), such a flux ratio corresponds to a shock velocity of less than 5 km/sec in the cloud. The shock speed in a cloud is reduced by the square root of the ratio of the ambient densities. Based on CO observations (Bronfman et al., 1989; Butt et al., 2001), the mean density of the cloud has been estimated to be approximately 500 cm-3. From our spectral fits, we have inferred an average ambient density G347.30.5 to be 0.06 cm-3: from these estimates for the mean density of the cloud and ambient density around the SNR, we conclude that the shock velocity outside the cloud is less than 500 km/sec. For comparison, if we assume that the electrons and protons in G347.30.5 are in thermal equilibrium at = 1.5 keV (from our fits to the diffuse thermal emission from the SNR), then the corresponding shock velocity is approximately 1100 km/sec. Since the proton temperature is most likely much larger than the electron temperature in the case of young SNRs (Hwang et al., 2002), like G347.30.5, this value for the shock velocity is actually a lower limit, and therefore the shock velocity exceeds 1100 km/sec, which is in sharp disagreement with the shock velocity of 500 km/sec derived earlier. Uchiyama et al. (2003) noted that the large X-ray luminosity of AX J1714.13912 (1.7 1035 ergs/sec at the assumed distance of 6 kpc) made G347.30.5 barely able to provide enough kinetic energy (in the form of nonthermal particles) to power this source, unless G347.30.5 is much closer than 6 kpc or the SN explosion which created this SNR had more than 1051 ergs of energy. We suggest that G347.30.5 is located in the vicinity of the clouds, but has not yet started to interact with any of the clouds. More observations and analysis are required to determine the true nature of AX J1714.13912.
6 Comparison with Other Shell-Type SNRs with Non-Thermal X-ray Emission: SN 1006 and G266.2-1.2
In Table 6, we compare the gross properties of G347.30.5 with two other dynamically-young shell-type SNRs which possess significant non-thermal components to their X-ray emission, SN 1006 (Dyer et al., 2001; Allen, Petre & Gotthelf, 2001) and G266.21.2 (Slane et al., 2001). Inspection of this Table 6 reveals that all three SNRs are X-ray luminous, radio faint and are expanding into regions of the interstellar medium with particularly low ambient density. Both core-collapse and Type Ia SNe appear to produce SNRs with non-thermal X-ray emission: SN 1006 is the archetype of a SNR produced by a Type Ia SN, while G266.21.2 and G347.30.5 are thought to be produced by Type II SNe. The X-ray morphologies of these three SNRs also contrast as well: for SN 1006, the morphology is bilateral with two X-ray bright rims, visible in images of this SNR (Dyer et al., 2001), while the morphologies of both G266.21.2 and G347.30.5 feature multiple bright rims: and images of these two SNRs reveal luminous northwestern, southwestern and northeastern rims for both SNRs, while G266.21.2 also has a luminous southern rim as well (Slane et al., 1999, 2001). The X-ray synchrotron flux depends on the exponential cut-off energy, the strength of the magnetic field, and the density of nonthermal electrons. In the case of SN 1006, the morphology may be due to an enhancement (via compression) in the magnetic field along the two bright rims relative to the magnetic field strength elsewhere along the rim. The morphology of SN 1006 – with two symmetric luminous X-ray rims – was reproduced remarkably well by the work of Reynolds (1998), who described models of synchrotron X-rays from shell supernova remnants. In the cases of G347.30.5 and G266.21.2, the cause of the morphology is not clear. The bright rims may be associated with regions where the density of nonthermal electrons is relatively high. The common property of low ambient density for these SNRs does not imply an exclusive requirement for non-thermal X-ray emission: for example, another SNR, Cas A, possesses a strong non-thermal X-ray component to its emission (Vink & Laming, 2003) – though not a component which dominates the X-ray spectrum of the SNR – and is expanding into a particularly dense ambient medium. Nonetheless, it appears that a low ambient density – independent of the type of SN progenitor – is conducive to the X-ray spectrum of the SNR being dominated by non-thermal X-ray emission. Deep X-ray observations and detailed analysis of other SNRs located in regions of low ambient density are required to determine the degree to which low ambient density is necessary for producing this type of X-ray emission: we will explore this subject in more detail using a sample of such SNRs in a future work.
7 Conclusions
The results and conclusions of this work may be summarized as follows:
1) We present a spatially-resolved X-ray spectral analysis of both the three bright rims and the diffuse central emission of the Galactic SNR G347.30.5. This analysis involves data from observations made of this source using instruments aboard three different X-ray satellites (namely the PSPC, the GIS and the PCA) spanning the approximate energy range of 0.5 – 30 keV.
2) We have successfully fit the spatially-resolved X-ray spectra of G347.30.5 using the model, describing an exponential cut-off in the population of the highest energy electrons accelerated by this SNR. In contrast, neither the model nor a simple power law model yielded acceptable fits to the data. We find that the power law fits obtained by Slane et al. (1999) to fit the spectrum of G347.30.5 over the energy range of 0.5-8 keV do not adequately fit the spectrum of this SNR at higher energies. We have also detected for the first time a thermal component to the X-ray emission from this SNR: this component appears to be more closely associated with central diffuse emission from the SNR than from the X-ray luminous rims. We estimate the ambient density surrounding the SNR to be 0.05-0.07 cm-3: this value is consistent with the range of values obtained by Slane et al. (1999).
3) A weak emission feature is seen near 6.4 keV in our PCA spectra of G347.30.5 and our two background pointings which sample the GR. Because the strength and the line energy of this feature are approximately the same in all three pointings, we argue that the feature is associated with diffuse background emission from the GR rather than from G347.30.5 itself.
4) We have analyzed our PCA data to search for X-ray pulsations from the radio pulsar PSR J17133949, which lies near the center of G347.30.5 and may be associated with the SNR. We cannot confirm the presence of X-ray pulsations from this source, though our data is dominated by both cosmic ray background and X-ray emission from the SNR and the GR, making the detection of pulsed signal from the pulsar difficult.
5) Based on our two component (thermal and non-thermal) fits to the X-ray emission from the northwestern rim and the central diffuse emission from G347.30.5 and assuming a magnetic field strength of = 10 G, we estimate the maximum energy cutoff of accelerated cosmic ray electrons to be 19-25 TeV, consistent with previous analyses. Fitting the broadband (radio to -ray) energy spectrum of G347.30.5 with a synchrotron-inverse Compton scattering model yields values of 8.8 TeV for the maximum energy cutoff of the accelerated cosmic-ray electrons and a magnetic field of = 150 G. Our value for cutoff is sharply lower (but still consistent) with upper limits derived by previous studies, while our value for is significantly higher than previously assumed. However, the ratio of volumes of TeV emission to X-ray emission derived by this fit (TeV/X-ray 1000, with a lower limit of 360) is too large to be physically reasonable. While it appears that inverse Compton scattering cannot adequately fit the TeV emission from the northwestern rim of G347.30.5, the other two high energy processes associated with SNRs – neutral pion decay, as argued by Enomoto et al. (2002), and non-thermal bremsstrahlung – can also be ruled out as well. This situation may change with the application of more sophisticated models which take into account curvature of the energy spectrum of electrons.
6) We have considered the gross properties of G347.30.5 and two other SNRs known to feature X-ray spectra dominated by non-thermal emission, SN 1006 and G266.21.2. We find that all three of these SNRs are dynamically young, X-ray luminous but radio weak SNRs expanding into regions of low ambient density. This suggests that low ambient density may play a key role in dictating that the X-ray spectrum from a SNR is dominated by non-thermal emission, though a more detailed study of the X-ray spectrum of other SNRs is required in order to test this hypothesis.
References
- Aharonian et al. (2001) Aharonian, F. et al. 2001, A&A, 370, 112
- Aharonian (2002) Aharonian, F. 2002, Nature, 416, 797
- Allen et al. (1995) Allen, G. E. et al. 1995, ApJ, 448, L25
- Allen et al. (1997) Allen, G. E. et al. 1997, ApJ, 487, L97
- Allen, Petre & Gotthelf (2001) Allen, G. E., Petre, R. & Gotthelf, E. V. 2001, ApJ, 558, 739
- Alvarez-Muñiz & Halzen (2002) Alvarez-Muñiz, J. & Halzen, F. 2002, ApJ, 576, L33
- Anders & Ebihara (1982) Anders, E. & Ebihara, M. 1982, GeoChimica et Cosmochimica Acta, 46, 2363
- Axford (1981) Axford, W. I. 1981, Proceedings of the 17th International Cosmic Ray Conference, 12, 155
- Baring et al. (1999) Baring, M. G. et al. 1999, ApJ, 513, 311
- Bell (1978a) Bell, A. R. 1978a, MNRAS, 182, 147
- Bell (1978b) Bell, A. R. 1978b, MNRAS, 182, 443
- Blandford & Eichler (1987) Blandford, R. & Eichler, D. 1987, Physics Reports, 154, 1
- Bronfman et al. (1989) Bronfman, L., Alvarez, H., Cohen, R. S. & Thaddeus, P. 1989, ApJS, 71, 481
- Butt et al. (2001) Butt, Y. M. et al. 2001, ApJ, 562, L167
- Butt et al. (2002) Butt, Y. M. et al. 2002, Nature, 418, 499
- Bykov (2002) Bykov, A. M. 2002, A&A, 390, 327
- Combi, Romero & Benaglia (1999) Combi, J. A., Romero, G. E. & Benaglia, P. 1999, ApJ, 519, L177
- Crawford et al. (2002) Crawford, F., Pivovaroff, M. J., Kaspi, V. M. & Manchester, R. N. 2002, “Neutron Stars in Supernova Remnants,” ASP Conference Series, 271, 37, edited by P. O. Slane and B. M. Gaensler.
- Draine & Roberge (1984) Draine, B. T. & Roberge, W. G. 1984, ApJ, 282, 491
- Dyer et al. (2001) Dyer, K. K. et al. 2001, ApJ, 551, 439
- Ellison et al. (2000) Ellison, D. C., Berezhko, E. G. & Baring, M. G. 2000, ApJ, 540, 292
- Ellison et al. (2001) Ellison, D. C., Slane, P. & Gaensler, B. M. 2001, ApJ, 563, 191
- Enomoto et al. (2002) Enomoto, R., et al. 2002, Nature, 416, 823
- Green (2001) Green, D. A. 2001, ’A Catalogue of Galactic Supernova Remnants (2001 December Version)’, Mullard Radio Astronomy Observatory, Cavendish Laboratory, Cambridge, United Kingdom (available on the World-Wide-Web at ”http://www.mrao.cam.ac.uk/surveys/snrs”).
- Hartman et al. (1999) Hartman, R. C. et al. 1999, ApJS, 123, 79
- Hendrick & Reynolds (2001) Hendrick, S. P. & Reynolds, S. P. 2001, ApJ, 559, 903
- Holt et al. (1994) Holt, S. S., Gotthelf, E. V., Tsunemi, H. & Negoro, H. 1994, PASJ, 46, L151
- Houck & Denicola (2000) Houck, J. C. & Denicola, L. A. 2000, ASP Conf. Ser. 216: Astronomical Data Analysis Software and Systems IX, 9, 591.
- Hwang et al. (2002) Hwang, U., Decourchelle, A., Holt, S. S. & Petre, R. 2002, ApJ, 581, 1101
- Jones & Ellison (1991) Jones, F. C. & Ellison, D. C. 1991, SSRv, 58, 259
- Jun & Jones (1999) Jun, B.-I. & Jones, T. W. 1999, ApJ, 511, 774
- Keohane (1998) Keohane, J. W. 1998, Ph.D Thesis, University of Minnesota
- Koyama et al. (1995) Koyama, K. et al. 1995, Nature, 378, 255
- Koyama et al. (1997) Koyama, K. et al. 1997, PASJ, 49, L7
- Makishima et al. (1996) Makishima, K. et al. 1996, PASJ, 48, 171
- Malkov & Drury (2001) Malkov, M. A. & Drury, L. O’C. 2001, Rep. Prog. Phys., 64, 429
- Morrison & McCammon (1983) Morrison, R. & McCammon, D. 1983, ApJ, 270, 119
- Muraishi et al. (2000) Muraishi, H. et al. 2000, A&A, 354, L57
- Ohashi et al. (1996) Ohashi, T. et al. 1996, PASJ, 48, 157
- Pfeffermann & Aschenbach (1996) Pfeffermann, E. & Aschenbach, B. 1996, in Roentgenstrahlung from the Universe, International Conference on X-ray Astronomy and Astrophysics, ed. H. U. Zimmermann, J. E. Trümper & Yorke, H., MPE Report 263, p. 267
- Pfeffermann et al. (1987) Pfeffermann, E. et al. 1987, Proc. SPIE, 733, 519
- Raymond & Smith (1977) Raymond, J. C. & Smith, B. W. 1977, ApJS, 35, 419
- Reimer & Pohl (2002) Reimer, O. & Pohl, M. 2002, A&A, 390, L43
- Reynolds (1996) Reynolds, S. P. 1996, ApJ, 459, L13
- Reynolds (1998) Reynolds, S. P. 1998, ApJ, 493, 357
- Reynolds & Gilmore (1993) Reynolds, S. P. & Gilmore, D. M. 1993, AJ, 106, 272
- Reynolds & Keohane (1999) Reynolds, S. P. & Keohane, J. W. 1999, ApJ, 525, 368
- Roberts (1994) Robertson, J. G. 1994, PASA, 11, 44
- Seta et al. (1998) Seta, M. et al. 1998, ApJ, 505, 286
- Slane et al. (1999) Slane, P. et al. 1999, ApJ, 525, 357
- Slane et al. (2001) Slane, P. et al. 2001, ApJ, 548, 814
- Sturner et al. (1997) Sturner, S. J., Skibo, J. G., Dermer, C. D. & Mattox, J. R. 1997, ApJ, 490, 619
- Tanaka, Inoue & Holt (1994) Tanaka, Y., Inoue, H. & Holt, S. S. 1994, PASJ, 46, L37
- Tanaka (2002) Tanaka, Y. 2002, A&A, 382, 1052
- Uchiyama et al. (2002) Uchiyama, Y., Takahashi, T. & Aharonian, F. 2002, PASJ, 54, L73
- Uchiyama et al. (2003) Uchiyama, Y., Aharonian, F. A. & Takahashi, T. 2003, A&A, in press.
- Valinia & Marshall (1998) Valinia, A. & Marshall, F. E. 1998, ApJ, 505, 134
- Vink & Laming (2003) Vink, J. & Laming, J. M. 2003, ApJ, 584, 758
- Wang, Qu & Chen (1997) Wang, Z.-R., Qu, Q.-Y. & Chen, Y. 1997, A&A, 318, L59
- Willingale et al. (1996) Willingale, R. et al. 1996, MNRAS, 278, 749
- Winkler, Gupta & Long (2002) Winkler, P. F., Gupta, G. & Long, K. S. 2002, ApJ, in press.


| Observed | Exposure | |||||
|---|---|---|---|---|---|---|
| Satellite and | Observation | Portion of | R.A. | Decl. | Time | |
| Instrument | Obs ID | Date | G347.30.5 | (J2000.0) | (J2000.0) | (Seconds) |
| ROSAT PSPC | RP500198N00 | 1992 September 23 | All | 17 13 33.6 | 39 48 36 | 2758 |
| ASCA GIS | 55057000 | 1997 March 23 | NW Rim | 17 12 17.8 | 39 35 31 | 5428 |
| ASCA GIS | 55058000 | 1997 March 24 | SW Rim | 17 12 53.8 | 39 54 23 | 5776 |
| ASCA GIS | 55059000 | 1997 March 25 | NE Rim | 17 14 28.3 | 39 35 26 | 3924 |
| RXTE PCA | 40145-01 | 1999 June 15 | All | 17 14 13 | 39 50 30 | 38371 |
| RXTE PCA | 40145-02 | 1999 June 14 | Background #1 | 17 22 26 | 37 18 10 | 8064 |
| RXTE PCA | 40145-03 | 1999 June 14 | Background #2 | 17 05 24 | 42 20 32 | 3229 |
| 90% Confidence | ||||
|---|---|---|---|---|
| Region | Model | Parameter (Units) | Value | Limits |
| NW | H (1022 cm-2) | 0.74 | 0.71, 0.77 | |
| 0.55 | 0.51, 0.59 | |||
| cutoff (1017 Hz) | 1.45 | 1.38, 1.59 | ||
| Normalization (Jy) | 4.02 | 3.89, 4.09 | ||
| bbAbundance frozen at 1.0 and redshift frozen at 0.0. | (keV) | 1.15 | ||
| Emission Measure ccSee Section 3. | 4.54 10-3 | |||
| (cm-3) | ||||
| NE | H (1022 cm-2) | 0.61 | 0.45, 0.76 | |
| 0.37 | 0.34, 0.52 | |||
| cutoff (1017 Hz) | 2.67 | 2.40, 2.96 | ||
| Normalization (Jy) | 4.07 10-2 | 1.38 10-2, | ||
| 0.11 | ||||
| bbAbundance frozen at 1.0 and redshift frozen at 0.0. | (keV) | 1.15 | 0.99, 1.71 | |
| Emission Measure ccSee Section 3. | 6.11 10-3 | 3.05 10-3, | ||
| (cm-3) | 9.69 10-3 | |||
| SW | H (1022 cm-2) | 0.63 | 0.60, 0.65 | |
| 0.50 | 0.48, 0.53 | |||
| cutoff (1017 Hz) | 2.43 | 2.27, 2.60 | ||
| Normalization (Jy) | 0.72 | 0.43, 0.92 | ||
| bbAbundance frozen at 1.0 and redshift frozen at 0.0. | (keV) | 3.31 | 2.82, 4.00 | |
| Emission Measure ccSee Section 3. | 3.66 10-3 | 2.63 10-3, | ||
| (cm-3) | 4.78 10-3 | |||
| C | H (1022 cm-2) | 0.49 | 0.47, 0.51 | |
| 0.48 | 0.47, 0.51 | |||
| cutoff (1017 Hz) | 2.41 | 2.29, 2.52 | ||
| Normalization (Jy) | 1.28 | 0.98, 1.30 | ||
| bbAbundance frozen at 1.0 and redshift frozen at 0.0. | (keV) | 1.56 | 1.50, 1.61 | |
| Emission Measure ccSee Section 3. | 3.85 10-2 | 3.65 10-2, | ||
| (cm-3) | 4.15 10-2 | |||
| BackgroundddGalactic diffuse background as observed by the PCA over the energy range of 2 through 30 keV. H, photon index and have all been frozen to the values measured by Valinia & Marshall (1998). | H (1022 cm-2) | 1.8ddGalactic diffuse background as observed by the PCA over the energy range of 2 through 30 keV. H, photon index and have all been frozen to the values measured by Valinia & Marshall (1998). | ||
| Photon Index | 1.8ddGalactic diffuse background as observed by the PCA over the energy range of 2 through 30 keV. H, photon index and have all been frozen to the values measured by Valinia & Marshall (1998). | |||
| Normalization | 2.72 10-3 | 2.57 10-3, | ||
| (Photons keV-1 cm-2 | 2.84 10-3 | |||
| sec-1 at 1 keV) | ||||
| bbAbundance frozen at 1.0 and redshift frozen at 0.0. | (keV) | 2.9ddGalactic diffuse background as observed by the PCA over the energy range of 2 through 30 keV. H, photon index and have all been frozen to the values measured by Valinia & Marshall (1998). | ||
| Emission Measure ccSee Section 3. | 3.46 10-2 | 3.38 10-2, | ||
| (cm-3) | 3.55 10-2 |
| 90% Confidence | ||||
|---|---|---|---|---|
| Region | Model | Parameter (Units) | Value | Limits |
| NW | H (1022 cm-2) | 0.74 | 0.70, 0.79 | |
| 0.55 | 0.49, 0.57 | |||
| cutoff (1017 Hz) | 1.47 | 1.31, 1.48 | ||
| Normalization (Jy) | 4.48 | 2.70, 4.55 | ||
| bbAbundance frozen at 1.0 and redshift frozen at 0.0. | (keV) | 0.49 | ||
| Emission Measure ccSee Section 3. | 4.64 10-3 | |||
| (cm-3) | ||||
| NE | H (1022 cm-2) | 0.66 | 0.56, 0.75 | |
| 0.44 | 0.37, 0.50 | |||
| cutoff (1017 Hz) | 2.93 | 2.59, 3.48 | ||
| Normalization (Jy) | 0.14 | 0.03, 0.51 | ||
| bbAbundance frozen at 1.0 and redshift frozen at 0.0. | (keV) | 1.34 | 1.08, 1.71 | |
| Emission Measure ccSee Section 3. | 9.31 10-3 | 6.56 10-3, | ||
| (cm-3) | 1.31 10-2 | |||
| SW | H (1022 cm-2) | 0.61 | 0.58, 0.69 | |
| 0.52 | 0.49, 0.55 | |||
| cutoff (1017 Hz) | 2.47 | 2.31, 2.59 | ||
| Normalization (Jy) | 1.10 | 0.58, 1.74 | ||
| bbAbundance frozen at 1.0 and redshift frozen at 0.0. | (keV) | 1.31 | ||
| Emission Measure ccSee Section 3. | 2.52 10-3 | |||
| (cm-3) | ||||
| C | H (1022 cm-2) | 0.49 | 0.48, 0.51 | |
| 0.50 | 0.49, 0.52 | |||
| cutoff (1017 Hz) | 2.44 | 2.34, 2.53 | ||
| Normalization (Jy) | 1.94 | 1.42, 2.61 | ||
| bbAbundance frozen at 1.0 and redshift frozen at 0.0. | (keV) | 1.69 | 1.62, 1.74 | |
| Emission Measure ccSee Section 3. | 3.61 10-2 | 3.45 10-2, | ||
| (cm-3) | 3.82 10-2 | |||
| BackgroundddGalactic diffuse background as observed by the PCA over the energy range of 2 through 30 keV. H, photon index and have all been frozen to the values measured by Valinia & Marshall (1998). | H (1022 cm-2) | 1.8ddGalactic diffuse background as observed by the PCA over the energy range of 2 through 30 keV. H, photon index and have all been frozen to the values measured by Valinia & Marshall (1998). | ||
| Photon Index | 1.8ddGalactic diffuse background as observed by the PCA over the energy range of 2 through 30 keV. H, photon index and have all been frozen to the values measured by Valinia & Marshall (1998). | |||
| Normalization | 3.07 10-3 | 2.91 10-3, | ||
| (Photons keV-1 cm-2 | 3.18 10-3 | |||
| sec-1 at 1 keV) | ||||
| bbAbundance frozen at 1.0 and redshift frozen at 0.0. | (keV) | 2.9ddGalactic diffuse background as observed by the PCA over the energy range of 2 through 30 keV. H, photon index and have all been frozen to the values measured by Valinia & Marshall (1998). | ||
| Emission Measure ccSee Section 3. | 3.11 10-2 | 3.04 10-2, | ||
| (cm-3) | 3.21 10-2 |
| Parameter | NW | C | NW | C |
|---|---|---|---|---|
| cutoff (TeV)aaAssuming a magnetic field of 10G. | 19.6 | 25.3 | 19.7 | 25.4 |
| bb = 2 + 1. | 2.10 | 1.96 | 2.10 | 2.00 |
| H (cm-3) | 1.86 10-2 | 0.054 | 1.89 10-2 | 0.052 |
| e (cm-3) | 2.23 10-2 | 0.065 | 2.26 10-2 | 0.062 |
| Line | 90% Confidence | 90% Confidence | ||
|---|---|---|---|---|
| Pointing | Energy (keV) | Limits | NormalizationaaIn units of 10-4 photons cm-2 sec-1. | LimitsaaIn units of 10-4 photons cm-2 sec-1. |
| G347.30.5 | 6.41 | 6.38, 6.42 | 5.05 | 4.70, 5.40 |
| Background #1 | 6.51 | 6.47, 6.56 | 4.80 | 4.11, 5.59 |
| Background #2 | 6.26 | 6.13, 6.37 | 7.24 | 5.48, 9.91 |
| Joint FitbbSimultaneous fitting to the PCA spectra of G347.30.5 and both of the background pointings. | 6.43 | 6.40, 6.45 | 5.06 | 4.76, 5.38 |
| Cas AccSee Section 4.3. | 6.66 | 6.64, 6.67 | 58.4 | 57.8, 59.2 |
| Property | SN 1006 | Reference | G266.21.2 | Reference | G347.30.5 | Reference |
|---|---|---|---|---|---|---|
| Distance (kpc) | 2.2 | (1) | 1-2 | (2) | 6 | (3), (4) |
| Ambient Density (cm-3) | 0.1 | (5) | 0.05aaCalculated from expressions provided by Slane et al. (2001) and assuming a mean distance of 1.5 kpc, a volume filling factor for a sphere of one-quarter and an explosion kinetic energy of 1051 ergs. | (2) | 0.05-0.07 | (6) |
| Angular Size (arcmin) | 30 | (7) | 120 | (7) | 65 55 | (7) |
| Dynamical Age (yr) | 996 | (1) | 14000aaCalculated from expressions provided by Slane et al. (2001) and assuming a mean distance of 1.5 kpc, a volume filling factor for a sphere of one-quarter and an explosion kinetic energy of 1051 ergs. | (2) | 8000 | (4) |
| Flux Density (Jy) | 19 | (7) | 50(?) | (7) | 4 | (4) |
| 0.6 | (7) | 0.3(?) | (7) | 0.55 | (6) | |
| (G) | 40 | (5) | – | 150 | (6) | |
| -field Direction | Radial | (8) | Tangential | (9) | – | |
| Progenitor Type | Ia | (1) | II | (2) | II | (3), (4) |