Transition Region Emission From Very Low Mass Stars
Abstract
We present results from our cycle 10 HST program to search for transition region emission in very low-mass, main-sequence stars in the spectral range M7-M9. Our program is aimed at 1) detecting emission; and 2) distinguishing between flaring and quiescent origin for the emission. We have obtained HST/STIS time series observations of three active, very low mass stars (VB 8, VB 10, and LHS 2065) which show persistent activity in transition region lines including Si IV, C IV, and He II. Emission in transition region lines appears to be variable between exposures, but is always observed. A strong flare was also observed in one 10 minute exposure on VB 10. Our results indicate that active, very low-mass stars maintain a persistent quiescent chromosphere and transition region that is similar to those observed in active, earlier type M dwarfs, in contrast to suggestions that these low-mass, main-sequence stars exhibit only relatively strong flares and no quiescent emission.
1 Introduction
Surface magnetic fields on low mass stars give rise to a variety of interesting astrophysical phenomena, including a persistent hot outer atmosphere (which may be contained within magnetic loop structures) and transient events such as starspots and flares. Non-radiative heating processes transfer energy from the magnetic field into the outer stellar atmosphere to power these phenomena, but a physical description of the heating processes remains elusive even on the Sun. Observationally, the heating produces chromospheric (TK), transition region (TK) and coronal (TK) emission, primarily in emission lines of the hydrogen Lyman and Balmer series, and in ionized species of abundant elements such as helium, carbon, oxygen, calcium, magnesium, and iron.
Recently, there has been renewed interest in the atmospheric properties of the lowest mass stars and brown dwarfs. Chromospheric observations of H emission (Hawley et al., 1996; Gizis et al., 2000; Burgasser et al., 2002) indicate that both the frequency of active stars at a given spectral type, and the activity level (measured by L) decrease at spectral types later than approximately M7. Recent investigations of magnetic activity in these very late type dwarfs have led to a new, yet already widely accepted, paradigm: that hot gas in the atmospheres of very low mass main sequence stars and brown dwarfs is present only during flares (Fleming et al., 2000; Rutledge et al., 2000; Mohanty et al., 2002). Here, hot gas refers to gas at transition region and coronal temperatures. The M9 brown dwarf, LP944-20, observed with Chandra by Rutledge et al. (2000) does show persistent chromospheric (H) emission during quiescence (i.e. outside of flares), as do many of its counterparts.
This new paradigm is based on the following evidence. Linsky et al. (1995) observed the M8 dwarf VB 10 with HST/GHRS and found no quiescent transition region emission, but did observe C IV emission during a flare. Fleming et al. (2000) re-analyzed ROSAT data on VB10 and found that the observed X-ray emission came only from a flare event, and no X-rays were detected during six hours of quiescent observation. The X-ray flare luminosity was substantially larger than expected based on the upper limit of the quiescent X-ray luminosity, when compared to flares on earlier type (M0 - M6) stars. An H flare on an M9.5 2MASS dwarf showed a similarly substantial flare luminosity compared to quiescence (Liebert et al., 1999). Finally, the afore-mentioned Chandra investigation of the M9 brown dwarf LP944-20 detected no X-rays in a quiescent observation of nine hour duration (Rutledge et al., 2000). By contrast, Berger et al. (2001) found both persistent and flaring radio emission from LP944-20, while Berger (2002) recently reported radio observations of both flaring and quiescent emission for 3 additional low mass dwarfs of spectral types M8.5, M9.5 and L3.5. These authors speculate that perhaps the radio emission mechanism differs in the low mass dwarfs compared to earlier type active stars. On the theoretical side, both Fleming et al. (2000) and Mohanty et al. (2002) have proposed mechanisms related to the low ionization state of very cool atmospheres which would prevent the occurrence of magnetic activity in very cool (hence late spectral type) dwarfs, in order to explain the various observations described above.
Recent X-ray studies have probed into the brown dwarf regime in young clusters (Comerón, Neuhäuser, & Kaas, 2000; Feigelson et al., 2002) and find both quiescent and flaring emission. However, the extreme youth of these objects means that most have early-mid M spectral types. Further, fossil magnetic fields may play a significant role in their activity (Feigelson et al., 2002), making them unsuitable as a testbed for theories of the evolution of dynamo-generated magnetic fields in older, main sequence dwarfs.
Extensive observations of earlier M dwarfs (type M0-M6) have led to scaling relations between the persistent H (chromospheric) and soft X-ray (thermal coronal) emission outside of flares (Hawley et al., 1996). We have used H observations (Hawley et al., 1996) and C IV (transition region) measurements (Johns–Krull et al., 2000) for the dMe stars AD Leo (M3), EV Lac (M3.5), and YZ CMi (M4) to derive empirical C IV to H line flux ratios of 0.06, 0.07, and 0.13 respectively. There may be a tendency for this ratio to increase toward later spectral types. A conservative estimate suggests that the ratio is typically 0.1. In terms of the observed fluxes, the relations between chromospheric, transition region, and coronal diagnostics for active early-mid M dwarfs are therefore:
If these relations are applied to the observed H fluxes for VB 10 and LP944-20, the upper limits for the reported non-detections in C IV and X-rays are near or even above the predicted values. For example, Linsky et al. (1995) found an upper limit for VB 10 of ergs cm-2 s-1 while the scaling relation gives a predicted C IV line flux of ergs cm-2 s-1 based on the observed H line flux from Hawley et al. (1996). Recently, Martín & Bouy (2002) reobserved LP944-20 with XMM-Newton, again failing to detect quiescent emission; however, this observation is only a factor of 3 more sensitive than the previous Chandra result of Rutledge et al. (2000). Thus, only slight deviations from the above relations would explain the current non-detections, without requiring a major paradigm shift with regard to magnetic activity on late M dwarfs compared to earlier M dwarfs.
The case for the absence of a quiescent transition region and corona in the lowest mass stars and brown dwarfs thus rests on tenuous observational evidence. The goal of this investigation is to place stringent limits on the presence of transition region emission using the sensitive HST/STIS spectrograph with the FUV-MAMA detector. These observations provide the first rigorous test of the presence of persistent quiescent emission on very late type main sequence dwarfs at temperatures well above chromospheric levels, and by inference the ubiquitous existence of a hot outer atmosphere.
2 Observations
Our target list comprises the brightest active stars known at spectral types M7 (VB 8), M8 (VB 10) and M9 (LHS 2065). These targets were chosen to give us the best possible detection limits for persistent quiescent emission. The total exposure time on each object corresponds to a C IV detection limit ten times fainter than the expected C IV line strength scaled from earlier type active M dwarfs (equation 1).
The Hubble Space Telescope was used with the STIS spectrograph and the FUV-MAMA detector to obtain 15 consecutive exposures of each target. All observations were made using the 52′′ long by 0.2′′ wide slit and the G140L grating to give a spectral resolution at 1500Å. For VB 8, spectral observations started at 12:38 UT on 2001 October 6. Each G140L spectrum was integrated for approximately 5 minutes, and the total exposure sequence spanned two orbits. For LHS 2065, spectral observations started at 5:23 UT on 2002 April 27. Each G140L spectrum was integrated for approximately 10 minutes, and the total exposure sequence spanned four orbits. The observing sequence for VB 10 was identical to that of LHS 2065 with G140L spectral observations starting at 5:03 UT on 2002 September 7. Table 1 gives a detailed log of the STIS observations.
The data were downloaded from the HST archive, and data reduction was performed with the CALSTIS package (Lindler, 1999) utilizing the STIS pipeline. However, due to the relative faintness of our targets, the pipeline package was unable to properly locate the spectrum of the star on the detector and extract it. Therefore, we performed the spectral extraction from the flatfielded science image manually. To accomplish this, we coadded all 15 exposures for each star and examined the resulting image by eye, where it was easy to identify bright emission lines such as C IV and Si IV. We then used the order trace from the STIS pipeline, applying an offset such that the trace went through the emission lines from our object. Examining each of the 15 exposures individually, we verified that the order location did not change substantially (more than a pixel) during any one exposure. We then extracted the spectrum and background around this offset order location using the same extraction width (11 pixels) used by the pipeline to determine a count rate spectrum. The count rate spectrum was converted to a flux spectrum via the transformation provided in the CALSTIS pipeline reduction. We verified our procedure by extracting spectra around the nominal order locations provided by the CALSTIS pipeline for the 15 exposures of each source, recovering the same (noise) spectrum produced by the STIS pipeline to within the (somewhat large) photon statistics.
3 Results
The spectra extracted for each target from the sum of all 15 exposures are shown in Figure 1. The emission lines we have identified are typical of those found in active late-type stars (Ayres et al., 2001), and are very similar in relative strength to earlier type M dwarf transition region spectra, as shown by comparison to the recent STIS/FUV-MAMA spectrum of the dM1e star AU Mic (Pagano et al., 2000). The C IV doublet at 1550Å is the strongest feature typically observed from low mass stars in the wavelength range of study here and is also the strongest line observed in these 3 stars. For presentation purposes, we have applied Gaussian smoothing to the spectra with a FWHM of 3Å. This smoothing is not used in the flux measurements given in Table 1. The 1- uncertainty limits are also indicated for the smoothed spectra in Figure 1.
Table 1 gives the observed C IV doublet line flux for each exposure in all three stars. The fluxes were determined by integrating the line over 6.4Å centered on the doublet; the integration limits were set by visual examination of the individual spectra. The significance of these detections can be estimated from the off-source background in the images, as discussed by Kraft et al. (1991); see also Babu & Feigelson (1996). The image of each STIS spectrum shows a clear variation in the background along the dispersion direction, likely due to scattered light from the strong Ly- airglow present. The background shows no variation in the spatial axis at the position of the C IV line. To estimate the significance of the C IV detection in each exposure, we step above and below the position of the C IV line on the spectral image and extract the number of background counts in a box the same size as that used to extract the actual C IV line. This produces approximately 100 estimates of the background, to which we fit a Poisson distribution. We then compare the net number of counts detected in the C IV line to this distribution in order to determine the significance of the detection. In all but one exposure on LHS 2065, the C IV line is detected above the 3 level. For VB 8, the weakest detection is at the 3.1 level, the strongest at the 15.0 level, with a mean significance of 7.7. For VB 10, these three values are 3.3, 314, and 39.1 respectively. For LHS 2065, the corresponding detections are 2.9, 17.6, and 10.1. The continuum adjacent to the C IV line is not detected in the same sized integration box at a significant level in any exposure.
Although these estimates show that the C IV line is detected in all exposures, they do not represent the uncertainties in the measured flux. Using the Bayesian method described by Kraft et al. (1991), we have estimated the 68.3% confidence limits111The 68.3% confidence limits correspond to for a Gaussian distribution. We have not assumed a Gaussian distribution here, but these confidence limits represent a typical benchmark.. The flux confidence limits for each spectrum are reported in Table 1.
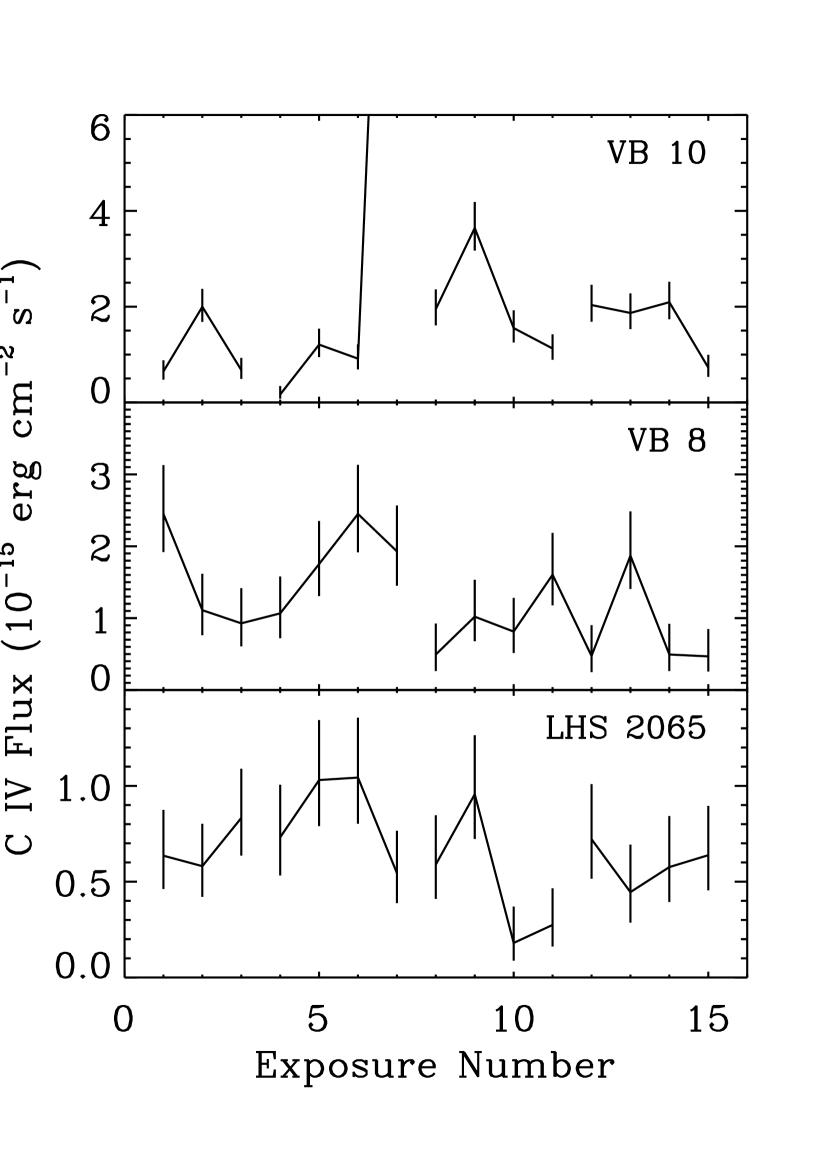
Time sequences of the C IV measurements, together with the uncertainties, for each target are shown in Figure 2. There is no definite sign of long-lived flaring (C IV rise and decay) in the time sequences observed. The second orbit on VB 10 shows a strong flare at the end of the orbit (exposure 7), so the duration of the event cannot be measured. The C IV flux does appear to be variable between exposures on all three stars. Quiescent emission does not typically occur at a constant flux level on active M dwarfs; similar variability is commonly seen in the quiescent H emission fluxes (Gizis, Reid, & Hawley, 2002). This may be a sign of small scale flaring as a cause of the quiescent emission. Our C IV data suggest a common origin for the chromospheric and transition region emission, in conflict with the hypothesis that quiescent chromospheric emission is present but that transition region emission is absent except during strong flares.
The C IV line strengths we measure are: ergs s-1 cm-2 for VB 8; ergs s-1 cm-2 for VB 10; and ergs s-1 cm-2 for LHS 2065. The values in parentheses for VB 10 represent the quiescent flux and uncertainty measured from the total of all spectra excluding the strong flare observed in exposure 7 (see Figure 2). Note that when integrated over the entire observation for each target, the C IV line is detected with sufficient counts that uncertainties can be estimated assuming a Gaussian distribution for the source and the background (Babu & Feigelson, 1996).
The scaling relation based on the H emission in these stars, which assumes that the C IV to H ratio is the same as for earlier type M dwarfs (equation 1), predicted values of 2 (VB 8), 9 (VB 10), and 1 (LHS 2065) ergs s-1 cm-2. These are close to the observed values, with VB 8 and LHS 2065 having slightly lower observed fluxes, while the observed VB 10 (quiescent) flux is somewhat higher than predicted. The VB 10 (quiescent) flux is also a factor of two higher than the upper limit quoted in Linsky et al. (1995).
4 Summary
Our conclusion is that active, very low-mass, main-sequence stars (spectral types M7-M9) can maintain a quiescent chromosphere and transition region that is similar to those observed in active, earlier type M dwarfs. Flaring may still be ultimately responsible for the outer atmospheric heating in these stars, even during “quiescence”; the role of flares (particularly micro-flares) in coronal and transition region heating is still not understood for the Sun or for active stars (Kashyap et al., 2002; Güdel et al., 2003, for example). However, theories involving changes in atmospheric structure, dynamo heating and other mechanisms proposed to explain the lack of quiescent activity in very low mass stars and brown dwarfs (Fleming et al., 2000; Mohanty et al., 2002) must accommodate the persistent quiescent activity that we have observed at least through spectral type M9.
This research was made possible by grant HST-GO-9090 from the Space Telescope Science Institute, operated by AURA for NASA.
References
- Ayres et al. (2001) Ayres, T. R., Brown, A., Osten, R. A., Huenemoerder, D. P., Drake, J. J., Brickhouse, N. S., & Linsky, J. L. 2001, ApJ, 549, 554
- Babu & Feigelson (1996) Babu, G.J. & Feigelson, E.D. 1996, Astrostatistics, (Cambridge: Cambridge University Press)
- Berger et al. (2001) Berger, E. et al. 2001, Nature, 410, 338
- Berger (2002) Berger, E. 2002, ApJ, 572, 503
- Burgasser et al. (2002) Burgasser, A. J., Liebert, J., Kirkpatrick, J. D., & Gizis, J. E. 2002, AJ, 123, 2744
- Comerón, Neuhäuser, & Kaas (2000) Comerón, F., Neuhäuser, R., & Kaas, A. A. 2000, A&A, 359, 269
- Feigelson et al. (2002) Feigelson, E. D., Broos, P., Gaffney, J. A., Garmire, G., Hillenbrand, L. A., Pravdo, S. H., Townsley, L., & Tsuboi, Y. 2002, ApJ, 574, 258
- Fleming et al. (2000) Fleming, T.A., Giampapa, M.S., & Schmitt, J.H.M.M. 2000, ApJ, 533, 372
- Gizis, Reid, & Hawley (2002) Gizis, J. E., Reid, I. N., & Hawley, S. L. 2002, AJ, 123, 3356
- Gizis et al. (2000) Gizis, J. E., Monet, D. G., Reid, I. N., Kirkpatrick, J. D., Liebert, J., & Williams, R. J. 2000, AJ, 120, 1085
- Güdel et al. (2003) Güdel, M., Audard, M., Kashyap, V. L., Drake, J. J., & Guinan, E. F. 2003, ApJ, 582, 423
- Hawley et al. (1996) Hawley, S.L., Gizis, J.E., & Reid, I.N. 1996, AJ, 112, 2799
- Johns–Krull et al. (2000) Johns–Krull, C.M., Valenti, J.A., & Linsky, J.L. 2000, ApJ, 539, 815
- Kashyap et al. (2002) Kashyap, V. L., Drake, J. J., Güdel, M., & Audard, M. 2002, ApJ, 580, 1118
- Kraft et al. (1991) Kraft, R.P., Burrows, D.N., & Nousek, J.A. 1991, ApJ, 374, 344
- Liebert et al. (1999) Liebert, J., Kirkpatrick, J.D., Reid, I.N., Fisher, M.D. 1999, ApJ, 519, 345
- Lindler (1999) Lindler, D. 1999, CALSTIS Reference Guide (Greenbelt: NASA/LASP)
- Linsky et al. (1995) Linsky, J.L., Wood, B.E., Brown, A., Giampapa, M.S., & Ambruster, C. 1995, ApJ, 455, 670
- Martín & Bouy (2002) Martín, E. L. & Bouy, H. 2002, New Astronomy, 7, 595
- Mohanty et al. (2002) Mohanty, S., Basri, G., Shu, F., Allard, F., & Chabrier, G. 2002, ApJ, 571, 469
- Pagano et al. (2000) Pagano, I., Linsky, J. L., Carkner, L., Robinson, R. D., Woodgate, B., & Timothy, G. 2000, ApJ, 532, 497
- Reid et al. (1995) Reid, I.N., Hawley, S.L., & Gizis, J.E. 1995, AJ, 110, 1838
- Rutledge et al. (2000) Rutledge, R.E., Basri, G., Martín, E.L., Bildsten, L. 2000, ApJ, 538, L141

| VB 8 | VB 10 | LHS 2065 | |||||||||
|---|---|---|---|---|---|---|---|---|---|---|---|
| 6 Oct. 2001 | 7 Sep. 2002 | 27 Apr. 2002 | |||||||||
| Exposure | Start | Exp. | Start | Exp. | Start | Exp. | |||||
| # | (UT) | (sec) | (erg cm-2 s-1) | (UT) | (sec) | (erg cm-2 s-1) | (UT) | (sec) | (erg cm-2 s-1) | ||
| 1 | 12:38:04 | 300 | 1.92-3.13 | 05:03:19 | 720 | 0.48-0.88 | 05:23:22 | 679 | 0.46-0.87 | ||
| 2 | 12:45:21 | 300 | 0.76-1.62 | 05:17:36 | 720 | 1.68-2.37 | 05:36:58 | 720 | 0.42-0.80 | ||
| 3 | 12:50:43 | 300 | 0.61-1.42 | 05:29:58 | 720 | 0.49-0.93 | 05:49:20 | 720 | 0.64-1.09 | ||
| 4 | 12:56:05 | 300 | 0.72-1.58 | 06:28:18 | 600 | 0.08-0.34 | 06:48:47 | 600 | 0.53-1.01 | ||
| 5 | 13:01:27 | 300 | 1.31-2.35 | 06:42:25 | 600 | 0.95-1.54 | 07:02:54 | 600 | 0.79-1.34 | ||
| 6 | 13:06:49 | 300 | 1.92-3.13 | 06:52:47 | 600 | 0.69-1.21 | 07:13:16 | 600 | 0.80-1.36 | ||
| 7 | 13:12:11 | 291 | 1.45-2.57 | 07:03:09 | 720 | 18.4-20.5 | 07:23:38 | 720 | 0.39-0.77 | ||
| 8 | 14:04:10 | 300 | 0.26-0.92 | 08:04:27 | 600 | 1.61-2.36 | 08:24:58 | 600 | 0.41-0.85 | ||
| 9 | 14:13:17 | 300 | 0.68-1.53 | 08:18:34 | 600 | 3.17-4.18 | 08:39:05 | 600 | 0.72-1.26 | ||
| 10 | 14:18:39 | 300 | 0.52-1.28 | 08:28:56 | 600 | 1.25-1.93 | 08:49:27 | 600 | 0.09-0.37 | ||
| 11 | 14:24:01 | 300 | 1.18-2.18 | 08:39:18 | 720 | 0.89-1.42 | 08:59:49 | 720 | 0.16-0.47 | ||
| 12 | 14:29:23 | 300 | 0.25-0.90 | 09:40:37 | 600 | 1.69-2.46 | 10:01:09 | 600 | 0.52-1.01 | ||
| 13 | 14:34:45 | 300 | 1.41-2.48 | 09:54:44 | 600 | 1.53-2.28 | 10:15:16 | 600 | 0.29-0.69 | ||
| 14 | 14:40:07 | 300 | 0.26-0.92 | 10:05:06 | 600 | 1.74-2.52 | 10:25:38 | 600 | 0.39-0.84 | ||
| 15 | 14:45:29 | 360 | 0.26-0.85 | 10:15:28 | 676 | 0.53-1.00 | 10:36:00 | 676 | 0.46-0.90 | ||
Note. — Values for the C IV flux give the 68.3% confidence limits for the measured flux.