Local Three-Dimensional Simulations of Magneto-Rotational Instability in Radiation-Dominated Accretion Disks
Abstract
We examine the small-scale dynamics of black hole accretion disks in which radiation pressure exceeds gas pressure. Local patches of disk are modeled by numerically integrating the equations of radiation MHD in the flux-limited diffusion approximation. The shearing-box approximation is used, and the vertical component of gravity is neglected. Magneto-rotational instability (MRI) leads to turbulence in which accretion stresses are due primarily to magnetic torques. When radiation is locked to gas over the length and time scales of fluctuations in the turbulence, the accretion stress, density contrast, and dissipation differ little from those in the corresponding calculations with radiation replaced by extra gas pressure. However, when radiation diffuses each orbit a distance that is comparable to the RMS vertical wavelength of the MRI, radiation pressure is less effective in resisting squeezing. Large density fluctuations occur, and radiation damping of compressive motions converts work into photon energy. The accretion stress in calculations having a net vertical magnetic field is found to be independent of opacity over the range explored, and approximately proportional to the square of the net field. In calculations with zero net magnetic flux, the accretion stress depends on the portion of the total pressure that is effective in resisting compression. The stress is lower when radiation diffuses rapidly with respect to the gas. We show that radiation-supported Shakura-Sunyaev disks accreting via internal magnetic stresses are likely in their interiors to have radiation marginally coupled to turbulent gas motions.
1 INTRODUCTION
Owing to the difficulty of removing angular momentum from infalling gas, material accreting on a black hole likely first accumulates in a disk supported against radial gravity by its rotation. The evolution of the disk is governed by the extraction of its angular momentum, and the fate of the released gravitational energy. A possible structure for the flow was found by Shakura & Sunyaev (1973). They assumed angular momentum was transferred outwards within the disk by an effective viscosity of unknown origin, proportional to the vertically-averaged pressure at each radius. The released energy was converted to heat by the same viscosity, and the disk was cooled by vertical diffusion of photons to the surfaces. The disk was supposed to be time-steady, axisymmetric, and in vertical hydrostatic balance.
In the inner regions of Shakura-Sunyaev models with luminosities near the Eddington limit, radiation pressure is much larger than gas pressure, and provides the main means of support in the vertical direction. If the stress which transports angular momentum is proportional to total pressure, the radiation-dominated regions are viscously (Lightman & Eardley, 1974), thermally (Shakura & Sunyaev, 1976), and convectively (Bisnovatyi-Kogan & Blinnikov, 1977) unstable. These instabilities might prevent the formation of a steady disk. However, if the effective viscosity results from magnetic activity, buoyancy of the field may limit the stress to a value proportional to gas pressure alone, resulting in a thermally and viscously stable configuration (Sakimoto & Coroniti, 1989). The structure of the inner parts of accretion flows onto black holes remains unknown.
A physical mechanism for transfer of angular momentum through disk gas is magneto-rotational instability (MRI) (Balbus & Hawley, 1991). In this paper we examine the effects of MRI in radiation-dominated accretion disks. The MRI is a local linear instability, driven by exchange of angular momentum along magnetic field lines linking material at different distances from the black hole. Its fastest mode is axisymmetric and grows at three-quarters the orbital angular frequency . The wavelength of fastest growth is fixed by a balance between Coriolis and magnetic tension forces, and is approximately the distance that Alfvén waves travel in an orbital period (Balbus & Hawley, 1998).
In local three-dimensional MHD simulations without radiation, MRI leads to turbulence in which magnetic and hydrodynamic stresses transport angular momentum outwards (Hawley, Gammie, & Balbus, 1995). The magnitudes of the stresses depend on the geometry of the magnetic field. If the field has a net vertical flux, stresses are large and depend on the net flux. If the field instead has a net azimuthal flux, the stresses are weaker for the same pressure in the net component. If the field has zero net flux, stresses are weaker still, and after a few tens of orbits, are independent of initial field strength (Hawley, Gammie, & Balbus, 1996). Which of these magnetic configurations is most appropriate for disks around black holes may depend on non-local effects of outflow or buoyancy, which could lead to a build-up of net magnetic flux in accreting material.
The effects of MRI in radiation-dominated disks are uncertain. The range of linearly-unstable wavelengths is unaffected by photon diffusion. However, when azimuthal magnetic pressure exceeds gas pressure, and photons diffuse more than a vertical MRI wavelength per orbit, the growth rate of the axisymmetric MRI is reduced by a factor roughly , where and are the vertical and azimuthal Alfvén speeds, and the gas acoustic speed (Blaes & Socrates, 2001). Linear growth may be slow when magnetic pressure is greater than gas pressure, but much less than total pressure.
The MRI converts gravitational energy into magnetic and kinetic energy. Dissipation of the magnetic fields may heat the gas. Part of the kinetic energy may be converted directly to photon energy, by radiative damping of compressive disturbances having wavelengths shorter than the distance photons diffuse per wave period (Agol & Krolik, 1998). In local axisymmetric MHD simulations, the MRI drives turbulence with density contrasts as great as the ratio of magnetic to gas pressure. Escape of radiation from the compressed regions damps the motions [Turner, Stone, & Sano (2002), hereafter TSS]. These results suggest that magnetized turbulence may be important for heating as well as angular momentum transfer in radiation-dominated accretion disks.
Here we extend the radiation MHD calculations of TSS to three dimensions, neglecting stratification. In three-dimensional calculations, the turbulence may reach a time-averaged steady state lasting many orbital periods. We examine the effects of radiation diffusion on the regeneration of magnetic field, the accretion stresses, and the damping of the turbulence.
2 DOMAIN, EQUATIONS SOLVED, AND NUMERICAL METHODS
We use the local shearing box approximation (Hawley, Gammie, & Balbus, 1995). The domain is a small patch of the disk, centered at the midplane a distance from the axis of rotation. Curvature along the direction of orbital motion is neglected, and the patch is represented in Cartesian coordinates co-rotating at the Keplerian orbital frequency for domain center. Coriolis and tidal forces in the rotating frame are included, while the component of gravity perpendicular to the midplane is neglected. The local coordinates correspond to distance from the origin along the radial, orbital, and vertical directions, respectively. The azimuthal and vertical boundaries are periodic, and the radial boundaries are shearing-periodic. Fluid passing through one radial boundary appears on the other at an azimuth which varies in time according to the difference in orbital speed across the box. The difference is computed using a Keplerian profile linearised about domain center. Owing to the periodic boundary conditions, net magnetic flux is expected to be constant over time, provided the net radial flux is initially zero.
The equations of radiation magnetohydrodynamics are solved correct to zeroth order in . Relativistic effects are neglected, the flux-limited diffusion (FLD) approximation is used, and gas and radiation are assumed to be in LTE at separate temperatures. The equations are
| (1) |
| (2) |
| (3) |
| (4) |
| (5) |
and
| (6) |
(Mihalas & Mihalas, 1984; Stone, Mihalas, & Norman, 1992; Hawley, Gammie, & Balbus, 1995). Here , , , and are the gas density, velocity, internal energy density, and pressure, respectively, and is the magnetic field. In the Coriolis term in the equation of motion 2, is the orbital angular frequency at domain center. Its direction is parallel to the rotation axis. In the tidal term, is a unit vector along the radial direction. The photons are represented by their frequency-integrated energy density , energy flux , and pressure tensor . Total opacity is the sum of electron scattering opacity cm2g-1 and free-free absorption opacity cm2g-1. In some calculations, scattering opacities higher or lower than the electron scattering value are used. The gas cools by emitting photons at a rate proportional to the blackbody value , where is the Boltzmann constant, the gas temperature, the dimensionless mean mass per particle, and the gas constant. In equation 5, the flux-limiter is equal to in optically-thick regions. Causality is preserved in regions where radiation energy density varies over optical depths less than unity, by reducing the limiter towards zero (Levermore & Pomraning, 1981). The equations are closed by assuming an ideal gas equation of state , with . Shocks are captured using an artificial viscosity in regions of convergence according to the standard prescription of von Neumann & Richtmyer (1950). We solve equations 1-6 using a three-dimensional version of the Zeus code (Stone & Norman, 1992a, b) with its FLD module (Turner & Stone, 2001).
In test calculations of magnetized turbulence in a shearing box, the fraction of the work done by shear that is lost from the domain through numerical effects is as great as 95% in ideal MHD, and as little as 20% when an Ohmic resistivity is included. We infer that the main numerical energy losses in the ideal-MHD calculations may occur in treating the magnetic terms in equations 2 and 6. For two of the calculations described in section 4, the internal energy scheme usually used in Zeus to solve equation 4 is therefore replaced by a partial total energy scheme. This is intended to capture as heat the energy that would otherwise be lost through numerical dissipation of magnetic fields. During the magnetic part of each timestep, total energy is conserved. Immediately before the magnetic fields are updated, the gas internal energy density in each zone is replaced by the sum of gas internal, magnetic, and kinetic energy densities. The field is updated as usual, with time-centered EMFs computed by the Method of Characteristics (Hawley & Stone, 1995). The same EMFs are used to find the Poynting fluxes of electromagnetic energy across zone faces. Total energy is moved from zone to zone according to these fluxes, using the difference form of
| (7) |
Accelerations due to Lorentz forces are applied to the velocities in the usual way. Finally, the new magnetic and kinetic energies are subtracted from the new total energies, and the remainder is assigned to gas internal energy.
Results using the internal and partial total energy schemes were compared against a one-dimensional analytic solution for propagation of non-linear torsional Alfvén waves in a uniform fluid (Sano, 1998). The waves have moving nulls in the components of the field transverse to the direction of propagation. At the nulls, numerical losses of magnetic field may be rapid. Tests were carried out with longitudinal and transverse fields initially equal. The gas was either stationary on the grid, or moving in the direction of wave propagation at nine times the Alfvén speed. When gas and magnetic pressures were equal, results using the two schemes were similar. When gas pressure was 1% of magnetic pressure, numerical losses of field near magnetic nulls in the internal energy scheme led to longitudinal total pressure variations. Longitudinal motions grossly distorted the wave within a few oscillations. With the partial total energy scheme, total pressure was almost constant across the nulls, and the wave shape changed only slightly over ten oscillations. For the case of stationary fluid, total energy decreased less than one part in over the same period. In additional tests, results for the Brio & Wu (1988) MHD Riemann problem differed little between the two energy schemes.
3 INITIAL CONDITIONS
Initial conditions are selected from a Shakura & Sunyaev (1973) model with parameters appropriate for an active galactic nucleus. The central mass , luminous efficiency , and accretion rate is 10% of the Eddington value yr-1. In choosing the initial state only, the ratio of stress to total pressure is set to . The domain is uniformly filled with gas having the density and midplane temperature of the Shakura-Sunyaev model at the central radius . Radiation energy density is chosen for thermal equilibrium with the gas. The calculations are centered either at location I, where and radiation pressure is 125 times gas pressure, or at location II, where and radiation pressure is 10 times gas pressure. The gravitational radius . Location I is identical to location A discussed by TSS, while location II is considered in section 5 because the vertical MRI wavelength may be unresolved in calculations with zero net magnetic flux at location I. Conditions at the two locations are listed in table 1. At these radii, the Shakura-Sunyaev model has large electron scattering optical depths and large effective free-free optical depths . The timescales for free-free energy exchange between gas and radiation are much less than the orbital periods, consistent with the assumption of initial thermal equilibrium. Additional sources of absorption opacity likely would have little further effect provided Thomson scattering remained the largest contribution to the total.
| Location I | Location II | |
|---|---|---|
| /g cm-3 | ||
| /K | ||
The height and width of the domain in all the calculations described here are set to the half-thickness of the Shakura-Sunyaev model. The depth along the direction of orbital motion is made four times greater. This allows the development of structures extended along the azimuthal direction, as seen in calculations without radiation effects (Hawley, Gammie, & Balbus, 1995). Photons diffuse from midplane to surface in approximately orbits in the Shakura-Sunyaev picture. At the standard electron scattering opacity, photons diffuse across the domain height in 50 orbits at both locations I and II.
Orbital velocities initially follow the linearised Keplerian profile required for radial force balance. Radial and vertical velocities in each zone are randomly chosen between % and % of the radiation acoustic speed.
3.1 Diffusion of Radiation with Respect to Gas Fluctuations
Since photon diffusion can slow the linear growth of the MRI, it is possible that the fully-developed turbulence may be affected also. The growth rate of the fastest axisymmetric linear mode is less than when the azimuthal magnetic pressure exceeds the effective pressure. The effective pressure is equal to the gas pressure if radiation is absent, or diffuses quickly. On the other hand, the effective pressure is due to gas and radiation together, if radiation pressure disturbances grow faster than they are erased by diffusion (Blaes & Balbus, 1994; Blaes & Socrates, 2001). In this section we consider the conditions under which radiation may provide support against magnetic forces in turbulence, so that fluctuations in density and radiation pressure are correlated.
From local MHD simulations with and without radiation, it has been found that turbulence driven by MRI is anisotropic. Fluctuations are thinner on average in the vertical direction than in the radial and azimuthal [Hawley, Gammie, & Balbus (1995, 1996); this work, sections 4 and 5]. The characteristic size is the vertical MRI wavelength , and individual fluctuations typically last about one orbital period . Photons may be expected to couple to the turbulence if the average vertical MRI wavelength is longer than the distance diffused per orbit, . This condition for good coupling may be written
| (8) |
or
| (9) |
The criterion is independent of the density provided electron scattering is the largest opacity.
4 UNIFORM VERTICAL MAGNETIC FIELD
In this section we describe results from simulations with initially uniform, vertical magnetic fields. The domain is placed at location I, where radiation pressure is 125 times gas pressure. The grid consists of 32, 128, and 32 zones along the -, -, and -directions, respectively.
4.1 Fiducial Calculation
For the fiducial calculation, the initial field strength is chosen so that the MRI wavelength is one-quarter the domain height, and about twice the distance photons diffuse per orbital period. The magnetic pressure is less than the gas pressure by a factor of five, and less than the sum of gas and radiation pressures by a factor of 630.
During the first 2.5 orbits of the calculation, the initial random poloidal velocity perturbations lead to exponential growth of several linear modes. As expected, the mode growing fastest has four wavelengths in the domain height, and is independent of radius. Its growth rate is 0.55 times the orbital angular frequency. When the radial magnetic field is comparable to the vertical field, inward and outward moving regions collide and the flow becomes turbulent. Turbulence continues to the end of the calculation at 50 orbits. The other calculations described in this section all pass through the same stages of linear growth and sustained turbulence.
The time evolution of the fiducial calculation is shown in figure 1. At the start of the turbulent stage, total magnetic pressure increases by about two orders of magnitude owing mostly to growth of the azimuthal field. Thereafter, magnetic pressure varies irregularly by an order of magnitude. Its time average between 10 and 50 orbits is 59% of initial gas plus radiation pressure. The variations are caused by repeated formation and disruption of channel flows, similar to those observed in calculations without radiation by Sano & Inutsuka (2001). During periods of field growth, the flow is nearly axisymmetric, and consists of layers of inward and outward-moving fluid alternating along the vertical direction. Radial and azimuthal field strengths increase in lockstep, as in the linear axisymmetric MRI. Near peak field strength, the square root of the domain-averaged squared vertical MRI wavelength may exceed the domain height. During periods of field decay, the flow is slower and less ordered, and the RMS vertical MRI wavelength becomes shorter than the domain height. Like the magnetic pressure, the accretion stress has a well-defined saturated value. Its time average from 10 to 50 orbits is 36% of initial gas plus radiation pressure. When averaged over intervals longer than ten orbits, the magnetic pressure and stress vary little with time. The mean ratio of the magnetic and hydrodynamic accretion stresses is 5.3, and angular momentum transfer is due largely to the magnetic stress.
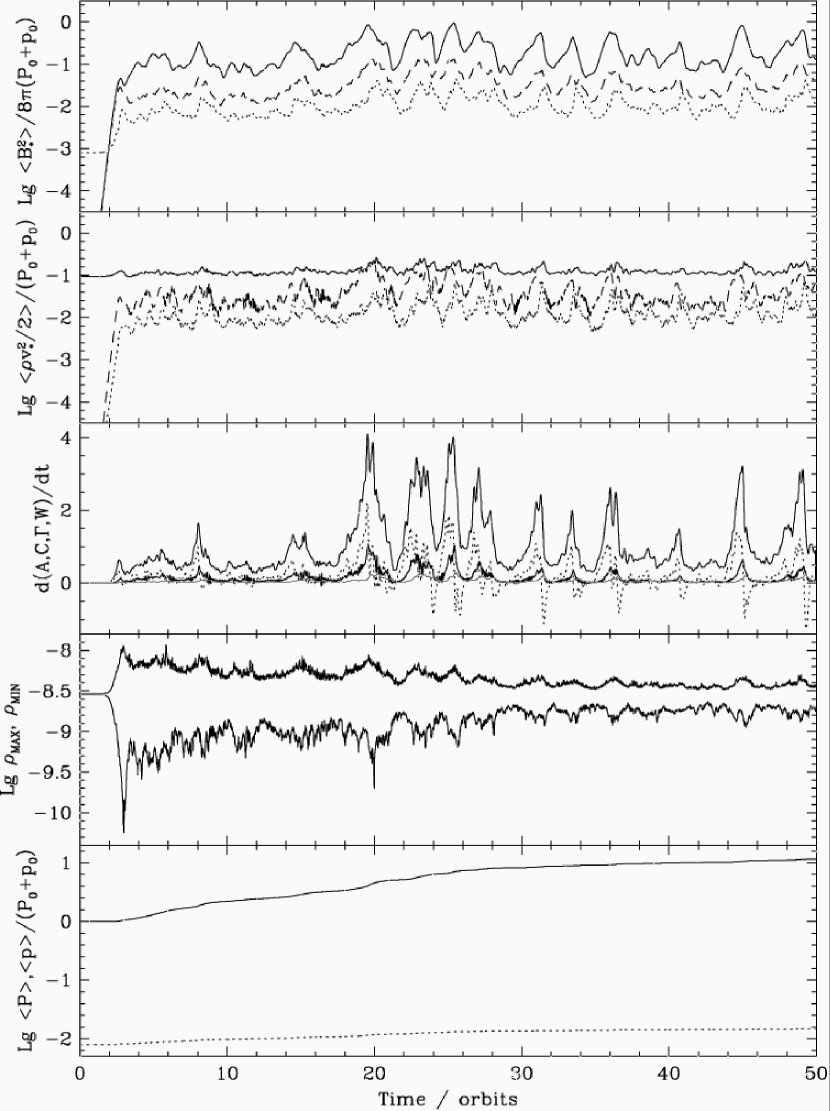
Gas and radiation remain close to mutual thermal equilibrium throughout the fiducial calculation due to photon emission and absorption, while their pressures increase with time. Over 50 orbits, radiation pressure increases twelve-fold, gas pressure almost a factor two. The increases are due mostly to work done by the flow on the photons. Integrated from 10 to 50 orbits and over the domain, the compressive heating and artificial viscous heating are 15% and 6%, respectively, of the work done by accretion stresses during this period. Here is the tensor artificial viscosity, and the subscript indicates integration over the radial boundary (Hawley, Gammie, & Balbus, 1995). Defining total energy as the sum of radiation, internal, magnetic, kinetic, and gravitational potential energies in the local frame, the total energy increase between 10 and 50 orbits is just 21% of the energy added to the box by accretion stresses. The remainder of the work done is removed through numerical losses of magnetic and kinetic energy. The density contrast is more than an order of magnitude during the first few orbits of turbulence, but decreases over time, reaching about two at 50 orbits.
Radiation diffusion is an excellent approximation throughout the calculation. At all times, the zone with the lowest density has an optical depth greater than 19. The components of the Eddington tensor differ from their isotropic values by less than , and flux-limiting is unimportant. The coupling between turbulent fluctuations in gas and radiation varies, owing to the changes in the strength of the magnetic field, but is generally good. The ratio of the vertical MRI wavelength to the diffusion length, computed using the domain-averaged vertical magnetic pressure, ranges from 4, when the field is weakest, to 13, when the field is strongest. Thus, equation 8 is satisfied throughout the evolution. The time-averaged RMS fluctuation in radiation pressure is comparable to the fluctuation in magnetic pressure, indicating photons are sufficiently coupled to the turbulence to provide pressure support against magnetic forces.
The ratio of magnetic accretion stress to vertical magnetic pressure ranges from 8 to 20, and has time-average 12.5. The ratio varies in part due to formation and break-up of channel flows. Radial and azimuthal fields grow in the channel flows through MRI, leading to increases in the ratio of domain-averaged to . When the channels are disrupted, some radial and azimuthal fields are rotated in the turbulence to become vertical, and the ratio of stress to pressure declines. From the top panel of figure 1, it may be seen that the peaks in vertical magnetic energy density occur later than the peaks in the other two components.
The parameters for all the calculations with initially uniform vertical magnetic fields are shown in table 2. Each calculation is given a label containing the letter V to indicate that its magnetic field has a net vertical flux. The labels of those including radiation effects start with R. The labels of those without the radiation terms start with N. Each label includes a number indicating the ratio of the domain height to the initial MRI wavelength, which fixes the magnetic field strength. For example, the fiducial calculation has label RV4. Suffixes indicate a higher opacity (h), a lower opacity (l), and a change in the seed used in generating the random initial poloidal velocities (s). Initial radiation, magnetic, and gas pressures are listed relative to the gas pressure at location I.
| Label | Name | |||||
|---|---|---|---|---|---|---|
| NV2.5 | 2.5 | |||||
| NV4 | Same total pressure | 4 | ||||
| NV8 | 8 | |||||
| NV12 | 12 | |||||
| NV16 | 16 | |||||
| RV4h | High opacity | 4 | 100 | |||
| RV2.5 | 2.5 | 1 | ||||
| RV3 | 3 | 1 | ||||
| RV4aaAlso computed using partial total energy scheme as described in section 4.4. | Fiducial | 4 | 1 | |||
| RV5 | 5 | 1 | ||||
| RV6 | 6 | 1 | ||||
| RV8 | 8 | 1 | ||||
| RV12 | 12 | 1 | ||||
| RV16 | 16 | 1 | ||||
| RV2.5l | 2.5 | 0.25 | ||||
| RV4l | Low opacity | 4 | 0.25 | |||
| RV4ls | 4 | 0.25 | ||||
| RV8l | 8 | 0.25 | ||||
| RV12l | 12 | 0.25 | ||||
| RV16laaAlso computed using partial total energy scheme as described in section 4.4. | 16 | 0.25 |
The results of the vertical field calculations are summarized in table 3. The domain average of quantity is indicated by , the time and domain average by . RMS values are computed by the square root of the domain average of the square. Time averages in table 3 are taken between 10 and 50 orbits after the start of each run. The quantities listed are (column 1) the label of the simulation; (2) the RMS ratio of the vertical MRI wavelength to the distance photons diffuse per orbit; (3) the ratio of magnetic stress to vertical magnetic pressure; (4) the total accretion stress , in units of the gas plus radiation pressure at location I; (5) the density contrast; and (6) the compression heating and (7) artificial viscous heating between 10 and 50 orbits, as fractions of the work done by accretion stresses during this period.
| Label | Coupling | Field geometry | Total stress | Density range | Compression | Artificial |
|---|---|---|---|---|---|---|
| / | heating | viscous heating | ||||
| (1) | (2) | (3) | (4) | (5) | (6) | (7) |
| NV2.5 | 12.6 | 0.700 | 1.35 | 0.0282 | 0.0699 | |
| NV4 | 11.1 | 0.291 | 1.68 | 0.0217 | 0.0757 | |
| NV8 | 9.75 | 0.0883 | 1.78 | 0.00811 | 0.0876 | |
| NV12 | 10.9 | 0.0473 | 1.77 | -0.00479 | 0.104 | |
| NV16 | 11.3 | 0.0357 | 1.74 | -0.00531 | 0.103 | |
| RV4h | 71.0 | 12.1 | 0.358 | 2.10 | 0.0534 | 0.0738 |
| RV2.5 | 9.26 | 10.8 | 0.547 | 2.34 | 0.114 | 0.0656 |
| RV3 | 8.34 | 11.9 | 0.487 | 2.96 | 0.132 | 0.0659 |
| RV4 | 6.97 | 12.5 | 0.359 | 3.64 | 0.146 | 0.0648 |
| RV5 | 5.33 | 11.0 | 0.188 | 3.70 | 0.147 | 0.0663 |
| RV6 | 5.05 | 10.2 | 0.158 | 4.11 | 0.150 | 0.0687 |
| RV8 | 3.62 | 10.1 | 0.0845 | 4.45 | 0.160 | 0.0685 |
| RV12 | 2.40 | 10.8 | 0.0397 | 5.14 | 0.170 | 0.0674 |
| RV16 | 1.83 | 11.3 | 0.0249 | 5.02 | 0.171 | 0.0696 |
| RV2.5l | 4.84 | 12.7 | 0.682 | 7.80 | 0.196 | 0.0596 |
| RV4l | 3.39 | 12.3 | 0.324 | 11.5 | 0.226 | 0.0576 |
| RV4ls | 3.07 | 11.2 | 0.257 | 13.2 | 0.229 | 0.0564 |
| RV8l | 1.74 | 10.1 | 0.0767 | 23.9 | 0.258 | 0.0572 |
| RV12l | 0.990 | 10.3 | 0.0258 | 20.4 | 0.260 | 0.0563 |
| RV16l | 0.722 | 11.0 | 0.0149 | 18.7 | 0.262 | 0.0563 |
Note. — Results are averaged between 10 and 50 orbits.
4.2 Magnetic Field and Accretion Stress
Over the range of opacities explored here, radiation diffusion has little effect on the accretion stress (figure 2). Results from the fiducial calculation are shown along with those from versions with scattering opacity increased a hundredfold (RV4h) and decreased fourfold (RV4l), and radiation pressure replaced by an equal amount of additional gas pressure (NV4). The four calculations have the same initial magnetic field. The total stresses, averaged over the domain and over time between 10 and 50 orbits, are 0.36, 0.36, 0.32, and 0.29 times the initial gas plus radiation pressure, respectively. The differences in mean stress among the four are much less than the range of time variation in each. Stresses in the calculation which includes gas pressure only are similar to those in the runs including both gas and radiation. The time-averaged RMS ratio of the diffusion scale to the MRI wavelength is 1/71 in the high-opacity version, 1/7 in the fiducial version, and 1/3.4 in the low-opacity version. In these calculations having a net vertical magnetic flux and strong to marginal coupling between gas and radiation, the stresses vary little with the diffusion rate.

The dependence of the mean total accretion stress on initial magnetic pressure is shown in figure 3. The relationship is approximately linear over the limited range explored, with the stress about 200 times the initial magnetic pressure. The uncertainty in the positions of the points may be gauged by comparing the two open squares near horizontal position . These are from RV4l and a calculation RV4ls identical except that the initial poloidal velocity perturbations are chosen using a different random number seed. The differences between results with and without radiation in figure 3 are about as large as the differences resulting from the changed perturbation.
In calculations carried out by Hawley, Gammie, & Balbus (1995), the saturation level is proportional to the net vertical magnetic field rather than the vertical magnetic pressure (their figure 6). The discrepancy may be due in part to the longer integration time employed here. Longer integrations allow better estimates of the time-averaged values of the fluctuating stresses. The results in figure 3 are from runs lasting 50 orbits, whereas the previous calculations lasted 7 to 16 orbits.
The mean ratios of magnetic to hydrodynamic stress in our calculations are mostly about 5, and the range is from 2.0 to 12. There is no clear trend in the ratio of magnetic to hydrodynamic stress with field strength or opacity.
The time variations in the accretion stress, associated with formation and breakup of channel flows, decrease in relative amplitude with decreasing field strength. In calculations with 12 and 16 wavelengths initially filling the domain height, no strong channel flows are observed on the largest scale. In the weakest-field calculations NV16, RV16, and RV16l, the MRI wavelength is initially only 2 grid zones. However, during the turbulent stage, the field is stronger than initially owing to squeezing and folding. The time-averaged RMS vertical MRI wavelengths in NV16, RV16, and RV16l are 10, 8, and 7 zones, and are probably adequately resolved. The large stress variations occur only in the calculations having vertical MRI wavelength comparable to the box height.
Overall, in the simulations with net vertical flux, the saturated field strength and accretion stress are similar with and without radiation effects, whether the photons are strongly or marginally coupled to the flow.

4.3 Turbulent Fluctuations
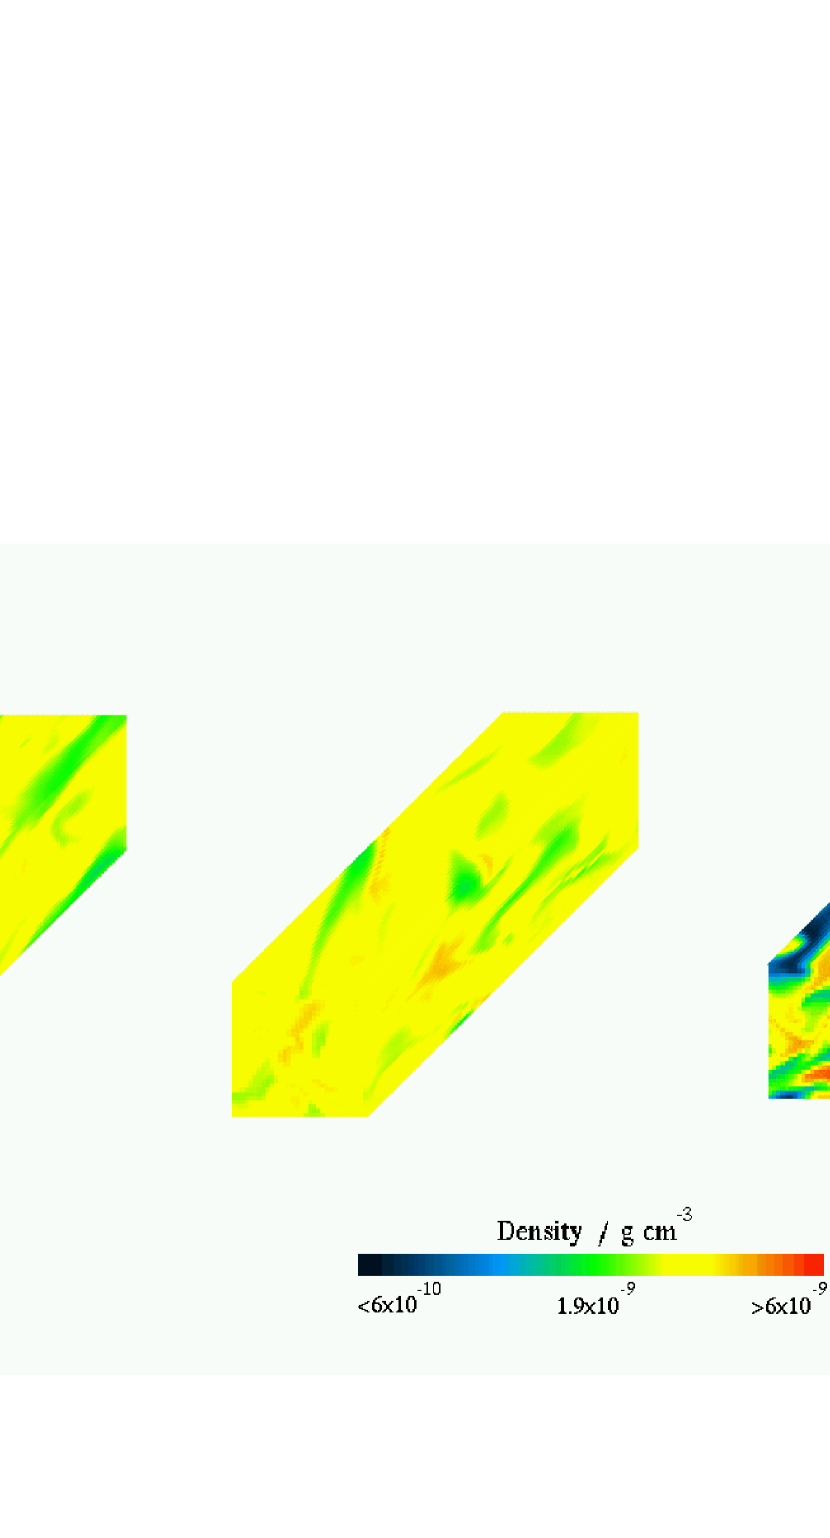
Large density contrasts may be expected if magnetic pressure is greater than gas pressure, and radiation diffuses rapidly. As shown in figure 4 and table 3, the density range is larger in the fiducial calculation RV4 than in the version NV4 with the radiation replaced by extra gas pressure. Among radiation runs with identical initial magnetic fields, the density contrast is greater in those having weaker coupling of photons to gas. Run RV4l, where the mean vertical MRI wavelength is 3.4 times the diffusion length, has a time-averaged density contrast . The fiducial calculation RV4 has a similar mean vertical MRI wavelength, a diffusion length half as great, and a mean density contrast of 3.6. In the high-opacity run RV4h, the diffusion length is ten times shorter again. The mean density contrast is about 2, and differs little from that in the run NV4 with radiation replaced by extra gas pressure. Among the calculations listed in table 2, the time-averaged RMS density fluctuation is well-correlated with the logarithm of the time-averaged density contrast, indicating that these two quantities are about equally good measures of the overall density distribution.
Two calculations differing in vertical magnetic pressure can have the same degree of coupling, provided they differ in opacity in the inverse proportion. The squared ratio of the vertical MRI wavelength to the diffusion scale is proportional to , as shown by equation 8. At a given level of coupling, the density contrast is found to be greater in the calculation with the stronger magnetic field (figure 5). For large density contrasts, it is necessary that the mean magnetic pressure be at least comparable to the gas pressure, but not so large that the vertical MRI wavelength is longer than the radiation diffusion length. At fixed gas pressure, the maximum density contrast is attained near the magnetic pressure for which the coupling is marginal.
The density contrast in the fiducial calculation decreases over time (figure 1) as the pressure rises. Gas and radiation pressures increase steadily owing to dissipation of energy released through the accretion stresses, whereas magnetic pressure, averaged over periods of ten orbits, varies little during the turbulent stage. At 50 orbits, radiation pressure is 12 times larger than initially. In a weaker-field calculation RV16, the density range near the end of the turbulent stage is similar to that near the beginning. The mean accretion stress here is 14 times lower, and radiation pressure increases only 1.8-fold over 50 orbits. The density range depends on the pressure available to resist squeezing by the magnetic field.

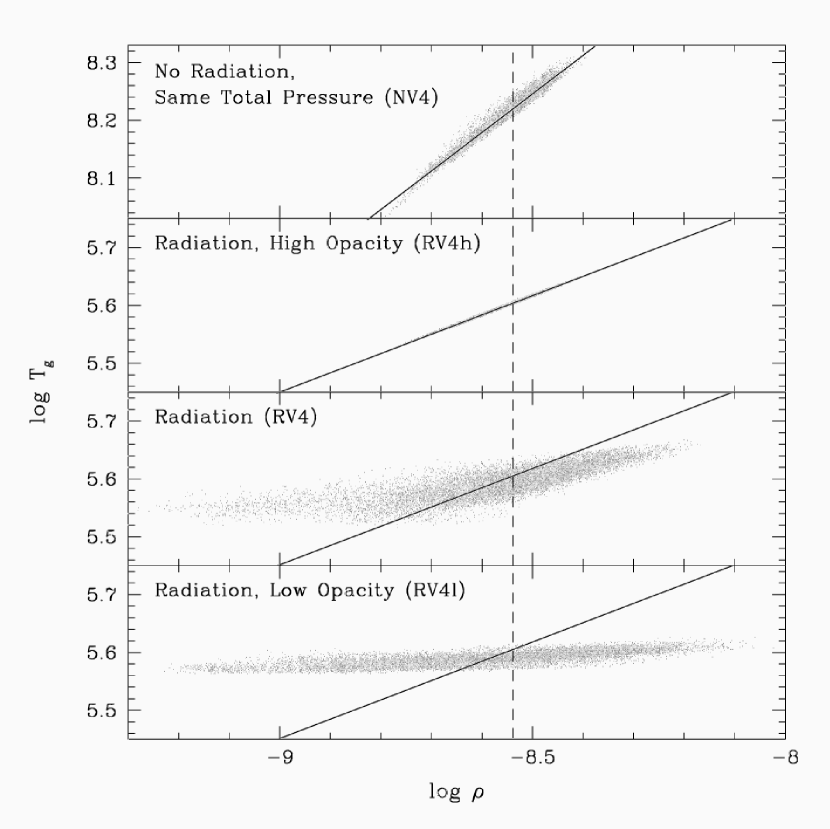
The effective equation of state of fluctuations in the turbulence depends on the degree to which the radiation is coupled to the gas. When the scattering opacity is large and gas and photons travel together, the combined fluid has an adiabatic equation of state with exponent very close to (figure 6, second panel). When the distance photons diffuse per orbit is comparable to the vertical MRI wavelength, temperature excursions in the gas are damped by rapid emission or absorption, followed by escape of photons to other regions. In this case the gas is close to isothermal (figure 6, bottom panel). At the highest densities, radiation is partly trapped, and the temperature rises slightly above that of the rest of the flow.
4.4 Heating
During the fiducial calculation RV4, the energy density in gas plus radiation increases by eleven times its initial value. Heating is fastest when the magnetic field strength and density contrast are large (figure 1). Three terms in the energy equations 3 and 4 may lead to net increases in the total internal energy in the domain. These are the terms representing compression of radiation and of gas, and artificial viscous heating of the gas. Net compression heating may be found in shocks. It can also occur when regions of the flow are squeezed, then cool as radiation diffuses out into the surroundings. Because diffusion is thermodynamically irreversible, this mechanism leads to permanent conversion of work into photon energy. Work done on the gas is largely converted into radiation energy within a fraction of an orbit by emission of photons, and can diffuse away also. In the fiducial calculation, the net increase in total internal energy owing to the two compression terms is 15% of the work done on the flow by accretion stresses. The increase owing to artificial viscous heating is 6% of the energy input. In the calculation NV4 with radiation replaced by additional gas pressure, diffusion is absent and the compression heating rate is lower. The contributions from compression and artificial viscosity are 2% and 8%, respectively. Among the calculations listed in table 3, the largest ratio of compression heating to energy input is 26%, and occurs in the low-opacity, weak-field run RV16l, where the coupling of photons to gas is weakest. The average compression heating fraction varies with the logarithm of the density contrast in these calculations (figure 7). The tight correlation between heating efficiency and density range indicates that the criteria for strong compression heating are similar to those for large density contrast outlined in section 4.3.

The low ratios of the heating rates to the work done in each of the simulations listed in table 3 mean that the majority of the released energy vanishes, and is never deposited in the internal energy of gas or photons. In resistive MHD calculations without radiation, up to 80% of the work done is dissipated by Ohmic heating (Sano & Inutsuka, 2001). Losses of magnetic field without corresponding heating may be a major sink of energy in ideal MHD calculations. Such losses can occur through numerical diffusion, and through advection of opposing magnetic fields into a single grid zone. To examine the importance of numerical magnetic losses for the energy balance here, we made a version of the weakest-field low-opacity radiation calculation RV16l, using the partial total energy scheme described in section 2. With this scheme, total energy is conserved during the magnetic field update and Lorentz acceleration portion of each timestep. Magnetic energy which disappears during the field update is placed in the internal energy of the gas. In the version of run RV16l using this scheme, the increase in total energy between 10 and 50 orbits is equal to 90.6% of the work done by the accretion stresses. The contributions from compression heating, artificial viscous heating, and numerical magnetic losses are 23.6, 5.51, and 61.5% of the work done, respectively. The majority of the remaining 9.4% may disappear through losses of kinetic energy in the momentum transport substep. The mean total stress, 0.0204 times the initial gas plus radiation pressure, differs only slightly from that in the version using the ordinary internal energy scheme. The sum of gas and radiation pressures increases 3.4-fold over 50 orbits, whereas in the version RV16l using the usual internal energy scheme, the increase is only 60%. Gas and radiation remain near thermal equilibrium despite the additional heating, owing to the emission and absorption of photons. In a version of the fiducial run RV4 using the partial total energy scheme, the extra heating leads to such rapid increases in gas and radiation pressures that the flow becomes almost incompressible after a few orbits of turbulence, and heating largely ceases. These results indicate that numerical losses of magnetic energy must be considered when using MHD simulations to examine the energy budgets of accretion disks.
5 FIELDS WITH ZERO NET FLUX
Magnetic fields with net vertical flux, such as those used in section 4, cannot be completely destroyed in the shearing-box approximation owing to the periodic boundaries. The mean pressure in the vertical component of the field cannot fall below its initial value. In this section we consider fields with zero flux. Under these conditions, dissipation and dynamo action may lead to fields either weaker or stronger than initially. The starting magnetic field chosen has strength independent of position, and direction varying with radius . Its components are
| (10) |
| (11) |
and
| (12) |
Field strength is such that the MRI wavelength is one quarter of the domain height .
In calculations with zero net magnetic flux centered at location I, field strength declines during the turbulent stage until the RMS vertical MRI wavelength is less than two grid zones, and turbulence ceases. The true saturation level may correspond to a vertical MRI wavelength less than the grid spacing. The rest of the calculations with zero net flux are carried out at location II, where radiation pressure is ten times gas pressure (section 3). To better resolve the MRI wavelength at weak magnetic field strengths, a grid consisting of zones is used except where noted. The parameters for the calculations with zero net magnetic flux are listed in table 4, and some time- and domain-averaged results are shown in table 5. Initial pressures in table 4 are written in terms of the gas pressure at location II.
| Label | Name | Duration | |||||
|---|---|---|---|---|---|---|---|
| /orbits | |||||||
| NS4 | Same total pressure | 4 | 100 | ||||
| NS4g | Same gas pressure | 4 | 198 | ||||
| RS4h | High opacity | 4 | 100 | 87 | |||
| RS4 | Radiation | 4 | 1 | 140 |
| Label | Coupling | Field geometry | Total stress | Density range | Compression | Artificial |
|---|---|---|---|---|---|---|
| / | heating | viscous heating | ||||
| (1) | (2) | (3) | (4) | (5) | (6) | (7) |
| NS4 | 13.4 | 4.90 | 1.37 | 0.137 | ||
| NS4g | 19.0 | 1.25 | 1.71 | 0.184 | ||
| RS4h | 81.0 | 12.4 | 6.49 | 1.52 | 0.131 | |
| RS4 | 0.214 | 16.2 | 2.08 | 2.04 | 0.0538 |
Note. — Results are averaged between 30 and 80 orbits.
5.1 Magnetic Field and Accretion Stress
We first examine how field strength in the turbulence depends on gas pressure, in the absence of radiation. The results are then compared against similar calculations including coupling to photons.
For compressible flows, the gas pressure gradient term in the equation of motion 2 can affect the development of the magnetic field. Linear perturbations have a compressive part if the background field includes an azimuthal component (Blaes & Balbus, 1994; Kim & Ostriker, 2000). Pressure effects may be present also in well-developed turbulence. In local shearing-box calculations with zero net magnetic flux, the accretion stress at saturation is proportional to the fourth root of the gas pressure (T. Sano, in preparation).
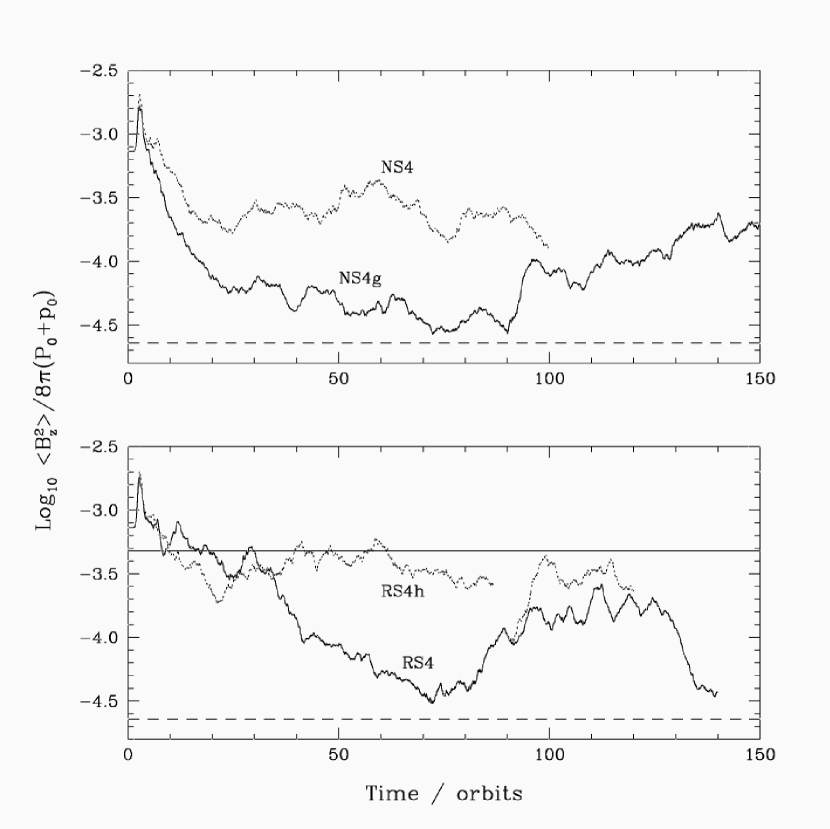
To compare directly with the radiation results described next, we performed two calculations without radiation, using different initial gas pressures. In run NS4, the radiation pressure at location II is replaced by an equal amount of additional gas pressure. In run NS4g, no extra gas pressure is added, and the initial pressure is 11 times less. Results are shown in figure 8, upper panel. The total accretion stress, averaged from 30 to 80 orbits, is 0.00490 in the higher-pressure calculation NS4, and 0.00124 in the lower-pressure calculation NS4g. The stresses are measured in units of the initial gas plus radiation pressure at location II. In both cases, the magnetic part of the stress is about three times the hydrodynamic part. Gas pressure increases over time in both runs, owing to dissipation of the turbulence. The mean gas pressures over the same period are 1.08 and 0.209, in the same units. During this interval, run NS4 has mean gas pressure 5.2 times greater than NS4g, and mean stress 4.0 times greater. The relationship between stress and pressure is steeper than , perhaps due to the small number of grid zones per vertical MRI wavelength in run NS4g. However, the differences between these calculations with identical initial magnetic fields suggest that stress does depend on pressure. More evidence regarding the dependence can be obtained from the time variation in the lower-pressure calculation, NS4g. The accretion stress increases beginning at 90 orbits. The average between 130 and 180 orbits is 0.00260, 2.1 times greater than between 30 and 80 orbits. The mean gas pressure is 0.364, 1.7 times greater than during the earlier period. All of these results indicate that the saturation level of the magnetic field depends on gas pressure, when both net magnetic flux and radiation effects are absent.
The effects on field strength of the coupling between radiation and gas may be seen from the lower panel of figure 8. In the high-opacity calculation RS4h, the scattering opacity is 100 times the electron scattering value, the vertical MRI wavelength is initially 20 times the diffusion scale, and the photons are thoroughly coupled to the flow throughout the run. The field strength is similar to that in run NS4, where radiation is replaced by extra gas pressure. By contrast in the standard radiation calculation RS4, the scattering opacity is set to the usual electron scattering value. Initially the vertical MRI wavelength is about twice the distance radiation diffuses per orbit, and photons are moderately coupled to the gas. The domain-mean total magnetic pressure is always greater than initially due to stretching along the azimuthal direction. However the mean pressure in the vertical component of the field declines over the first ten orbits of turbulence, and thereafter remains less than its initial value. From 30 orbits onwards, the vertical MRI wavelength is less than the diffusion scale, and photons are weakly coupled to disturbances. The magnetic field is weaker than in the high-opacity case. Averaged from 30 to 80 orbits, the total stress is in RS4, and in the high-opacity version RS4h. Field strength in the standard-opacity run RS4 is comparable to that in the low-gas-pressure run NS4g without radiation. The two calculations differ in that gas pressure rises more slowly with time in RS4. Heating of the gas is almost entirely offset by the net emission of radiation required to maintain thermal equilibrium. In run NS4g, radiation effects are not included, and the gas has no means of cooling.
To examine possible effects of the choice of initial magnetic field, we have also carried out a high-opacity run initialized with the density, pressure, and magnetic field distributions from the standard-opacity calculation RS4 at 90 orbits. Over ten orbits, the field grows in strength until it is similar to that in the high-opacity calculation RS4h. The total stress, averaged from 10 to 30 orbits after the increase in opacity, is 0.00525.
In these five calculations, the MRI generates fluctuations in magnetic fields which lead to fluctuations in gas and radiation pressures. If radiation diffuses quickly, the radiation pressure is almost spatially uniform, and gradients are smaller than those in gas pressure. Gas pressure gradients alone resist magnetic fluctuations. On the other hand, when radiation diffuses slowly, the spatial distributions of gas and radiation are quite similar. The radiation pressure gradient works in the same way as the gas pressure gradient. In this case, the effective thermal pressure is the sum of the gas and radiation pressures. The saturation amplitude is found to be larger in the calculations with larger effective pressure.
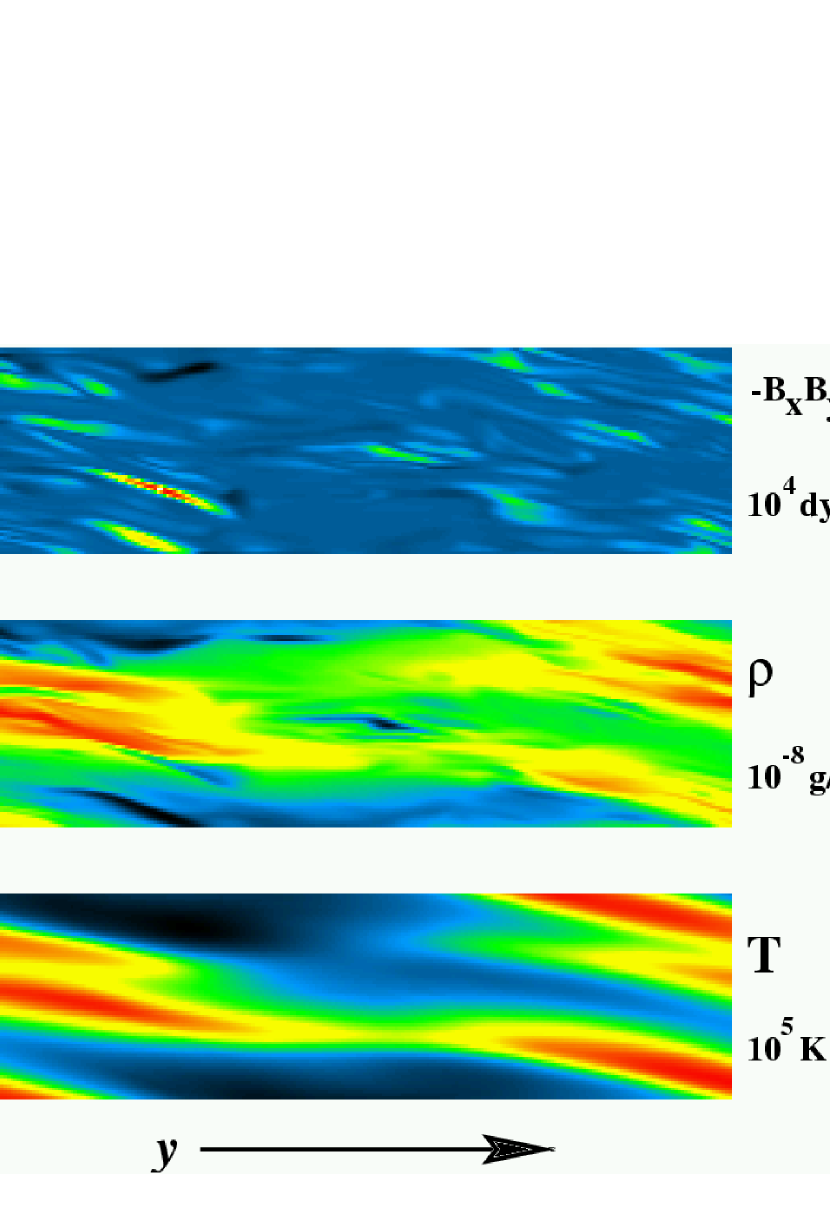
The magnetic field is patchy in the standard radiation run RS4 (figure 9, top panel). The vertical extent of the patches is typically the domain height , similar to the RMS vertical MRI wavelength. Domain-mean magnetic pressure also varies over time, by almost an order of magnitude. The vertical magnetic pressure at 70 orbits is less than the initial total pressure by a factor . At 120 orbits, the ratio is only . This variation is probably not related to a long-term increase in gas or radiation pressure. Mean radiation pressure rises over 140 orbits by only 35%, gas pressure by 8%. The variation in stress is also probably not due to changes in the degree to which radiation is tied to the gas. After the initial decline in field strength, the RMS vertical MRI wavelength ranges from 0.25 to 0.74 times the distance photons diffuse in an orbit, and coupling is weak. The variation is most likely related to the limited numerical resolution. When the magnetic field is at its strongest in calculation RS4, the RMS vertical MRI wavelength is about ten grid zones. However, when the field is at its weakest, the wavelength is less than three zones. In a version of run RS4 using zones, the magnetic field decays exponentially and turbulence ends, after the vertical MRI wavelength falls below two grid zones. In corresponding low-resolution versions of the high-opacity and same-total-pressure runs RS4h and NS4 with zones, magnetic fields are stronger, the fastest-growing wavelengths are marginally resolved, and turbulence is long-lasting. The accretion stresses between 30 and 80 orbits, and respectively, are similar to those in the higher-resolution versions.
The ratio of the magnetic stress to the vertical magnetic pressure in the standard radiation calculation RS4, averaged from 30 to 80 orbits, is 16.2. The ratio varies with the strength of the field. During periods when the field is greatest, the ratio is about 12, and lies in the range found in the calculations with net magnetic flux (section 4). The field may be sufficiently well-resolved in these periods. At times when the RMS vertical MRI wavelength is just longer than two grid zones, the stress is about 30 times the vertical magnetic pressure. The magnetic field is more nearly azimuthal when it is weaker. The field geometry varies with magnetic pressure in a similar way in the calculations with high opacity RS4h and without radiation NS4 and NS4g, within the range of magnetic pressure the calculations have in common. In the lower-resolution versions of RS4h and NS4, the vertical magnetic pressure is about three times less at the same magnetic stress. This effect may be due to marginal spatial resolution.
We conclude that the accretion stress depends on gas pressure in the absence of radiation effects. If radiation dominates total pressure, the stress depends on both gas pressure and opacity. When coupling between gas and radiation is strong, radiation pressure plays a role similar to extra gas pressure, and the stress is large. When photons are decoupled from turbulent motions, and compression is resisted largely by gas pressure, the stress is less.
5.2 Turbulent Fluctuations
The gas is nearly isothermal on small scales in the standard radiation run RS4, despite small-scale density fluctuations (figure 9, middle and bottom panels). Photons readily diffuse between the regions of compression and expansion, so that the radiation temperature is close to uniform. Gas and radiation temperatures differ by less than 1% because the timescale for thermal equilibration is much less than the orbital period. In the high-opacity calculation RS4h, the vertical MRI wavelength is longer than the diffusion scale, the effective equation of state is that of a gas, and temperature fluctuations are comparable in magnitude to density fluctuations. The calculations NS4 and NS4g without radiation show the expected adiabatic relation between temperature and density.
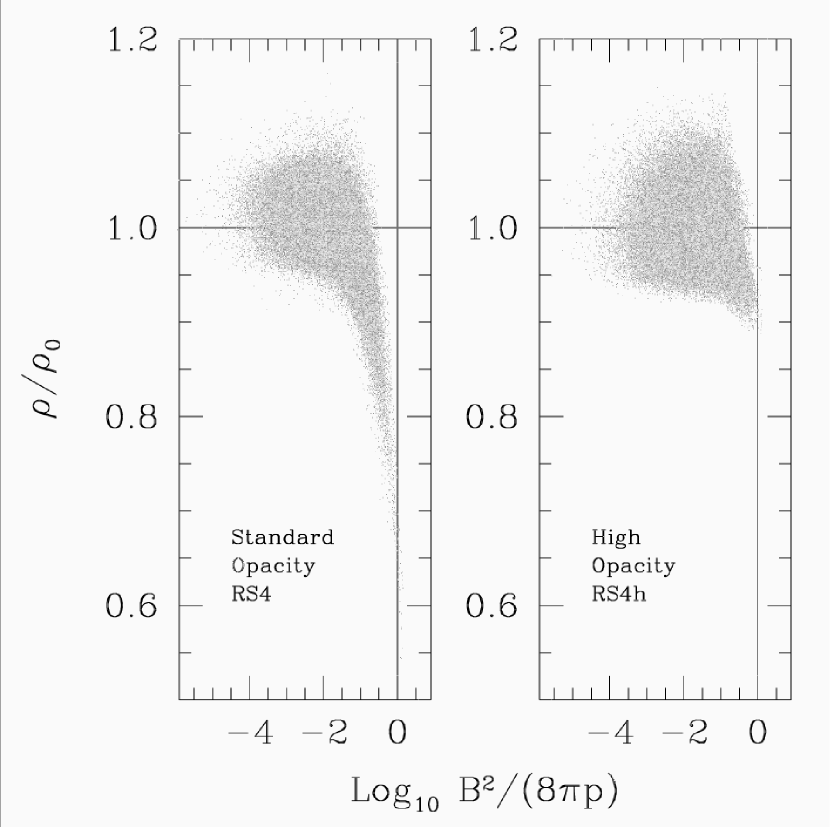
In the standard radiation run RS4, the density is lowest in regions having magnetic pressure greater than gas pressure. Where the magnetic field is weak, the density is near its mean value (figure 10). The situation is different in the high-opacity run RS4h, where radiation pressure resists compression even in regions with magnetic pressure exceeding gas pressure. The mean density contrast in RS4h is 1.52, whereas that in RS4 is 2.04 despite the weaker magnetic field (table 3). In the calculation NS4g with radiation removed, the mean density range between 30 and 80 orbits is 1.71, intermediate between those in RS4 and RS4h. The density contrast may be less than in RS4 because gas pressure doubles during the first 30 orbits in NS4g, owing to dissipation of the turbulence without net emission of photons. In the calculation NS4 with radiation replaced by extra gas pressure, the gas pressure is greater than the magnetic pressure in every zone, and the mean density contrast 1.37 is small. In summary, density fluctuations in the calculations with zero net magnetic flux are largest when radiation is weakly coupled to the disturbances, and magnetic pressure is greater than gas pressure.
5.3 Heating
Of the four calculations with zero magnetic flux listed in table 4, only one shows sustained net compression heating. In the standard radiation run RS4 between 30 and 80 orbits, the total compression heating is equal to 21% of the energy added to the domain via accretion stresses (table 5). In the remainder of the simulations with zero magnetic flux, heating is ineffective due to the absence or slow rate of radiation diffusion. Compressive motions are instead damped by artificial viscosity. In the run NS4g with radiation removed, 18% of the energy released by accretion stresses is dissipated through artificial viscous heating. Artificial viscosity is about as important in NS4g as compression heating in RS4. The artificial viscous heating in runs RS4h, NS4, and NS4g is partly balanced by net expansion cooling, indicating pressures are greater on average during expansion than during compression. Of the four calculations, only the standard radiation run RS4 shows substantial heating by a physical mechanism.
6 DISCUSSION
The variation of stress with opacity, the large density fluctuations, and the radiation damping described in sections 4 and 5 are all related to the amount of coupling between gas and photons. When the vertical MRI wavelength is longer than the diffusion scale, and the inequality in equation 8 is satisfied, the effective pressure which resists compression by magnetic forces is due to gas and radiation pressures together. When the MRI wavelength is shorter than the diffusion scale, the effective pressure is due to gas alone. In regions of accretion disks where radiation pressure greatly exceeds gas pressure, the degree of coupling may be a crucial factor in determining the properties of the turbulence.
The orientation of the magnetic field may be measured by the ratio of the magnetic stress to the vertical magnetic pressure . This ratio is similar in calculations with and without radiation, and with gas–photon coupling good or marginal. The time-averaged values of in the calculations listed in tables 3 and 5 are plotted in figure 11. In stratified isothermal simulations by Miller & Stone (2000), similar ratios of magnetic stress to vertical magnetic pressure were found within two scale heights of the midplane. The ratio in each of these cases is between eight and twenty. The characteristic vertical scale of turbulent fluctuations in these calculations is the RMS vertical MRI wavelength . Owing to the small range of field orientations , the characteristic vertical scale may be approximately determined from the accretion stress and gas density.

If magnetic fields in radiation-supported Shakura-Sunyaev disks have orientations similar to those observed here, then the vertical MRI wavelength may be a fixed fraction of the distance photons diffuse per orbit . From equation 8, the squared coupling ratio is
| (13) |
When a disk is in inflow equilibrium and its stress is primarily due to magnetic forces, conservation of angular momentum requires
| (14) |
where includes relativistic corrections and the effect of the overall flux of angular momentum through the disk. If the MRI-driven turbulence leads to magnetic fields with fixed orientation , the angular momentum conservation equation 14 constrains the vertical magnetic pressure, and hence the squared coupling ratio
| (15) |
Thermal equilibrium together with vertical hydrostatic balance between gravity and radiation pressure determines the disk half-thickness in terms of the accretion rate. Using this relation yields
| (16) |
where is the correction factor that is the energy conservation analog of , and is the relativistic correction to the vertical gravity. For field orientation and unit correction factors, the MRI wavelength is times the diffusion scale. For , the ratio is .
Thus, when a disk is in hydrostatic, thermal, and inflow equilibrium, and its vertical support is primarily radiative, we can expect the photons to be marginally coupled to the MHD turbulence in the interior. This result holds whether the stress scales with total pressure, gas pressure alone, or some combination, as the stress law is not specified in the derivation. However, if an uneven dissipation distribution makes the disk thinner than in the simplest picture of complete radiation support (Svensson & Zdziarski, 1994), the coupling near the midplane may be better than indicated here. Given the strong connection between coupling quality and compressibility that we have seen, and the further likely connection between compressibility and magnetic dissipation, the quality of coupling may be self-regulated in some fashion.
The effects of diffusion on density contrasts in the turbulence are summarized in figure 12. Contrasts are large in calculations with magnetic pressure greater than effective pressure. The standard-opacity radiation runs with net vertical flux, shown by small filled circles, are plotted using gas pressure for effective pressure in all cases. However, in those with the stronger magnetic fields, longer MRI wavelengths mean that radiation is more tightly tied to the turbulence. The correct effective pressure is intermediate between the gas and total pressures. If effective pressure is as large as total pressure, the case with strongest magnetic field is shifted 2.9 decades to the left. Cases with weaker fields have weaker gas–radiation coupling, and are to be shifted smaller distances to the left. Also plotted are results from calculations by TSS, listed in their table 2. Together, the data indicate density contrasts can be as great as the ratio of magnetic to gas pressure provided radiation is not well-coupled to gas. In the axisymmetric calculations by TSS, the magnetic field geometry in the transient turbulence is controlled by the initial condition. At a fixed magnetic pressure, fields more nearly aligned with the azimuthal direction result in fluctuations with shorter vertical wavelengths. Weaker coupling of radiation to gas over these smaller scales means smaller effective pressures, so that magnetic forces produce greater compression. In the three-dimensional calculations, the field geometry is determined by the action of the turbulence. The field is found to be more inclined from the azimuthal than in the fiducial case of TSS, resulting in smaller density ranges at similar magnetic pressures. Density contrasts greater than twenty are demonstrated here in long-lasting, three-dimensional turbulence.

7 SUMMARY AND CONCLUSIONS
We carried out three-dimensional MHD calculations of local patches of a radiation-dominated accretion disk. The vertical component of gravity was neglected, and periodic boundaries were used in the vertical direction. Magneto-rotational instability led to magnetized turbulence in which Maxwell stresses transported angular momentum outwards. A number of basic differences between results with and without radiation are caused by the diffusion of photons with respect to the material. When opacity is high enough that radiation is locked to gas over the length and time scales of fluctuations in the turbulence, the accretion stress, density contrast, and dissipation differ little from those in the corresponding calculations with radiation replaced by extra gas pressure. However, when radiation diffuses each orbit a distance that is comparable to the RMS vertical MRI wavelength, radiation pressure is less effective in resisting squeezing. Larger density fluctuations occur, and a non-linear version of the radiation damping mechanism outlined by Agol & Krolik (1998) converts work into photon energy.
The accretion stress is found to depend on the vertical magnetic flux present. If the net vertical field is large enough so the corresponding MRI wavelength is at least the domain height, the time-averaged stresses are similar whether photons and gas are strongly or marginally coupled. If there is no net vertical magnetic flux, the field strength depends on the opacity, and is greater when gas and radiation are dynamically well-coupled. Over a wide range of field strengths, the ratio of accretion stress to vertical magnetic pressure is near the value required in radiation-supported Shakura-Sunyaev models to make the vertical MRI wavelength equal to the distance that photons diffuse per orbit. These results indicate photons may be marginally coupled to turbulent eddies in Shakura-Sunyaev disks accreting via internal magnetic stresses. Our work is not the first indicating magnetic stress may scale with gas pressure alone, rather than total pressure. However, previous suggestions were made either on the basis of an ad hoc search for ways to cure instabilities besetting conventional disk models (Sakimoto & Coroniti, 1981; Taam & Lin, 1984) or on the basis of a limitation to the magnetic field strength placed by buoyancy (Stella & Rosner, 1984; Sakimoto & Coroniti, 1989). The new point here is that the inability of the magnetic field strength to track the total pressure is due to photon diffusion effects.
Density contrasts greater than an order of magnitude are observed in cases where magnetic pressure exceeds gas pressure, and photons partly decouple from the gas. Such large density variations may alter the bulk radiation transport rate, the effective optical depth, and the spectrum emerging from the disk photosphere. The density fluctuations involve repeated compression and expansion of fluid elements. Diffusion of photons from compressed regions converts up to one quarter of the released gravitational energy to radiation energy.
In the simulations discussed here, the heating results in secular increases in radiation pressure, as the disk surface is omitted and there is no means for cooling the flow. Stationary disk structures might be found using calculations including radiation losses. An accurate balance between heating and cooling can be obtained in such calculations only if total energy is conserved. In unstratified calculations using a standard internal energy scheme, the majority of the released energy disappears through numerical losses of magnetic field. In calculations conserving total energy during the magnetic substep, approximate overall energy conservation is observed. Such a partial total energy scheme may be adequate for use in calculations of disk vertical structure. It is likely that the rates at which disks heat and cool depend on the disk thickness. Calculations in which the thickness is allowed to vary may be useful in addressing the question of the thermal stability of radiation-dominated disks.
References
- Agol & Krolik (1998) Agol, E., & Krolik, J. 1998, ApJ, 507, 304
- Balbus & Hawley (1991) Balbus, S. A., & Hawley, J. F. 1991, ApJ, 376, 214
- Balbus & Hawley (1998) Balbus, S. A., & Hawley, J. F. 1998, Rev. Mod. Phys. 70, 1
- Bisnovatyi-Kogan & Blinnikov (1977) Bisnovatyi-Kogan, G. S., & Blinnikov, S. I. 1977, A&A, 59, 111
- Blaes & Balbus (1994) Blaes, O. M., & Balbus, S. A. 1994, ApJ, 421, 163
- Blaes & Socrates (2001) Blaes, O. M., & Socrates, A. 2001, ApJ, 553, 987
- Blandford & Payne (1982) Blandford, R. D., & Payne, D. G. 1982, MNRAS, 199, 883
- Brio & Wu (1988) Brio, M., & Wu, C. C. 1988, JCP, 75, 400
- Hawley, Gammie, & Balbus (1995) Hawley, J. F., Gammie, C. F., & Balbus, S. A. 1995, ApJ, 440, 742
- Hawley, Gammie, & Balbus (1996) Hawley, J. F., Gammie, C. F., & Balbus, S. A. 1996, ApJ, 464, 690
- Hawley & Stone (1995) Hawley, J. F., & Stone, J. M. 1995, Computer Physics Communications, 89, 127
- Kim & Ostriker (2000) Kim, W.-T., & Ostriker, E. C. 2000, ApJ, 540, 372
- Levermore & Pomraning (1981) Levermore, C. D., & Pomraning, G. C. 1981, ApJ, 248, 321
- Lightman & Eardley (1974) Lightman, A. P., & Eardley, D. M. 1974, ApJ, 187, L1
- Mihalas & Mihalas (1984) Mihalas, D., & Mihalas, B. W. 1984, Foundations of Radiation Hydrodynamics (Oxford: Oxford Univ. Press)
- Miller & Stone (2000) Miller, K. A., & Stone, J. M. 2000, ApJ, 534, 398
- Sakimoto & Coroniti (1981) Sakimoto, P. J., & Coroniti, F. V. 1981, ApJ, 247, 19
- Sakimoto & Coroniti (1989) Sakimoto, P. J., & Coroniti, F. V. 1989, ApJ, 342, 49
- Sano (1998) Sano, T. 1998, Ph.D. thesis, Univ. of Tokyo
- Sano & Inutsuka (2001) Sano, T., & Inutsuka, S. 2001, ApJ, 561, L179
- Shakura & Sunyaev (1973) Shakura, N. I., & Sunyaev, R. A. 1973, A&A, 24, 337
- Shakura & Sunyaev (1976) Shakura, N. I., & Sunyaev, R. A. 1976, MNRAS, 175, 613
- Stella & Rosner (1984) Stella, L., & Rosner, R. 1984, ApJ, 277, 312
- Stone & Norman (1992a) Stone, J. M., & Norman, M. L. 1992a, ApJS, 80, 753
- Stone & Norman (1992b) Stone, J. M., & Norman, M. L. 1992b, ApJS, 80, 791
- Stone, Mihalas, & Norman (1992) Stone, J. M., Mihalas, D., & Norman, M. L. 1992, ApJS, 80, 819
- Svensson & Zdziarski (1994) Svensson, R., & Zdziarski, A. A. 1994, ApJ, 436, 599
- Taam & Lin (1984) Taam, R., & Lin, D. N. C. 1984, ApJ, 287, 761
- Turner & Stone (2001) Turner, N. J., & Stone, J. M. 2001, ApJS, 135, 95
- Turner, Stone, & Sano (2002) Turner, N. J., Stone, J. M., & Sano T. 2002, ApJ, 566, 148
- von Neumann & Richtmyer (1950) von Neumann, J., & Richtmyer, R. D. 1950, J. Appl. Phys., 21, 232