Faster Background Determination
- a method for gaining time coverage and
flux measurement accuracy with Cherenkov telescopes
Abstract
An improved way of taking off-source data for background determination in Cherenkov telescope observations is proposed. Generalizing the traditional concept of taking on-source/off-source observations of equal duration (e.g. 30 minutes ON followed by 30 minutes OFF), Faster Background Determination (FBD) permits an off-source observation with the same zenith angle distribution as the on-source observation to be obtained within less time. The method permits the on-source observation time to be maximized without compromising the quality of the background determination. It also increases the signal significance for strong sources. The only modification necessary in the data acquisition is a small change to the tracking algorithm. The only modification necessary in the data analysis is to introduce a time normalization which does not increase the systematic errors. The method could become the normal observing mode for Cherenkov telescopes when observing strong sources.
1 Introduction
Since their first successful application in the late 1980s [9], Imaging Atmospheric Cherenkov Telescopes (CTs) have developed rapidly from pioneer instruments to precision observatories for high-energy gamma radiation with a large user community. With four major new observatories under construction (CANGAROO III [7], HESS [5], MAGIC [6], VERITAS [10]), it is justified to revisit and optimise the standard CT data taking methods in terms of achieving the best possible scientific output given the limited observation time.
CTs can only observe at night (ideally moonless) and during good weather conditions. These constraints typically lead to a total yearly observation time for any one observatory site of roughly 1000 hours. Within this time, the observer must perform two tasks: the observation of the (known or suspected) gamma-ray source (“on-source” observation) and an auxiliary “off-source” observation to determine the background caused by hadronic cosmic rays contained in the on-source observation. Different schemes have been developed to perform the “off-source” observations. They are described in section 2. All schemes have in common that they either achieve less than optimal sensitivity or occupy a large fraction of the total observation time, roughly 50 %, which reduces the telescope’s ability to follow the light curves of rapidly variable sources.
In this article, I propose a new method to obtain off-source observations sacrificing a smaller fraction of the total observation time and avoiding increased systematic uncertainties. Section 2 summarizes the presently used background determination methods, section 3 describes the new method and section 4 discusses advantages and applications.
2 Traditional background determination
In order to better describe the advantages of the proposed new background measurement method, the methods which have been used so far are briefly summarized here.
There are essentially two traditional ways of obtaining an estimate of the number of background events in data from gamma-ray source observations with Cherenkov telescopes: true ON/OFF observations and separately taken OFF data.
2.1 ON/OFF observations
This was the first method ever employed in imaging atmospheric Cherenkov observations [9]. The background is determined by performing a second observation immediately before or after the on-source observation (“ON run”). This second observation, the “OFF run”, has the same duration as the ON run and is made on a celestial position which is the same as the on-source position except that the Right Ascension is shifted by the duration of the ON-run increased by the slewing time.
The method achieves a perfect matching of the zenith angle distributions in ON and OFF run. Also the atmospheric conditions are nearly perfectly matched since the the runs are taken nearly at the same time. The only difference between ON and OFF run are (mostly small) variations in the star field and hence the night sky background noise. This is to a large extent eliminated by software padding, a method which uses added noise from a software random generator to equalize the noise conditions between ON and OFF [4]. Field rotation spreads the star field differences over the field of view in the course of observations.
Given an observation time (duration of one of the runs) , a gamma event rate and a background rate (after trigger or arbitrary gamma-hadron separation), the significance of the event excess caused by the gamma-ray source in the on-source position is
In order to obtain the off-source observations, 50 % of the theoretically available on-source observation time has to be sacrificed. Since some OFF data can be taken while the source under investigation is below the minimum elevation for useful observations, the reduction in on-source observation time for that particular source may be somewhat less than 50%. But in any case, determining the hadronic background using ON/OFF observations decreases the total available observation time by 50%. Furthermore, it introduces large gaps in the time coverage thereby hampering variability studies.
2.2 Separately taken OFF data
Since the hadronic background is known to be isotropic and time-independent (to a good approximation at energies above several 10 GeV), it is in principle possible to measure the background by taking the OFF run long before or long after the ON run is taken. Also, to decrease the statistical error of the background measurement, more than one OFF run can be used. If the analysis is not testing for the presence of a new (weak) source, the same OFF run can also be used several times for different ON data. Hence, less than 50% of the total observation time has to be sacrificed for OFF data.
If a given observatory were to create a library of OFF source runs on a grid of all different declinations and zenith angles of interest, it could in principle - after the completion of the library - stop taking OFF data and re-use the data in the library for all future analysis (for new source discoveries, new OFF data may have to be taken for statistical reasons).
In reality, however, modifications and aging of the telescope hardware and the ever-changing general atmospheric conditions cause changes in the characteristics of the data which make an off-source data library obsolete within a few years - roughly the same time than it takes to compile the library.
In case the time coverage for a particular source is to be increased, exactly matching OFF data can theoretically be taken at a different time by observing at exactly the same Declination and zenith angle. This means sacrificing observation time of other sources and has the additional drawback that, due to the fact that the atmospheric conditions change on a timescale of a few hours, it is never possible to reach the near-perfect matching of the atmospheric conditions obtained in true ON/OFF observations.
To correct for the differences in atmospheric conditions between ON data and separately taken OFF data, one can use the fraction of the data at large ALPHA values (which certainly does not come from the source direction) to normalize the background rate .111There are different names and prescriptions for this method, but all of them are equivalent. This can be done in an integral way for the whole gamma signal (e.g. [2] and references therein, [3]) or separately for different gamma energy ranges when a spectrum has to be derived (with or without assuming a correlation between the bins [8]). In both cases, larger systematic errors on the integral flux or spectral parameters respectively are the price for not taking true ON/OFF data.
2.3 “Wobble mode”
If the diameter of the CT’s field of view exceeds , on-source and off-source observations can be taken at the same time by observing the known or suspected source position off-axis by and deriving the background from the analysis of events coming from the mirror position in the other half of the camera. This so-called “wobble mode” (see e.g. [1]) gives maximum time coverage but reduces the effective collection area for gamma-rays by truncating part of the field of view where the air-shower images from the source direction are expected. It also shifts the images of the shower maxima of the events of interest into a region of the field of view which has worse optical properties leading to a deterioration in the gamma-hadron separation.
The truncation effects become negligible when a camera with a field of view larger than becomes available. Equipping telescopes with such large cameras, however, is often financially impossible.
In any case, the mirror position in the other half of the field of view does not provide the exact same zenith angle distribution as the on-source position leading to additional systematic errors in spectra. One way to compensate for this, at least approximately, is to alternate the angle by which the source position is shifted off-axis between e.g. and .
3 The new method
3.1 Description
The new background determination method proposed here is a generalized version of the traditional ON/OFF observations described above. Instead of having ON and OFF runs of equal duration, the observer chooses two parameters: the total duration of the two runs together and the fraction of which is used for the OFF observation. The ON observation time is then
| (1) |
while the OFF observation time is
| (2) |
The ON observation is then performed with duration as usual. The OFF observation, however, since it has in the general case a duration different from the ON observation, has to be performed at a different tracking speed in order to cover the same zenith angle range. The tracking speed is scaled by the ratio of the run durations where
| (3) |
The correction of the tracking speed can simply be achieved by substituting the absolute time in the tracking calculations by a modified absolute time given by
| (4) |
where is the (unmodified) absolute time at the beginning of the OFF run.
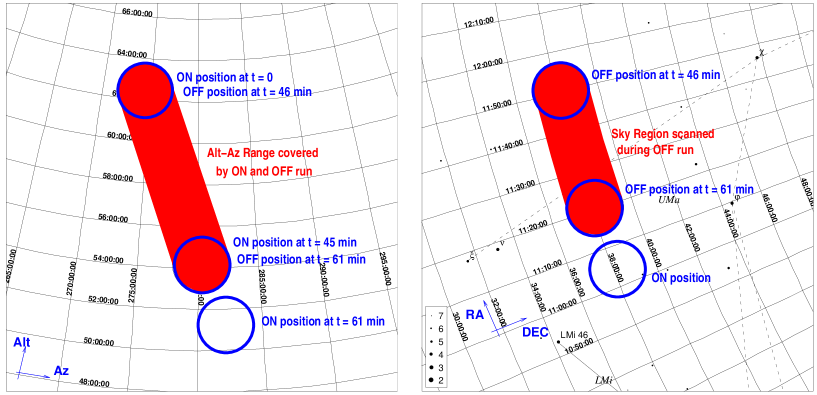
This substitution has the effect that if , the tracking speed is faster () or slower () than normal. For example, if is chosen to be and minutes, then minutes, minutes and . In this case, the telescope would be tracking three times faster during the OFF run. Figure 1 illustrates this example.
The RA/DEC coordinates used for the OFF run are the same as for the traditional ON/OFF case. If is chosen to be , the observation is a traditional ON/OFF observation.
Given the number of events after arbitrary analysis stages for the ON and OFF run, and , the number of excess events (“gammas”) is calculated as
| (5) |
and the significance of this signal is
| (6) |
The error of is negligible since it is implemented by a comparatively very accurate time measurement.
As will be shown further below, should always be chosen to be . The modified time is therefore always faster than normal time. Hence the new method is named Faster Background Determination (FBD).
Note that the fact that the telescope is not tracking a fixed point in the sky during the OFF run (because it is moving faster than the Earth’s rotation) does not compromise the data quality. Field rotation leads to a changing starfield configuration anyway, also for the traditional ON/OFF case. A superimposed drift of the starfield (a few degrees within 15 minutes in the typical case) will not change this situation222Modern approaches to dealing with bright stars in the field of view either take the affected photomultiplier tubes out of the trigger logic or lower the high voltage on them but do not switch them off. This happens in a computer-controlled, reproducible fashion. Therefore there is no additional new precaution necessary to deal with a drifting starfield as opposed to a purely rotating one. The drift of the OFF starfield leads to an increase of the probability of having a bright star in the field of view by about a factor up to 3. See the discussion in section 4..
Depending on the angular diameter of the part of the telescope’s field of view from which gamma-like shower images are accepted in the data analysis, a minimum OFF run duration has to be required to avoid overlap of the ON and OFF regions. The minimum duration is given by
| (7) |
where is the Declination of the ON source position. For a typical CT with , would be 9.6 min, i.e. between 9.6 min and 15 min for .
3.2 Optimization
The new method (FBD) has two parameters which have to be chosen by the observer: total observation time for one ON/OFF run pair and the time fraction used for the OFF run.
The choice of is dictated by practical considerations, the timescale of changes in the atmospheric conditions and the field of view of the camera (Equation 7).

The optimal choice of is obviously independent of , but it depends - as it turns out - on the intensity of the gamma-ray source. In order to see this, Equation 6 for the significance of the gamma signal is rewritten substituting
where is the gamma event rate and is the background event rate. This gives
| (8) |
Choosing example values for , and , the significance can be plotted versus in order to investigate the dependence. This was done in Figure 2 for with and .
The remarkable result which becomes visible in Figure 2 is that as the signal to background ratio increases, the position of the maximum in the significance curve decreases.

The value for which the maximum significance is obtained, can be analytically calculated by determining the zeros of the derivative d/d:
| (9) |
This is essentially a quadratic equation in f. One finds that one of the zeros is always negative and therefore not physical in this context. The remaining zero is
| (10) | |||||
| (11) |
where is the signal/background ratio (not signal/noise!) as above. Figure 3 shows as a function of . The figure and Equation 11 show an interesting property of the FBD scheme:
For each observation, there is a single optimal value of which depends only on the ratio of the gamma event rate and the background event rate. This value is always less than 0.5 but approaches 0.5 asymptotically with decreasing .
In other words, the traditional value is only optimal for weak gamma sources. For stronger sources like the Blazar Mkn 421 during a flare, one obtains a more significant signal if one devotes more time to the ON than to the OFF observation, i.e. chooses .
4 Discussion
The Faster Background Determination method will bring three major advantages:
-
1.
Increased time coverage without increased systematic errors in the determination of flux and spectrum compared to normal ON/OFF observations.
-
2.
Reduction of systematic errors and simplification of data analysis compared to methods using separately taken OFF data.
-
3.
Moderate improvement of the statistical accuracy of flux and spectral measurements since the significance of the gamma signals is maximized for a given total observation time.
The most important are points 1 and 2.
Concerning point 3, one can show that the maximum possible increase in significance when using FBD instead of normal ON/OFF observations is only dependent on the signal to background ratio and is described by the following formula:
| (12) |
where is the significance obtained by making an ON/OFF observation in FBD mode using the optimal OFF time fraction (Equation 11) and is the significance when the OFF time fraction is used instead (normal ON/OFF run).

Figure 4 shows the ratio described by Equation 12. It is always larger than unity, i.e. FBD is always better than normal ON/OFF if the optimal OFF time fraction is used.
| Traditional ON/OFF | Separate OFF | Wobble∗ | FBD | |
| Max. possible | 60% | 100% | 100% | 80% |
| one-source time | ||||
| coverage | ||||
| Max. possible | 50% | 66% | 100% | 80% |
| all-source time | ||||
| coverage | ||||
| Statistical Errors | standard | smaller | smaller | smaller |
| for same overall | by 30 % | by 30 % | by 15 % | |
| obs. time | ||||
| Systematic Errors | minimal | larger | larger | minimal |
| Application | precision | new source | new source | precision |
| measurements | search | search, | measurements | |
| of weak sources | multi- | any source strength, | ||
| campaigns | multi- campaigns |
∗only possible if diameter of camera field of view included in trigger
Of course, for unknown sources, the signal to background ratio is unknown and hence cannot be determined. However, as one can see from Figure 2, the maxima of the significance curves are broad and an approximate value for already gives good results. This also means that using FBD, the time coverage can be increased significantly in exchange for only a small decrease in sensitivity.
Generally, when in discovery mode where accuracy of flux measurements is not the primary concern, observations with separately taken OFF data or wobble mode observations may be an equally good way to find a new source. But as soon as the presence of the source is established and accurate flux and spectral measurements are of interest, FBD is the method of choice.
Due to the increase in the sky area covered by the OFF observation using FBD, the likelihood that bright stars occur in the OFF region increases by a factor up to 3 depending on the choice of the OFF run time fraction . Figure 1 already shows the mildly extreme case with . Near the galactic plane, CTs have traditionally had problems with their background determination due to the presence of many bright stars. The FBD method will only slightly worsen an already difficult problem. CTs have to work with low photomultiplier gain and the above mentioned dynamical lowering of high voltage values and modification of the trigger map to make progress here.
The value of the signal to background ratio depends on the gamma-hadron separation capability of the telescope and the state of the source. FBD seems to be particularly helpful for the observation of Blazars because (a) they reach the highest values of , (b) they have unproblematic starfields surrounding them as most of them are sufficiently far away from the galactic plane, and (c) due to their variability, time-coverage is of interest. The observation schedules of all CT observatories have always made a special effort to dedicate large fractions of the observation time to flaring Blazars. For example, in 1997, when Mkn 501 showed an unprecedented flaring state of several months duration, observatories were dedicating more than 50 % of the available time to this source.
Finally, for very much the same reasons that FBD is beneficial for Blazar observations, it will also be beneficial for gamma-ray burst follow-up. Choosing very low (possibly as low as ), it will be possible to maximize the on-source time without compromising the quality of the background determination.
Table 1 summarizes the properties of FBD and the traditional background determination methods.
References
- [1] Aharonian, F., et al., 1999, A&A, 342, 69
- [2] Aharonian, F., et al., 1999, A&A, 349, 29
- [3] Catanese, M., et al., 1998, ApJ, 501, 616
- [4] Cawley, M. F., 1993, in Lamb, R.C. (ed.) “Towards a Major Cherenkov Detector II (Calgary, Canada)”, 176
- [5] Hofmann, W., et al., 2001, Proc. 27th ICRC (Hamburg), OG 2.05, 2785
- [6] Lorenz, E., et al., 2001, Proc. 27th ICRC (Hamburg), OG 2.05, 2789
- [7] Mori, M., et al, 2001, Proc. 27th ICRC (Hamburg), OG 2.05, 2831
- [8] Petry, D., et al., 2002, ApJ, 580, 104
- [9] Weekes, T.C., et al., 1989, ApJ, 342, 379
- [10] Weekes, T.C., et al., 2002, Astropart. Phys., 17, 221