11email: jrossa@stsci.edu, dettmar@astro.ruhr-uni-bochum.de 22institutetext: Space Telescope Science Institute, 3700 San Martin Drive, Baltimore, MD 21218, U.S.A. (present address)
An H survey aiming at the detection of extraplanar diffuse ionized gas in halos of edge–on spiral galaxies ††thanks: Based on observations collected at the European Southern Observatory, Chile (ESO No. 63.N–0070, ESO No. 64.N–0034, ESO No. 65.N.–0002).
In a series of two papers we present results of a new H imaging survey, aiming at the detection of extraplanar diffuse ionized gas in halos of late–type spiral galaxies. We have investigated a sample of 74 nearby edge–on spirals, covering the northern and southern hemisphere. In 30 galaxies we detected extraplanar diffuse emission at mean distances of kpc. Individual filaments can be traced out to kpc in a few cases. We find a good correlation between the FIR flux ratio () and the SFR per unit area (), based on the detections/non–detections. This is actually valid for starburst, normal and for quiescent galaxies. A minimal SFR per unit area for the lowest values, at which extended emission has been detected, was derived, which amounts to . There are galaxies where extraplanar emission was detected at smaller values of , however, only in combination with a significantly enhanced dust temperature. The results corroborate the general view that the gaseous halos are a direct consequence of SF activity in the underlying galactic disk.
Key Words.:
galaxies: halos – galaxies: spiral – galaxies: starburst – galaxies: ISM – galaxies: structure1 Introduction
In recent years observations revealed the presence of an extraplanar diffuse ionized gas (eDIG) layer (e.g., Rand 1996; Rossa & Dettmar 2000) in a few late–type spiral galaxies, similar to the Reynolds layer in the Milky Way (e.g., Reynolds et al. 1999). The occurrence of such a layer in a galaxy is most likely a direct consequence of the strength of SF activity in the disk of each individual galaxy. The strength of SF activity both on local and global scales plays an important role. It was already assumed in previous studies that the star formation activity in the disk of spiral galaxies is correlated with the presence of DIG and its extent in the halos of these galaxies.
Current models, trying to explain the gas and energy transport from the disk into the halo, have been developed over a decade ago (e.g., Norman & Ikeuchi 1989) where the gas from the disk emanates into the halo, the so called chimney phenomenon, driven by collective SNe. A few theoretical concepts for outflow phenomena besides chimneys have been established as well, such as galactic fountains (e.g., Shapiro & Field 1976; Bregman 1980), or the superbubble outbreak scenario (Mac Low & McCray 1988). Observations have confirmed a disk–halo connection. This was successfully demonstrated for several edge–on spirals (e.g., Dettmar 1990; Rand et al. 1990; Pildis et al. 1994; Rand 1996; Rossa & Dettmar 2000).
The models can explain some of the observed outflow phenomena of the interstellar gas, but they are far away from giving a coherent picture of the whole situation. As it is argued by Lehnert & Heckman (1996) many starburst galaxies follow the condition of a superwind, which drives the outbraking gas from bubbles into the halo. The theory of such a superwind was developed in the mid eighties (Chevalier & Clegg 1985). Recent studies of actively star–forming regions in edge–on galaxies gave evidence for a superwind (for a recent review see Heckman 2001), such as in the case of NGC 4666 (Dahlem et al. 1997). Similar conditions apply for M 82 and NGC 4631 (Bland & Tully 1988), and for NGC 3079 (Cecil et al. 2002). It is, however, currently unclear whether it is also a superwind that causes outflows in galaxies with much lower SF activity.
Most of the recent studies focused on the different morphology of the DIG (e.g., plumes, filaments, loops) in order to describe the overall distribution and structure in halos, for example the spectacular filaments of the nearby galaxy NGC 55 (Ferguson et al. 1996). Only one recent study addressed the correlation with global properties from a larger sample of objects. However, this study (Lehnert & Heckman 1995, hereafter LH95) selected only measures such as the IR–luminosity as the primary selection criterion, but this can be biased by strong local star–forming activity. Therefore, their sample is strongly biased against low luminosity galaxies which are not covered at all.
It is therefore important to consider selection criteria in addition to the IR properties. To study an unbiased sample (in the sense of FIR emission), it is essential to deal with a distribution of IR–luminosities, containing galaxies with low and high values of the IR–fluxes, rather than selecting only IR bright galaxies, in order to find the division between those galaxies showing outflows, and those which do not bear any signs of disk–halo interaction at all. Furthermore, it could be important to make use of a sample which includes also different galaxy types in the sense of evolution, covering early–type spirals (Sa) as well as late–type spirals (Sc). Since there are indications for DIG in early–type spirals (cf. Dettmar 1992), this aspect has to be investigated, too. Indeed, there were a few cases where strong star formation has been found among some early–type face–on spirals (e.g., Hameed & Devereux 1999).
In an approach to study the star–forming activity, which is traced by the diffuse ionized gas (DIG), we have defined specific selection criteria concerning the sample of our program galaxies. For this reason we have observed a large sample of galaxies, comprising edge–on spiral galaxies with very different FIR luminosities and different Hubble types. Since the SFR is correlated with the FIR luminosity, we will try to trace the fainter end of the FIR luminosity distribution, to find the division between galaxies with high star formation activity (e.g., starbursts) and galaxies with low star formation activity (non–starbursts) via the detection/non–detection of star–formation–driven outflows. By clearly showing non–detections (at the level of our sensitivity limit) of any DIG features in the less active galaxies of this sample, we will be able to derive the minimal SFR per unit area which is necessary to lead to such outflows. This is important for the understanding of the physics of the interstellar medium and for the evolution of galaxies, since this process is closely related to mass loss and chemical evolution. Finally, these observations can be compared with recent theoretical models, such as the superbubble outbreak scenario (Mac Low & Ferrara 1999).
Some of the basic questions we want to address in this investigation are the following: How common are galactic gaseous halos and what is the morphology of eDIG? What properties (parameters) determine the presence of galactic outflows? Is there a minimal SFR per unit area, at which gaseous outflows can be detected?
2 H survey selection criteria
The diffuse ionized gas (DIG), frequently also called WIM (warm ionized medium) is best traced by the relatively bright H emission. From a first sub–sample, which was discussed in detail in Rossa & Dettmar (2000), it became clear that there is a need for a larger sample in order to quantify the observed outflows (i.e. to derive a measure for the minimal SF activity per unit area), and to have a large sample for good statistical information as well. Whereas FIR bright galaxies have already been studied in detail in the context of disk–halo interaction (Lehnert & Heckman 1995, 1996), there was a need for studying a broader distribution in FIR flux coverage. The target galaxies for our unbiased (in the sense of SF activity) H survey have been selected primarily by the broad coverage of the FIR luminosity (for those with high and those with low FIR luminosities) and the edge–on character of the galaxies, where the halo separates from the disk very well in projection. Moreover, the selected galaxies should not be too large, in order to fit into the field of view (FOV) of the used instruments and to avoid assembling a mosaic from several sub–frames, which would be time consuming. This constraint applies to almost all of our target galaxies. On the other hand the galaxies should not be too small, so that the possible DIG features cannot be resolved. Therefore, a minimum apparent diameter of was chosen, to make an useful investigation. To study any DIG features in the halos, the galaxies should be almost edge–on. We chose a minimum inclination angle of , determined by the galaxy axial ratios (see below). The selection of the final target galaxies was based on the RC3 catalog (de Vaucouleurs et al. 1991), and also on the Flat Galaxy Catalogue (FGC), published by Karachentsev et al. (1993). To see, whether or in how far companion galaxies may trigger active star formation, we have included in our sample some edge–on galaxies with associated companions (also taken from the above mentioned catalogs), to study this aspect, too. The observations for this survey have been divided into three individual observing runs on the southern hemisphere, and two on the northern hemisphere, to cover the complete R.A. interval and to have an even more homogeneous sample.
The final selection criteria for our H survey are shortly summarized below
-
•
spiral galaxies
-
•
unbiased galaxy sample with respect to the FIR flux
-
•
broad coverage of SF activity
-
•
(majority has )
-
•
-
•
-
•
availability of the desired H filters according to redshifts of the galaxies
The observations for the northern hemisphere galaxies have been performed with CAFOS111Calar Alto Faint Object Spectrograph in direct imaging mode, attached to the CAHA 2.2 m telescope (Spain). The southern hemisphere galaxies have been observed with DFOSC222Danish Faint Object Spectrograph Camera in imaging mode, attached to the Danish 1.54 m telescope at La Silla/Chile. More observational details are presented in our second paper, which gives the full details on each individual galaxy (Rossa & Dettmar 2003).
All the galaxies, which did fit the above mentioned selection criteria, were first inspected visually on the basis of the Digitized Sky Survey (DSS). Initially, about 200 galaxies were regarded as suitable candidates for our investigation. However, further constraints did arise. In several cases bright foreground stars, that were projected onto the galaxy disk, have been detected on the DSS images. Those galaxies have been rejected, since bright stars will cause artifacts which make it difficult to locate DIG. Furthermore, galaxies in compact groups have been rejected as well, since close galaxy pairs may also trigger outflows through interactions. However, we did include wide pairs of galaxies in a few cases. A certain fraction of the galaxies that were in our initial list have already been observed by other investigators (e.g., Pildis et al. 1994; Lehnert & Heckman 1995; Rand 1996; Hoopes et al. 1999). Except in a very few cases (for comparison with our sensitivities) we did refrain from re–observing these galaxies. Moreover, several galaxies have been dropped from our list, since their redshifts were in conflict with the wavelength coverage of the available H filters.
Finally, about 120 galaxies did fulfill all of our selection criteria. We observed 65 of these galaxies, given the object visibility at our various scheduled observing runs. Adding the nine observed galaxies from our recent study (Rossa & Dettmar 2000), our survey consists of 74 galaxies in total. Although this is the largest H survey to date investigating DIG in edge–on galaxies, it should be mentioned that it is not a statistically complete sample. Nevertheless, we have carefully selected our galaxies, to study the fainter end of the FIR luminosity distribution. In fact, 12 of our galaxies have not been detected with IRAS in the FIR. We therefore do have a sufficiently high fraction of galaxies, with very low FIR–fluxes, which populate the faint end of the FIR–distribution, in which we were interested in.
3 Results
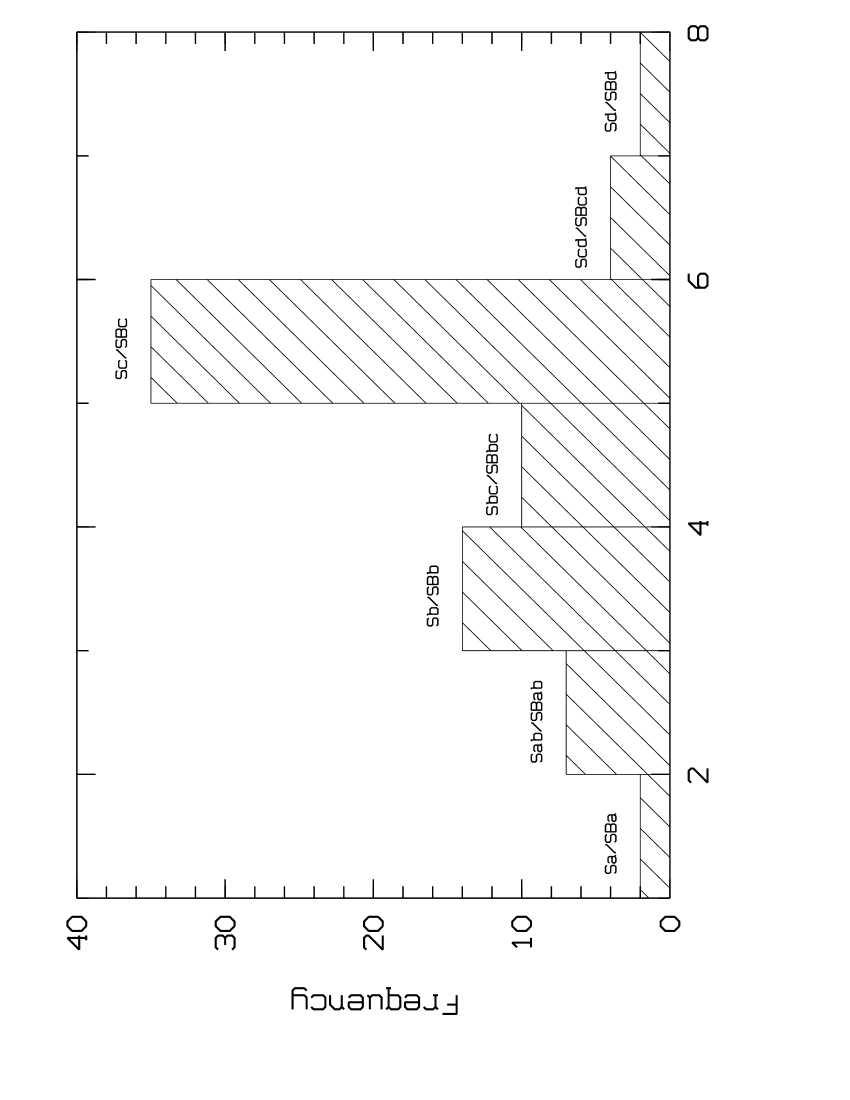
In the following we present some important properties of the survey galaxies. In Fig. 1 we have plotted a histogram showing the distribution of the galaxy types of our survey galaxies. It is evident from this plot that the early–type spirals are underrepresented, as we gave more weight to the late–type spirals.
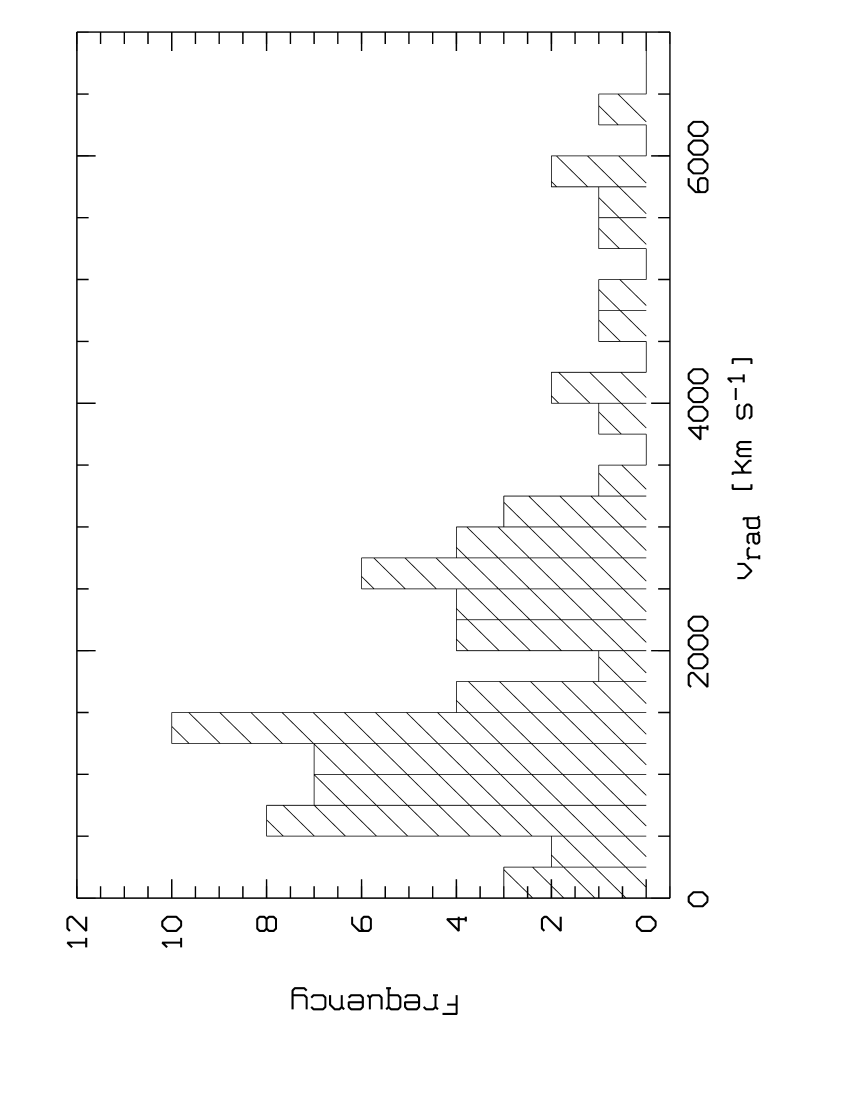
The distribution of the radial velocities of the survey galaxies is shown in Fig. 2. Most of the survey galaxies have velocities of less than . The inclinations of the galaxies have been determined using the following formula (Hubble 1926)
| (1) |
where denotes the axial ratio of the galaxy, and is an intrinsic flattening parameter of the ellipsoid representing the galaxy. A value of =0.20 has been derived by Holmberg (1946), which is often adopted.
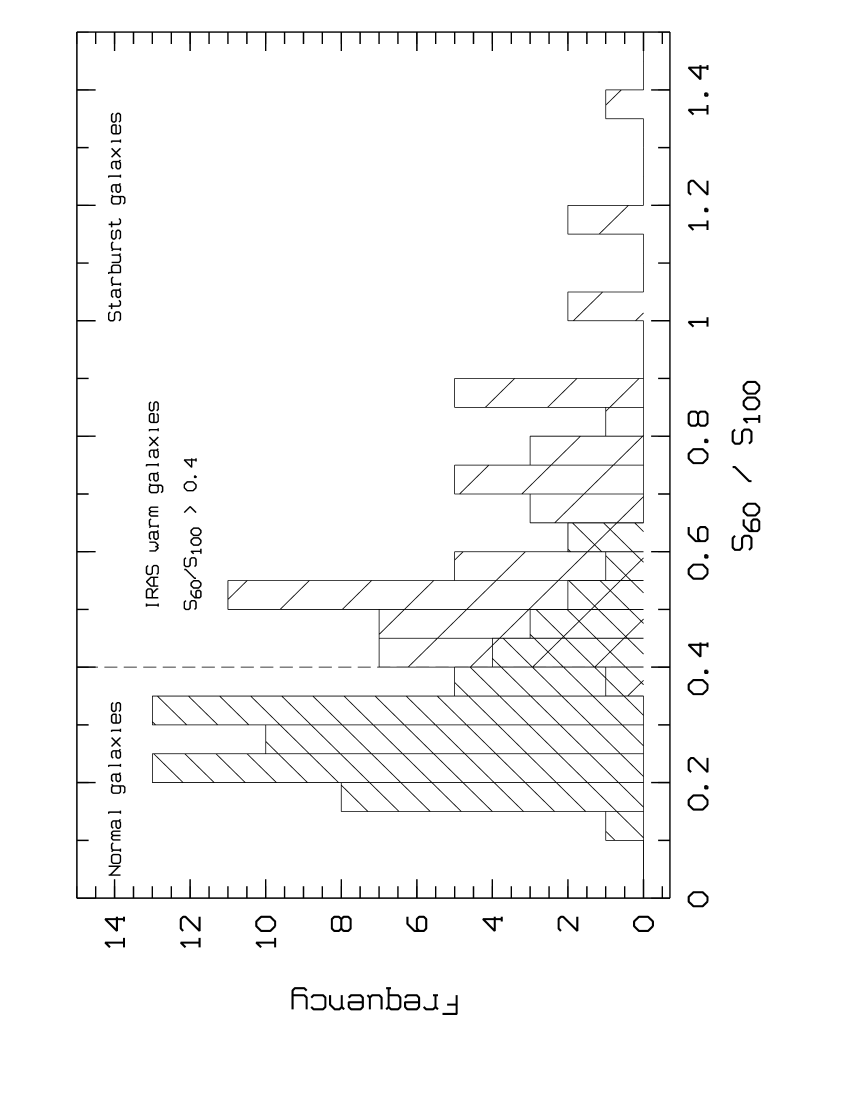
In Fig. 3 we present a histogram of the distribution of the FIR flux ratio () for the 62 IRAS detected survey galaxies, as well as for the LH95 starburst sample, clearly showing the parameter space covered in the LH95 study (), and our survey galaxies peaking at values of 0.2–0.35.
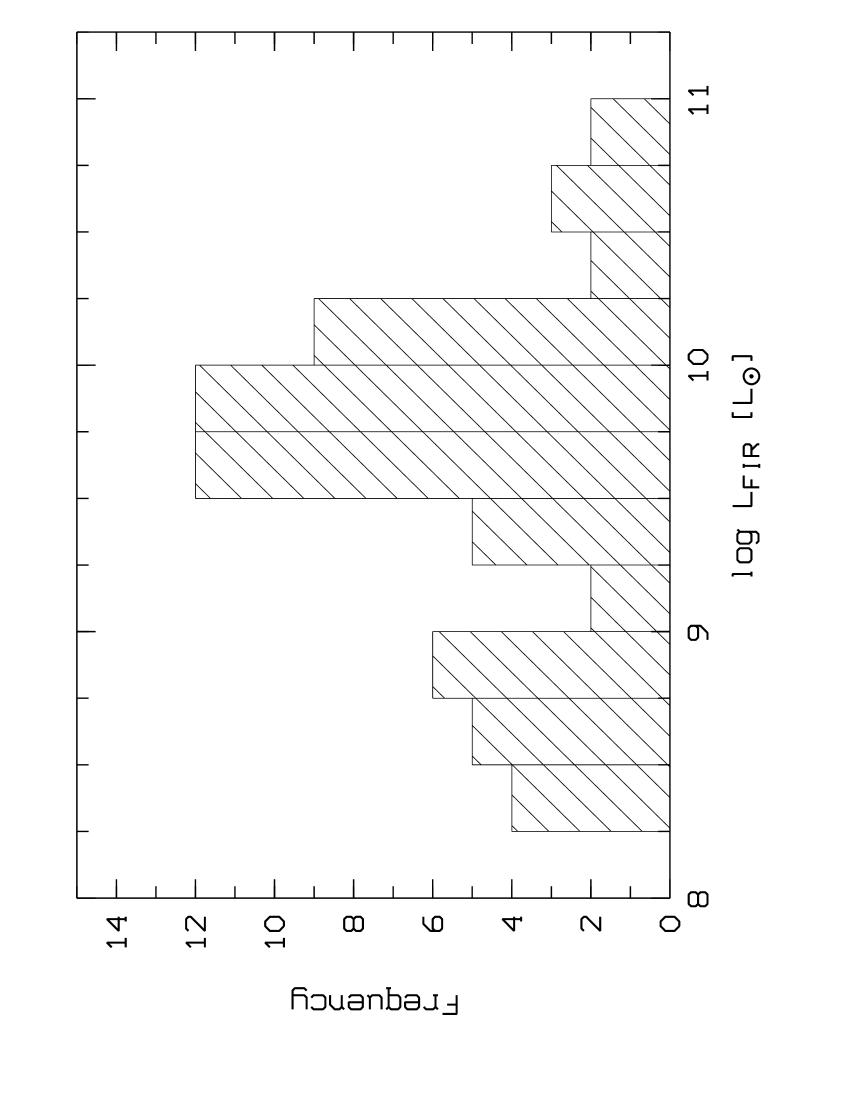
In Fig. 4 we have plotted the distribution of the FIR luminosity of the 62 IRAS detected survey galaxies, logarithmically in units of solar luminosities, ranging from a few to . The FIR luminosities have been calculated according to (Lonsdale et al. 1989)
| (2) |
where is the distance to the galaxy in Mpc, and are the FIR flux densities in Jansky at 60m and 100m, respectively.
4 Physical properties of the survey galaxies
4.1 Diagnostic DIG diagrams
In Fig. 5. we have plotted the Diagnostic DIG Diagram (cf. Rossa & Dettmar 2000) for our survey galaxies, together with the starburst sample studied by LH95. The FIR color () for the 62 edge–on galaxies of our H survey, which have been detected with IRAS is plotted as a function of the FIR luminosity per unit area. The filled symbols indicate galaxies where eDIG has been detected. They separate clearly from the eDIG non–detections (denoted by open squares) in this diagram. All IRAS warm galaxies () show eDIG. This is valid for the LH95 sample, as well as for our investigated galaxies, even though they have much lower values of . These targets are mainly Sd type spirals. The is a measure of the warm dust temperature, and is described by interstellar dust models (e.g., Désert et al. 1990).
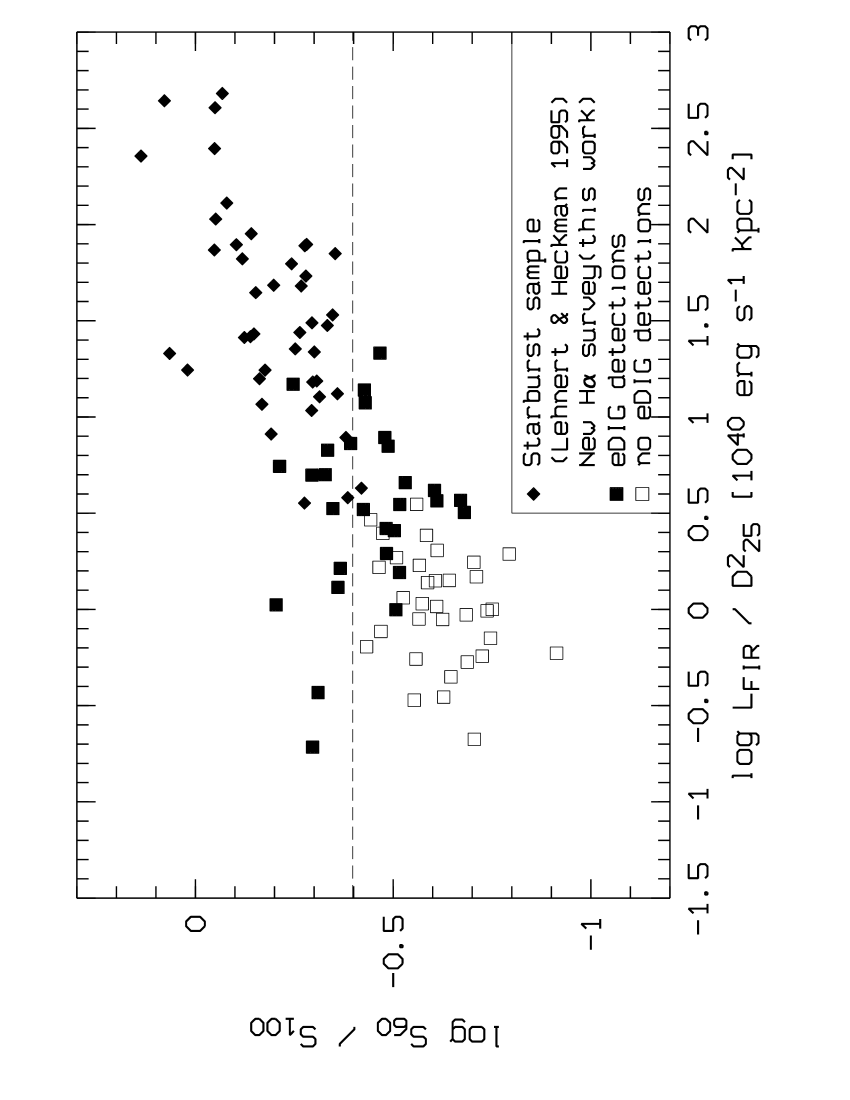
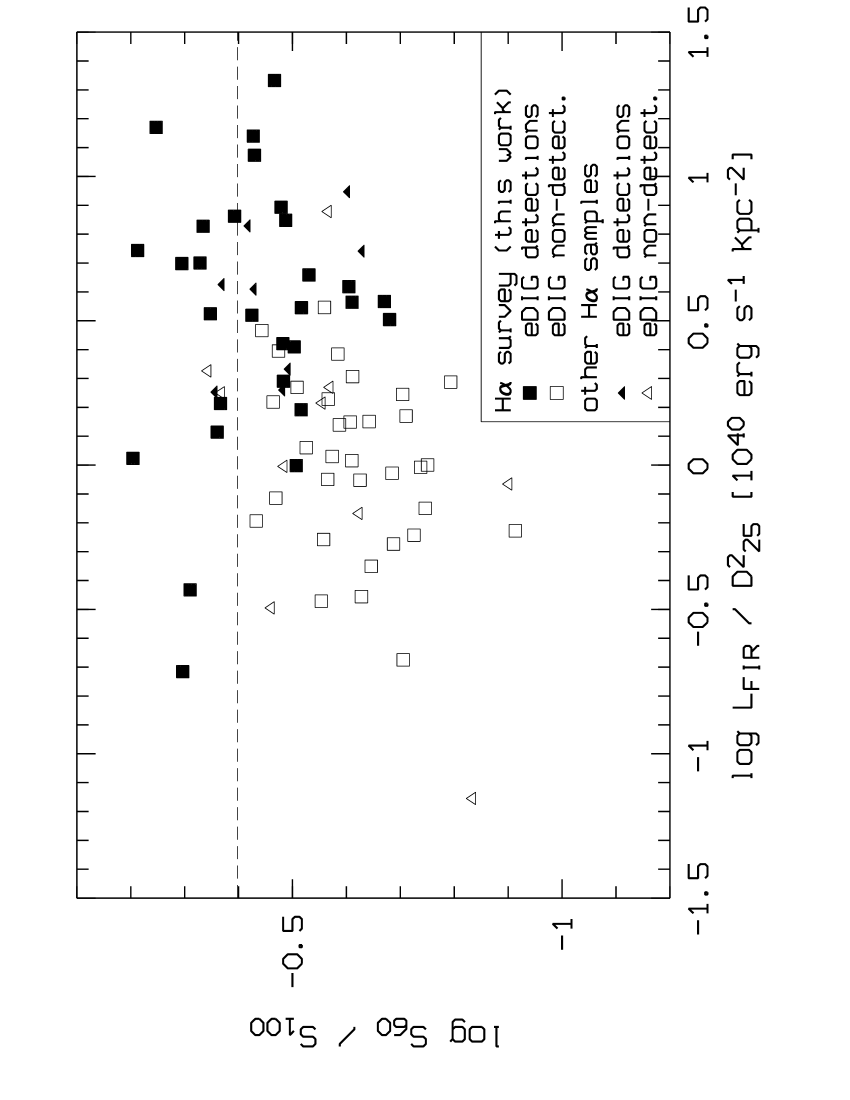
As we zoom into the parameter space of our studied galaxies (see Fig. 6), the separation can be seen in more detail. We have also included in this plot the positions of galaxies studied by other researchers (e.g., Pildis et al. 1994; Rand 1996; Hoopes et al. 1999). These galaxies with/without eDIG detections are denoted by filled/open triangles, respectively. Two galaxies (NGC 973 and NGC 5403) studied by Pildis et al. (1994), however, seem to have discordant values in this diagram. They claim non–detections for these two objects, but refrain from presenting the images. These two galaxies need to be re–observed by more sensitive observations to either justify their findings, or to disprove their claims, in case there is eDIG present.
A minimal SFR per unit area based on the FIR properties can be obtained from this diagram, as the detections with the lowest ratio at low () ratios are at . Positive detections at smaller values of are reached only at considerably higher ratios of , where we define a threshold of . Even fainter values of with eDIG detections are only found among IRAS warm galaxies, such as in the case of ESO 274–1, which has the lowest ratio of our studied galaxies, but also one of the highest ratios among our targets (Rossa 2001; Rossa & Dettmar 2003).
4.2 Energy input rate per unit area
In an investigation of a small sample of edge–on galaxies Dahlem et al. (1995) found evidence for the presence of radio halos for galaxies which exceed a certain threshold of energy input per unit area . We follow this approach, and calculate for our survey galaxies, based on FIR properties. This energy input rate can be written as
| (3) |
with as the energy released by a supernova (energy input per SN), for which we use erg. is the SN rate, in units of []. denotes the area of the SF activity, which is proportional to the SF disk radius squared. We use the definition given in Condon (1992) to derive the SN rate, which is . The SFRs have been calculated according to Kennicutt (1998) which can be written in the following expression . The SF disk radius has been measured from our H images. The energy injection rates per unit area are calculated in Table 1 (including 4 galaxies of a sub–sample cf. Paper II) and found to range from 1.4 to 5.9. In Fig. 7 we have plotted the ratio as a function of the energy injection per unit area (), coded with symbols for detections and non–detections. We have compared our calculated SN rates with the ones derived from radio properties by Dahlem et al. (1995) for e.g., NGC 891, which are in reasonable agreement.
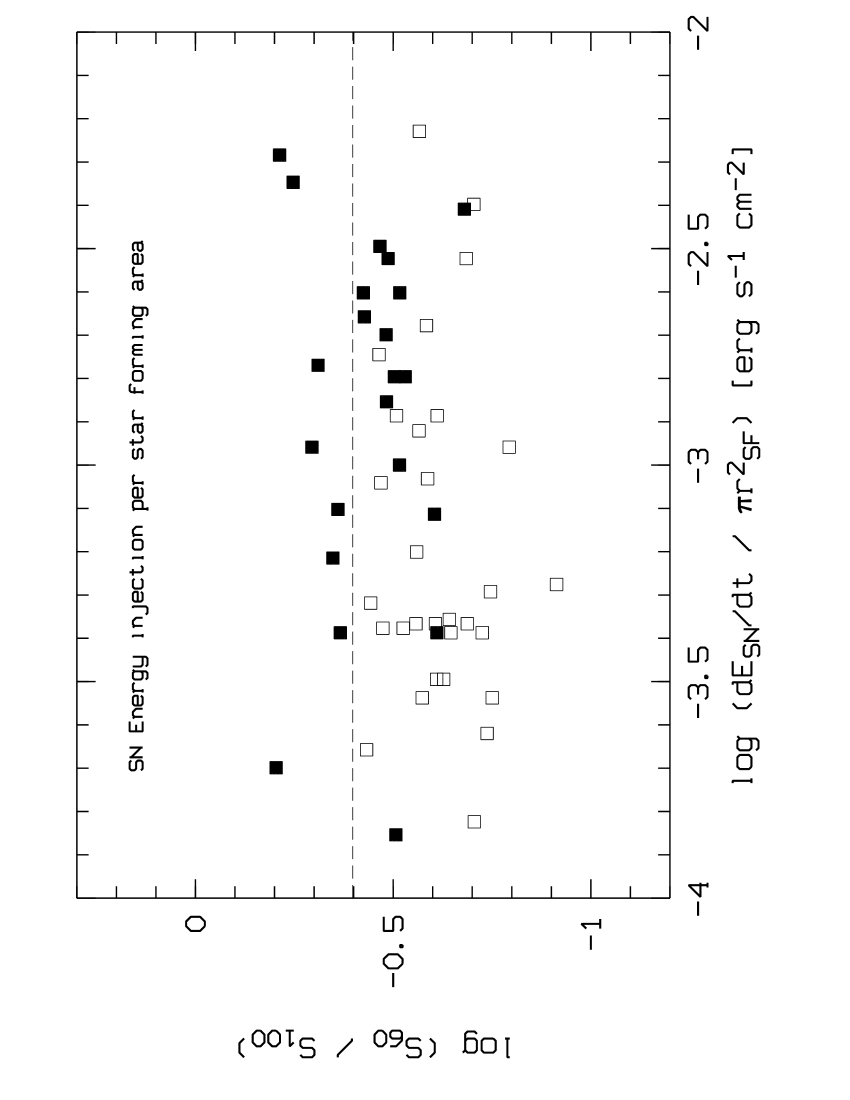
The diagram above (Fig. 7), however, does not show a clear correlation as in the case for the FIR luminosity per unit area. The energy injection as a function of reveals a larger scatter. There is one discordant data point (NGC 7064), which has a much too low value for its high ratio, given the fact that NGC 7064 shows eDIG presence. If that data point is not taken into account, there is a slight correlation visible, where galaxies with large values of also have a large ratio, and smaller tends to have also a smaller ratio. In a study of a much smaller sample of 16 galaxies Irwin et al. (1999) came up with a better correlation, although one data point did also show a discordant value. However, it should be stressed that their parameter space was substantially smaller, and if we plot our galaxies covering this particular parameter space, the correlation comes out significantly better. The scatter in the energy injection can be explained by the fact that galaxies with large intrinsic SF radii tend to have low values of , but strong local SF region can also show outflows and thus a mixture of galaxies with low and high values of is the result.
| Galaxy | SFRFIR | |||
|---|---|---|---|---|
| [] | [] | [] | [] | |
| NGC 24 | 0.05 | 0.002 | 1.55 | |
| NGC 100 | 0.03 | 0.001 | 2.91 | |
| UGC 260 | 0.74 | 0.030 | 3.57 | |
| ESO 540–16 | 0.08 | 0.003 | 3.94 | |
| MCG-2-3-16 | 1.34 | |||
| NGC 360 | 0.85 | 0.035 | 5.86 | |
| NGC 669 | 1.48 | 0.061 | 14.17 | |
| UGC 1281 | 1.67 | |||
| NGC 891 | 2.15 | 0.089 | 4.93 | |
| UGC 2082 | 0.04 | 0.002 | 2.34 | |
| IC 1862 | 5.40 | 0.221 | 23.59 | |
| NGC 1247 | 3.56 | 0.146 | 18.05 | |
| ESO 117–19 | 2.81 | 0.115 | 13.95 | |
| IC 2058 | 0.14 | 0.006 | 3.83 | |
| ESO 362–11 | 0.71 | 0.029 | 3.90 | |
| ESO 121–6 | 1.07 | 0.044 | 3.94 | |
| NGC 2188 | 0.09 | 0.004 | 3.09 | |
| ESO 209–9 | 1.49 | 0.061 | 6.30 | |
| UGC 4559 | 0.27 | 0.011 | 3.15 | |
| NGC 2654 | 0.12 | 0.005 | 3.59 | |
| NGC 2683 | 0.16 | 0.007 | 1.32 | |
| NGC 3003 | 0.88 | 0.036 | 4.68 | |
| NGC 3221 | 15.39 | 0.631 | 17.64 | |
| NGC 3365 | 1.12 | |||
| NGC 3501 | 3.60 | |||
| NGC 3600 | 0.08 | 0.003 | 2.10 | |
| NGC 3628 | 1.88 | 0.077 | ||
| NGC 3877 | 0.64 | 0.026 | 6.00 | |
| NGC 3936 | 0.98 | 0.040 | 5.73 | |
| ESO 379–6 | 1.49 | 0.061 | 12.62 | |
| NGC 4206 | 0.16 | 0.007 | 4.01 | |
| NGC 4216 | 0.40 | 0.016 | 5.74 | |
| NGC 4235 | 0.21 | 0.009 | 2.29 | |
| NGC 4256 | 0.51 | 0.021 | 6.59 | |
| NGC 4388 | 7.20 | 0.295 | 7.75 | |
| NGC 4700 | 1.00 | 0.041 | 6.25 | |
| NGC 4945 | 13.10 | 0.537 | 11.21 | |
| NGC 5290 | 1.58 | 0.065 | 6.50 | |
| NGC 5297 | 8.60 | 0.353 | 8.00 | |
| NGC 5775 | 8.42 | 0.345 | 10.72 | |
| ESO 274–1 | 0.04 | 0.002 | ||
| NGC 5965 | 0.96 | 0.039 | 9.89 | |
| NGC 6722 | 21.43 | |||
| IC 4837A | 2.24 | 0.092 | 6.79 | |
| ESO 142–19 | ||||
| IC 4872 | 1.67 | |||
| NGC 6875A | 0.83 | 0.034 | 6.00 |
| Galaxy | SFRFIR | |||
|---|---|---|---|---|
| [] | [] | [] | ] | |
| FGC 2290a | 2.03 | 0.083 | 5.40 | |
| IC 5052 | 0.08 | 0.003 | 4.95 | |
| IC 5071 | 1.07 | 0.044 | 10.43 | |
| IC 5096 | 0.97 | 0.040 | 9.81 | |
| NGC 7064 | 0.06 | 0.002 | 3.60 | |
| NGC 7090 | 0.58 | 0.024 | 4.20 | |
| UGC 11841 | ||||
| NGC 7184 | 2.22 | 0.091 | 10.22 | |
| IC 5171 | 0.75 | 0.031 | 5.10 | |
| IC 5176 | 1.47 | 0.060 | 5.11 | |
| NGC 7339 | 1.16 | |||
| NGC 7361 | 0.15 | 0.086 | 4.75 | |
| NGC 7412A | 2.39 | |||
| UGC 12281 | 0.54 | 0.022 | 10.00 | |
| NGC 7462 | 0.41 | 0.017 | 5.41 | |
| UGC 12423 | ||||
| NGC 7640 | 0.12 | 0.005 | 3.56 | |
| ESO 240–11 | 1.51 | 0.062 | 14.97 |
aMCG-01-53-012
5 Discussion
The presence of galactic gaseous halos is usually regarded as the result of strong SF activity in the underlying galaxy disks. Although detailed kinematic information has mostly eluded us to confirm an associated outflow, many pieces of evidence, that have been gathered in the last couple of years, strengthen the concept of a disk–halo interaction.
Alternatively, the gas could also be arising from infalling high–velocity clouds (HVCs) in the halo, which are seen in our Milky Way (e.g., Wakker & van Woerden 1997) or could maybe originating from galaxy interactions or past mergers.
From the theoretical perspective several scenarios have been suggested for the gas transport from the galactic disk into the halo, among them the galactic fountains (Shapiro & Field 1976; de Avillez 2000), chimneys (Norman & Ikeuchi 1989), superbubble outbreak (Mac Low & Ferrara 1999), or superwinds (Heckman et al. 1990).
Past observations have indicated that several edge–on galaxies show DIG at large extraplanar distances, whereas on the other side examples were found where no eDIG has been detected (Rand 1996). The present H survey has contributed significantly to the question on the occurrence of gaseous halos in normal spiral galaxies. This first systematic approach has investigated galaxies with a broad distribution of FIR luminosities.
5.1 Galactic gaseous halos – constraints and dependency
It is the strength of the SF activity, both locally and on global scales, and the high values of the FIR flux ratio S60/S100 (a measure of the warm dust temperature), that determines the presence of extraplanar DIG in halos of several edge–on spiral galaxies.
Despite possible differences in the ionization mechanism of the halo gas in normal and starburst galaxies (photoionization by hot O and B stars and SNe driven superwinds, respectively), it is interesting to note the generally good correlation between the SFR per unit area and the FIR flux ratio at 60 m and 100 m.
The normal galaxies represent the fainter extension of the starburst regime with an obvious soft transition. While the SFR per unit area is a good tracer for eDIG in this diagram (see Fig. 5), the diagnostic diagram with shows a less obvious correlation (cf. Sect. 4.2). However, individual galaxies which have not been investigated yet in the disk–halo interaction (DHI) context can be selected according to their position within the DDD, to be used for a comparison study in multifrequency investigations.
Comparing the observed morphology with data presented by other researchers (e.g., Rand 1996; Hoopes et al. 1999), the results are generally in very good agreement. Furthermore most galaxies, including all previous studied samples, follow the above mentioned correlation very well. However, it should be noted that a very few individual cases show subtle differences (cf. Sect. 4.1).
Galaxies with extraplanar DIG either fall in the upper right or in the upper left corner region of the diagnostic DIG diagram (DDD). Galaxies with detectable, but less prominent gaseous halos populate the region adjacent to these regions (middle part of the DDD), whereas galaxies with no detectable gaseous halos are located in the lower left corner. In addition to that, there are two regions that are not occupied by any galaxies. These are the extreme upper left and lower right corners in the DDD. Obviously in those parts there is no physical meaningful parameter space for galaxies. In spite of the current calculation of the SFR from the FIR, the FIR may be low in some cases with still a significant SFR if the amount of dust is small. On the other side, a high dust temperature also demands a high star formation rate, although high dust temperatures do not necessarily imply high SFRs per unit area. For the subluminous IRAS bright (warm) galaxies strong local SF activity with a high ratio also leads to strong local gaseous outflows (e.g., ESO 274–01)! This area is dominated by the extreme late–type and irregular galaxies such as ESO 274–01. However, this region is also occupied at least by one observed Seyfert galaxy (NGC 4235), whose activity (powered by an AGN) is restricted to the nuclear region.
In Table 2 all galaxies of this current H survey are listed in order of decreasing SF rate per unit area (). Those galaxies of our H survey, which have also been investigated by other protagonists, are indicated by an asterisk. We list in Table 2 for all galaxies the ratio, in addition to the distances of the galaxies, the major axis diameter in arcminutes, the above mentioned SF rate per unit area, and also the observed DIG morphology. As previously mentioned, from the total of 74 galaxies there were 12 galaxies with no measured FIR fluxes. We have therefore listed them (in order of increasing R.A.) at the end of this table.
The galaxy with the highest SFR per unit area in our sample is NGC 5775, reaching a value of about 21.5 (in units of ), which was also included in the sample by LH95. We have included four galaxies of their sample also into our survey. We have calculated the ratio and the ratio for the galaxies of the LH95 sample. The resulting numbers are listed in Table 4, where we have marked the five galaxies, that we have studied as well, with an asterisk. One further galaxy of the LH95 sample recently has been studied by Collins et al. (2000), and this galaxy is marked in Table 4 with a dagger. Finally, all other normal galaxies studied in the DIG context by various researchers have been listed in Table 3, for which we have also calculated the diagnostic ratios.
The galaxy with the lowest SFR per unit area (0.2 in same units) in our survey is ESO 274–01. It shows extended H emission locally. Although this galaxy fails to represent a continuous halo, there are a few bright local features, whereas on other positions in the disk there is almost no detectable H emission at all. However, the fact that strong local extended emission in this galaxy is detected, is not too surprising, as it has one of the highest ratios among our survey galaxies. In Table 2 we further indicate whether or not radio thick disks (or radio halos), and X–ray halos have been detected by other investigators for the studied galaxies. Positive detections are marked by a bullet (), and non–detections are marked by a circle (). For galaxies where neither one of the two symbols are indicated, no radio continuum and/or X–ray observations have been performed yet in search of extended emission.
In Tables 2+3 we further indicate whether or not radio thick disks and X–ray halos have been detected for the studied galaxies. If we compare the presence of gaseous halos with further evidence of the disk–halo interaction, coming from these other wavelength regimes, we generally find a good correlation of both the presence of radio thick disks and extended H emission in several cases. However, it should be stressed that there are still many galaxies of our survey, which have not been observed in the radio regime with sufficiently high resolution, which would allow a detailed comparison. In the X–ray regime there is also the demand for more sensitive observations of nearby edge–on galaxies. Besides the detection of X–ray halos in several nearby starburst galaxies, information on X–ray halos in non–starburst galaxies are yet still very scarce. NGC 891 is one of the best studied cases in this respect (Bregman & Pildis 1994). But with the currently available more sensitive X–ray telescopes such as XMM/Newton and Chandra things will hopefully change soon. A very recent XMM/Newton EPIC pn detection of NGC 3044 confirms the presence of extended soft X–ray emission (Rossa et al., in prep.).
5.2 Clustered SNe as a cause of galactic halos
In the theories of chimneys and supperbubble outbreak (Norman & Ikeuchi 1989; Mac Low & McCray 1988) the presence of gaseous halos have their origin in gas ejections from the disk into the halo, triggered by clustered and correlated SNe. Whether all bubbles, created by clustered SNe, lead to an energy and momentum flux sufficiently high enough to entrain gaseous matter well above the disk–halo interface (i.e. a blowout) has been investigated by Heiles (1990). Koo et al. (1992) have shown that some of the detected worms of earlier works by Heiles (1984) appear to be ionized. The general picture is that OB associations produce supershells in the surrounding ISM and if these supershells expand to large scale–heights they appear as worms. Large OB associations can produce up to 7000 supernova progenitors (McKee & Williams 1997).
Following Heiles (1990) we calculate the number of clustered SNe at the nadir of a filament which corresponds to our determined threshold of SF activity per unit area. Taking the adjusted relation of Heiles (1990)
| (4) |
where is the lifetime of a cluster’s H ii region in units of yrs, and is the H luminosity in units of , we compare this with our derived SF threshold per unit area . This will be only a simplistic estimate, as we know that the exact value is difficult to assess from many uncertainties and assumptions being made. The expression derived by Heiles (1990) rests on observational data of a sample of Sb galaxies by Kennicutt et al. (1989), galaxies which are similar to our studied edge–on spirals.
We use the conversion factor of the H to FIR luminosity of 1/176 given by Kennicutt (1998). Even values of 1/550 have been derived from the literature for several late–type spirals. This can be calculated from H data published in the literature (e.g., Rossa & Dettmar 2000; Boselli & Gavazzi 2002), and from the determined FIR luminosities (cf. Lonsdale et al. 1989). However, in those cases (H measurements of edge–on spirals) there is always an uncertainty involved due to extinction by dust.
With a mean effective area of the SF filament (approximated by ), this yields with (cf. Heiles 1990) the following expression
| (5) |
Using our derived minimal SF area in units of , multiplied with the area of a filament at the nadir in the disk , for IC 5052, which is pc, this yields clustered SNe.
Although this is a very rough estimation, this number of clustered SNe would correspond to our derived SF activity per unit threshold.
In an alternative simple approach we calculate the number of SNe which are corresponding to our derived SF threshold at the nadir of a filament. Taking the energy to be released by one supernova and ejected into the ambient ISM ( erg), we calculate the required number of SNe in a time interval of yr and per kpc2 following
| (6) |
Multiplying this with the area of the smallest filament and inserting the determined value of the filament radius ( = 37.5 pc), this yields SNe.
Concluding, the derived numbers are in reasonable agreement to support the working hypothesis that warm gaseous halos are a direct consequence of SF driven outflows. Even given the great uncertainty in calculating these numbers, it is evident that only a modest number of clustered SNe are required in order to yield outflows at the derived threshold.
The observed morphology of outflows is different from the starburst galaxies, at least from nucleated starbursts, as in almost no cases a nuclear outflowing cone is detected. The outflowing structures (i.e. filaments) emanate from strong SF regions in the disk, which are distributed along the disk (not necessarily confined to the nuclear regions). It has to be emphasized, however, that there may also be a small contribution of infalling gas (e.g., from HVCs). Unless kinematic information is available, which has up to now mostly eluded us, it is hard to predict the fraction of the latter contribution.
6 Summary
We have introduced the selection criteria for our H survey, consisting of 74 nearby ( Mpc), mostly late–type, edge–on spiral galaxies with inclinations of . It is the largest H survey to date, investigating extraplanar DIG. We have shown some optical and FIR properties of the selected galaxies.
Our survey galaxies populate the fainter end of the FIR luminosity distribution, in contrast, to starburst galaxies which populate the high luminosity range. The parameter space of the ratio for our galaxies is also filled in the lower range, as most galaxies fall in between values of 0.2 and 0.4. We covered also an overlap area of the starburst galaxies. The starburst sample by LH95 has values of (IRAS warm galaxies). The FIR luminosities of our studied galaxies range from a few up to . Whereas the SFR per unit area in starburst galaxies have considerably higher values of up to 480 in units of , the values for our galaxies range from 0.2–21.5 in the same units. We have detected eDIG in 30 of our studied galaxies. It can be concluded that, despite the fact that eDIG is not encountered in all late–type spirals, however, a significant fraction of our studied galaxies (41 %) possesses eDIG. Therefore, eDIG seems to be omnipresent in late–type spirals with high SF activity above . There is, however, also a dependence on the ratio, and therefore the minimal threshold is also a function of , as already evidenced in our study of a sub–sample (Rossa & Dettmar 2000).
In our second paper (Rossa & Dettmar 2003) the actual results for the individual galaxies are presented. There we will present the detailed morphology of eDIG of the studied galaxies, and in particular show several cases of galaxies with extended warm gaseous halos. Concluding, our working hypothesis is further justified and corroborated, that the presence of gaseous halos in late–type spirals is a direct consequence of SF activity in the underlying galactic disk.
| Galaxy | DIG morph.a | Radio halo | X–ray halo | Refs. | ||||
|---|---|---|---|---|---|---|---|---|
| [Mpc] | [′] | [] | (thick disk) | |||||
| NGC 5775⋆ | 0.3415 | 26.7 | 3.8 | 21.49 | hb,f,pl | (6); (11); (12) | ||
| NGC 4945⋆ | 0.5661 | 7.5 | 20.4 | 14.79 | f,hb,pl | |||
| NGC 3221 | 0.3738 | 54.7 | 3.1 | 13.80 | ee,f,hf | (10) | ||
| NGC 4634 | 0.3720 | 19.1 | 2.6 | 11.84 | ee,f,hb,pa | |||
| NGC 4402 | 0.3320 | 22.0 | 3.9 | 7.82 | ee,f,pa | |||
| IC 2135b | 0.4051 | 17.7 | 2.8 | 7.28 | e,h,p | |||
| ESO 121–6 | 0.3256 | 16.2 | 3.9 | 7.05 | hf | |||
| NGC 3044⋆ | 0.4633 | 17.2 | 4.9 | 6.72 | ee,f,hb | (8);(13) | ||
| NGC 4388⋆ | 0.6127 | 33.6 | 5.5 | 5.53 | f,hf,pa | |||
| NGC 3628⋆ | 0.4694 | 7.7 | 12.9 | 5.02 | ee,f,pl | (4) | ||
| NGC 4700 | 0.5074 | 24.0 | 3.0 | 4.99 | hb,f,pa | (5) | ||
| ESO 209–9 | 0.2948 | 14.9 | 6.2 | 4.56 | hb,pa,pl | |||
| NGC 3877 | 0.2486 | 12.1 | 5.3 | 4.15 | ee,f,pl | |||
| NGC 4302⋆ | 0.2136 | 18.8 | 5.5 | 3.69 | ee,pl | (9) | ||
| ESO 379–6 | 0.2452 | 39.8 | 2.6 | 3.67 | ee,pl | |||
| ESO 117–19 | 0.2759 | 71.4 | 2.0 | 3.51 | d | |||
| IC 5176 | 0.3044 | 23.3 | 4.5 | 3.51 | ee,hf | (7) | ||
| NGC 7462 | 0.4492 | 14.1 | 4.0 | 3.34 | f,hf,pl | (5) | ||
| UGC 260 | 0.3761 | 28.5 | 2.7 | 3.30 | eh2,f,hf,pec | |||
| NGC 891⋆ | 0.2089 | 9.5 | 14.0 | 3.19 | ee,eh2,f,hb | (1); (3) | ||
| NGC 1247 | 0.3604 | 52.6 | 3.4 | 2.92 | d,pa | |||
| ESO 362–11 | 0.3295 | 17.9 | 4.7 | 2.63 | hf | |||
| NGC 5290 | 0.3139 | 34.4 | 3.7 | 2.57 | ee,f,hb | |||
| IC 1862 | 0.3357 | 85.3 | 2.8 | 2.48 | d,n | |||
| IC 4837A | 0.2605 | 37.9 | 4.1 | 2.42 | d | |||
| NGC 3936 | 0.2447 | 29.0 | 3.9 | 2.03 | d,n | |||
| NGC 7090 | 0.3287 | 11.4 | 7.7 | 1.95 | a,ee,f,hf | (5) | ||
| NGC 360 | 0.1609 | 30.7 | 3.5 | 1.94 | d,ee,pl | |||
| IC 5171 | 0.3101 | 34.1 | 3.0 | 1.86 | d | |||
| NGC 2683 | 0.1976 | 5.5 | 8.8 | 1.76 | d,n | (10) | ||
| NGC 5297 | 0.2714 | 67.5 | 5.4 | 1.69 | d,n | (10) | ||
| NGC 3003⋆ | 0.3434 | 19.7 | 6.0 | 1.65 | d,n | |||
| NGC 2188⋆ | 0.4301 | 7.9 | 4.7 | 1.63 | f,hf,pl | |||
| NGC 6875A | 0.3048 | 42.4 | 2.8 | 1.56 | ee?,pa | |||
| IC 4351 | 0.1947 | 35.5 | 6.0 | 1.48 | n | |||
| IC 5096 | 0.2280 | 41.9 | 3.2 | 1.42 | n | |||
| IC 5071 | 0.2472 | 41.6 | 3.4 | 1.41 | d | |||
| NGC 7184 | 0.2588 | 34.1 | 6.0 | 1.38 | d,n | |||
| NGC 3600 | 0.4362 | 9.6 | 4.1 | 1.30 | ee | (9) | ||
| IC 2058 | 0.2982 | 18.2 | 3.1 | 1.15 | n | |||
| NGC 7361 | 0.2669 | 15.9 | 3.8 | 1.07 | d,n | |||
| NGC 7064 | 0.6250 | 11.4 | 3.4 | 1.06 | ee,hf,pl | (7) | ||
| NGC 669 | 0.2455 | 62.4 | 3.1 | 1.04 | n | |||
| ESO 240–11 | 0.1776 | 37.9 | 5.3 | 1.00 | n | (7) | ||
| IC 5052 | 0.3112 | 7.9 | 5.9 | 1.00 | a,ee,hb,pl | |||
| UGC 12281⋆ | 0.1830 | 34.2 | 3.5 | 0.98 | n | |||
| MCG-01-53-012 | 0.2067 | 79.5 | 3.0 | 0.94 | n | |||
| UGC 4559 | 0.2721 | 27.8 | 3.2 | 0.89 | n | |||
| UGC 10288⋆ | 0.2370 | 27.3 | 4.8 | 0.89 | n | (9) | ||
| NGC 24 | 0.3396 | 6.8 | 5.8 | 0.77 | d,n | |||
| NGC 4256 | 0.1794 | 33.7 | 4.1 | 0.71 | d,n | |||
| ESO 540–16 | 0.3692 | 20.7 | 2.7 | 0.64 | d | |||
| NGC 4216 | 0.1221 | 16.8 | 7.9 | 0.59 | d,n | |||
| NGC 2654 | 0.1882 | 17.9 | 4.2 | 0.57 | d,n | |||
| NGC 5965 | 0.2769 | 45.5 | 4.7 | 0.55 | d,n | |||
| NGC 4206 | 0.2054 | 16.8 | 5.2 | 0.53 | d,pa | |||
| NGC 7640 | 0.2259 | 8.6 | 9.9 | 0.45 | d,n | |||
| NGC 4235 | 0.4896 | 32.1 | 3.8 | 0.37 | ee,hf | (2) |
| Galaxy | DIG morph.a | Radio halo | X–ray halo | Refs. | ||||
|---|---|---|---|---|---|---|---|---|
| [Mpc] | [′] | [] | (thick disk) | |||||
| UGC 2082 | 0.2356 | 9.4 | 5.4 | 0.35 | d,n | |||
| NGC 5170 | 0.2796 | 20.0 | 8.3 | 0.34 | n | |||
| NGC 100 | 0.1971 | 11.2 | 5.6 | 0.21 | n | |||
| ESO 274–1 | 0.5055 | 7.0 | 11.0 | 0.19 | ee,f | |||
| MCG-2-3-16 | – | 17.9 | 3.0 | a,n | ||||
| UGC 1281 | – | 4.6 | 4.5 | n | (9) | |||
| IC 2531 | – | 33.0 | 6.9 | pl | ||||
| NGC 3365 | – | 13.2 | 4.4 | d,n | ||||
| NGC 3501 | – | 15.1 | 3.5 | n | (9) | |||
| NGC 6722 | – | 76.7 | 2.9 | n | ||||
| ESO 142–19 | – | 56.2 | 4.4 | n | ||||
| IC 4872 | – | 25.7 | 3.5 | n | ||||
| UGC 11841 | – | 79.9 | 2.8 | n | (9) | |||
| NGC 7339 | – | 17.9 | 2.7 | n | ||||
| NGC 7412A | – | 12.4 | 3.5 | a,n | ||||
| UGC 12423 | – | 64.5 | 3.4 | n | (9) |
a aarc(s), ddisk emission (only
planar DIG), eeextended emission (locally), eh2extraplanar
H ii region(s),
ffilament(s), hb=bright halo, hf=faint
halo, nno (e)DIG, papatch(es), pecpeculiar, plplume(s),
References: (1) Bregman & Pildis (1994); (2)
Colbert et al. (1996); (3) Dahlem et al. (1994); (4) Dahlem et al. (1996);
(5) Dahlem et al. (2001); (6) Duric et al. (1998); (7)
Harnett & Reynolds (1991); (8) Hummel & van der Hulst (1989);
(9) Hummel et al. (1991); (10) Irwin et al. (1999); (11)
Tüllmann et al. (2000); (12) Rossa et al. (2002);
(13) Rossa et al., in prep., bIC 2135 was formerly
known as NGC 1963 ( = detection, = non–detection)
| Galaxy | DIG morphologya | Radio halo | X–ray halo | Refs. | ||||
| [Mpc] | [′] | [] | (thick disk) | |||||
| NGC 4217 | 0.2511 | 17.0 | 4.9 | 8.85 | pl,pa | (9) | ||
| NGC 5403 | 0.2717 | 37.6 | 3.0 | 7.56 | n | (7) | ||
| NGC 3556 | 0.3841 | 14.1 | 8.1 | 6.74 | ee,hf? | (1);(10);(11) | ||
| NGC 4013 | 0.2360 | 17.0 | 4.8 | 5.51 | ee,f,hf | (9) | ||
| NGC 4631 | 0.4292 | 6.9 | 14.8 | 4.22 | f,hf,pa | (5); (8) | ||
| NGC 5777 | 0.3745 | 30.5 | 3.1 | 4.07 | pl | (7) | ||
| NGC 4522 | 0.3235 | 16.8 | 3.5 | 2.15 | ee,eh2,f | (6) | ||
| NGC 973 | 0.4541 | 66.1 | 3.7 | 2.12 | n | (7) | ||
| UGC 3326 | 0.2696 | 56.4 | 3.4 | 1.86 | pl | (7) | ||
| NGC 3432 | 0.3313 | 7.8 | 6.9 | 1.82 | ee,eh2 | (2) | ||
| NGC 55 | 0.4423 | 1.3 | 27.5 | 1.79 | ee,eh2,f,pl, | (3);(4); (14) | ||
| NGC 4762 | 0.4286 | 16.8 | 7.6 | 1.78 | n | (9) | ||
| NGC 5907 | 0.2788 | 14.9 | 11.7 | 1.64 | d | (9) | ||
| UGC 2092 | 0.3281 | 82.1 | 3.0 | 0.99 | pl | (7) | ||
| NGC 5746 | 0.1256 | 22.9 | 6.9 | 0.86 | d,n | (9) | ||
| NGC 4565 | 0.2381 | 9.7 | 14.8 | 0.68 | n | (8) | ||
| IC 2233 | 0.3464 | 7.7 | 4.6 | 0.32 | pl | (9);(12) | ||
| NGC 4244 | 0.1466 | 3.1 | 14.8 | 0.07 | eh2 | (5);(13) | ||
| NGC 4183 | 17.0 | 5.1 | d | (1) | ||||
| NGC 5023 | 6.0 | 5.9 | pl? | (9) | ||||
| UGC 9242 | 26.3 | 4.9 | ee? | (5) |
a aarc(s), ddisk emission (only
planar DIG), eeextended emission (locally), eh2extraplanar
H ii region(s),
ffilament(s), hb=bright halo, hf=faint
halo, nno (e)DIG, papatch(es), pecpeculiar, plplume(s)
References: (1) Collins et al. (2000); (2)
English & Irwin (1997); (3) Ferguson et al. (1996); (4) Hoopes et
al. (1996);
(5) Hoopes et al. (1999); (6) Kenney & Koopmann (1999);
(7) Pildis et al. (1994); (8) Rand et al. (1992); (9) Rand (1996);
(10) Wang et al. (2002); (11) Irwin et al. (2000); (12)
Hummel et al. (1991); (13) Hummel et al. (1984)
(14) Schlegel et al. (1997) ( = detection,
= non–detection)
| Galaxy | ||
|---|---|---|
| [] | ||
| IIZw035 | 0.8551 | 479.93 |
| IIZw096 | 1.1981 | 439.65 |
| IRAS 03359–1523 | 0.8923 | 404.65 |
| IRAS 09143+0939 | 0.8947 | 248.21 |
| NGC 4418 | 1.3734 | 226.99 |
| IRAS 05447–2114 | 0.8333 | 129.32 |
| IRAS 12018+1941 | 0.8889 | 106.84 |
| NGC 7552 | 0.7225 | 89.63 |
| NGC 5104 | 0.5234 | 78.86 |
| Circinus | 0.7880 | 78.61 |
| ESO 485–003 | 0.5289 | 77.59 |
| NGC 6240 | 0.8958 | 73.75 |
| NGC 5900 | 0.4431 | 70.62 |
| NGC 2146 | 0.7609 | 66.37 |
| UGC 6436 | 0.5714 | 62.49 |
| IC 5179 | 0.5256 | 54.03 |
| NGC 4433 | 0.6339 | 48.39 |
| ES0 484–036 | 0.5400 | 47.93 |
| NGC 2798 | 0.7038 | 44.27 |
| UGC 903 | 0.5411 | 38.12 |
| NGC 4666 | 0.4499 | 33.92 |
| NGC 7541 | 0.5074 | 30.85 |
| NGC 1572 | 0.4639 | 29.89 |
| NGC 1511 | 0.5446 | 27.49 |
| NGC 1808 | 0.7114 | 27.01 |
| NGC 3885 | 0.7260 | 26.15 |
| NGC 4818 | 0.7519 | 25.89 |
| NGC 1134 | 0.5590 | 22.59 |
| NGC 253 | 0.5005 | 21.79 |
| NGC 5775⋆ | 0.3415 | 21.49 |
| NGC 3034 | 1.1625 | 21.39 |
| NGC 5253 | 1.0470 | 17.54 |
| NGC 2966 | 0.6667 | 17.52 |
| NGC 660 | 0.6887 | 15.81 |
| NGC 3627 | 0.4934 | 15.38 |
| NGC 4527 | 0.5053 | 15.19 |
| NGC 4945⋆ | 0.5661 | 14.79 |
| NGC 4088 | 0.4375 | 13.21 |
| NGC 3079 | 0.4855 | 12.73 |
| NGC 5073 | 0.6791 | 11.64 |
| NGC 3593 | 0.5083 | 10.81 |
| NGC 4536 | 0.6435 | 8.16 |
| NGC 3556† | 0.4164 | 7.82 |
| NGC 3044⋆ | 0.4633 | 6.72 |
| NGC 4388⋆ | 0.6127 | 5.53 |
| NGC 3628⋆ | 0.4694 | 5.02 |
| NGC 3067 | 0.4922 | 5.00 |
| NGC 3511 | 0.3805 | 4.27 |
| NGC 2820 | 0.4118 | 3.81 |
| NGC 3448 | 0.5299 | 3.57 |
Acknowledgements.
It is our sincere pleasure to express our thanks to Dr. Francisco Prada for carrying out some of the observations at Calar Alto in an emergency case. We owe special thanks to Dr. Michael Dahlem for providing us with the data on NGC 3936, kindly observed by Dr. Eva Grebel. We would also like to thank the anonymous referee for his/her comments which helped to improve the clarity of the text in a few places. The authors would like to thank Deutsches Zentrum für Luft– und Raumfahrt (DLR) for financial support of this research project through grant 50 OR 9707. Additional travel support for the Calar Alto observing runs is acknowledged from the DFG through various grants. This research has made extensive use of the NASA/IPAC Extragalactic Database (NED) which is operated by the Jet Propulsion Laboratory, California Institute of Technology, under contract with the National Aeronautics and Space Administration.References
- Bland & Tully (1988) Bland, J., & Tully, R.B. 1988, Nat, 334, 43
- Boselli & Gavazzi (2002) Boselli, A., & Gavazzi, G. 2002, A&A, 386, 124
- Bottinelli et al. (1983) Bottinelli, L., Gouguenheim, L., Paturel, G, & de Vaucouleurs, G. 1983, A&A, 118, 4
- Bregman (1980) Bregman, J.N. 1980, ApJ, 236, 577
- Bregman & Pildis (1994) Bregman, J.N., & Pildis, R.A. 1994, ApJ, 420, 570
- Cecil et al. (2002) Cecil, G., Bland–Hawthorn, J., Veilleux, S., & Filippenko, A.V. 2002, ApJ, 555, 338
- Chevalier & Clegg (1985) Chevalier, R.A., & Clegg, A.W. 1985, Nat, 317, 44
- Colbert et al. (1996) Colbert, E.J.M., Baum, S.A., Gallimore, J.F., O’Dea, C.P., & Christensen, J.A. 1996, ApJ, 467, 551
- Collins et al. (2000) Collins, J.A., Rand, R.J., Duric, N., & Walterbos, R.A.M. 2000, ApJ, 536, 645
- Condon (1992) Condon, J.J. 1992, ARAA, 30, 575
- Dahlem et al. (1994) Dahlem, M., Dettmar, R.–J., & Hummel, E. 1994, A&A, 290, 384
- Dahlem et al. (1995) Dahlem, M., Lisenfeld, U., & Golla, G. 1995, ApJ, 444, 119
- Dahlem et al. (1996) Dahlem, M., Heckman, T.M., Fabbiano, G., Lehnert, M.D., & Gilmore, D. 1996, ApJ, 461, 724
- Dahlem et al. (1997) Dahlem, M., Petr, M., Lehnert, M.D., Heckman, T.M., & Ehle, M. 1997, A&A, 320, 731
- Dahlem et al. (2001) Dahlem, M., Lazendic, J.S., Haynes, R.F., Ehle, M., & Lisenfeld, U. 2001, A&A, 374, 42
- de Avillez (2000) de Avillez, M.A. 2000, MNRAS, 315, 479
- Désert et al. (1990) Désert, F.-X., Boulanger F., & Puget, J.L. 1990, A&A, 237, 215
- Dettmar (1990) Dettmar, R.–J. 1990, A&A, 232, L15
- Dettmar (1992) Dettmar, R.–J. 1992, Fund. Cosmic Phys., 15, 145
- de Vaucouleurs et al. (1991) de Vaucouleurs, G., de Vaucouleurs, A., Corwin, H.G.,Jr., et al. 1991, Third Reference Catalogue of Bright Galaxies (RC3), Springer Verlag
- Domgörgen & Dettmar (1997) Domgörgen, H., & Dettmar, R.–J. 1997, A&A, 322, 391
- Duric et al. (1998) Duric, N., Irwin, J.A., & Bloemen, H. 1998, A&A, 331, 428
- English & Irwin (1997) English, J., & Irwin, J.A. 1997, AJ, 113, 2006
- Ferguson et al. (1996) Ferguson, A.M.N., Wyse, R.F.G., Gallagher, J.S. III, & Hunter, D.A. 1996, AJ, 112, 2567
- Golla et al. (1996) Golla, G., Dettmar, R.-J., & Domgörgen, H. 1996, A&A, 313, 439
- Guthrie (1992) Guthrie, B.N.G. 1992, A&AS, 93, 255
- Hameed & Devereux (1999) Hameed, S., & Devereux, N. 1999, AJ, 118, 730
- Harnett & Reynolds (1991) Harnett, J.I., & Reynolds, J.E. 1991, A&AS, 88, 73
- Heckman (2001) Heckman, T.M. 2001, in: “Gas & Galaxy Evolution”, ASP Conf. Series Vol. 240, eds. J.E. Hibbard, M.P. Rupen, J.H. van Gorkom, p. 345
- Heckman et al. (1990) Heckman, T.M., Armus, L., & Miley, G.K. 1990, ApJS, 74, 833
- Heiles (1984) Heiles, C. 1984, ApJS, 55, 585
- Heiles (1990) Heiles, C. 1990, ApJ, 354, 483
- Holmberg (1946) Holmberg, E. 1946, Medd. Lunds Obs. II, No. 117
- Hoopes et al. (1996) Hoopes, C.G., Walterbos, R.A.M., & Greenawalt, B.E. 1996, AJ, 112, 1429
- Hoopes et al. (1999) Hoopes, C.G., Walterbos, R.A.M., & Rand, R.J. 1999, ApJ, 522, 669
- Hubble (1926) Hubble, E.P. 1926, ApJ, 64, 321
- Hummel et al. (1984) Hummel, E., Sancisi, R., & Ekers, R.D. 1984, A&A, 133, 1
- Hummel & van der Hulst (1989) Hummel, E., & van der Hulst, J.M. 1989, A&AS, 81, 51
- Hummel et al. (1991) Hummel, E., Beck, R., & Dettmar, R.–J. 1991, A&AS, 87, 309
- Irwin et al. (1999) Irwin, J.A., English, J., & Sorathia, B. 1999, AJ, 117, 2102
- Irwin et al. (2000) Irwin, J.A., Saikia, D.J., & English, J. 2000, AJ, 119, 1592
- Karachentsev et al. (1993) Karachentsev, I.D., Karachentseva, V.E., & Parnovskij, S.L. 1993, AN, 314, 97
- Kenney & Koopmann (1999) Kenney, J.D.P., & Koopmann, R.A. 1999, AJ, 117, 181
- Kennicutt (1998) Kennicutt, R.C. Jr. 1998, ARAA, 36, 189
- Kennicutt et al. (1989) Kennicutt, R.C. Jr., Edgar, B.K., & Hodge, P.W. 1989, ApJ, 337, 761
- Koo et al. (1992) Koo, B.-C., Heiles, C., & Reach, W.T. 1992, ApJ, 390, 108
- Lehnert & Heckman (1995) Lehnert, M.D., & Heckman, T.M. 1995, ApJS, 97, 89 [LH95]
- Lehnert & Heckman (1996) Lehnert, M.D., & Heckman, T.M. 1996, ApJ, 462, 651
- Lonsdale et al. (1989) Lonsdale, C., Helou, G., Good, J.C., et al. 1989, Cataloged Galaxies and Quasars observed in the IRAS Survey, Jet Propulsion Laboratory
- Mac Low & McCray (1988) Mac Low, M.–M., & McCray, R. 1988, ApJ, 324, 776
- Mac Low & Ferrara (1999) Mac Low, M.–M., & Ferrara, A. 1999, ApJ, 513, 142
- McKee & Williams (1997) McKee, C.F., & Williams, J.P. 1997, ApJ, 476, 144
- Norman & Ikeuchi (1989) Norman, C.A., & Ikeuchi, S. 1989, ApJ, 345, 372
- Pildis et al. (1994) Pildis, R.A., Bregman, J.N., & Schombert, J.M. 1994, ApJ, 427, 160
- Rand (1996) Rand, R.J. 1996, ApJ, 462, 712
- Rand et al. (1990) Rand, R.J., Kulkarni, S.R., & Hester, J.J. 1990, ApJ, 352, L1
- Rand et al. (1992) Rand, R.J., Kulkarni, S.R., & Hester, J.J. 1992, ApJ, 396, 97
- Reynolds et al. (1999) Reynolds, R.J., Haffner, L.M., & Tufte, S.L. 1999, in: “New Perspectives on the Interstellar Medium”, ASP Conf. Series Vol. 168, eds. A.R. Taylor, T.L. Landecker, and G. Joncas, p. 149
- Rossa (2001) Rossa, J. 2001, Ph.D. thesis, Ruhr–University Bochum, Germany
- Rossa & Dettmar (2000) Rossa, J., & Dettmar, R.–J. 2000, A&A, 359, 433
- Rossa & Dettmar (2003) Rossa, J., & Dettmar, R.–J. 2003, A&A, submitted (Paper II)
- Rossa et al. (2002) Rossa, J., Bomans, D.J., & Dettmar, R.J. 2002, in: New Visions of the X–ray Universe in the XMM–Newton and Chandra era, ESA SP–488, eds. F. Jansen et al., in press
- Schlegel et al. (1997) Schlegel, E.M., Barrett, P., & Singh, K.P. 1997, AJ, 113, 1296
- Shapiro & Field (1976) Shapiro, P.R., & Field, G.B. 1976, ApJ, 205, 762
- Tüllmann et al. (2000) Tüllmann, R., Dettmar, R.–J., Soida, M., Urbanik, M., & Rossa, J. 2000, A&A, 364, L36
- Wakker & van Woerden (1997) Wakker, B.P., & van Woerden, H. 1997, ARA&A, 35, 217
- Wang et al. (2002) Wang, Q.D., Immler, S., Walterbos, R.A.M., Lauroesch, J.T., & Breitschwerdt, D. 2002, ApJ, 555, L99