Cooling Flows or Warming Rays?
The radiative cooling time of the X-ray-emitting plasma near the center in many clusters of galaxies is shorter than the age of the cluster, but neither the expected large drop in central temperature –nor the expected mass flow towards the pressure-depleted cluster centers– are observed. We propose a solution to these “cooling flow” problems wherein energy is supplied to the plasma by hadronic cosmic rays (CRs). The solution requires an energy deposition more intense and more distributed than in conventional CR models, but this alternative model is also successful in describing the origin of CRs, as well as the properties of gamma ray bursts and of the diffuse gamma background radiation. The X-ray energy emitted by clusters is supplied, in a quasi-steady state, by the hadronic CRs, which act as “warming rays”. The temperature distribution in the intracluster space is successfully predicted from the measured plasma-density distribution. Four other puzzling features of clusters can also be explained in simple terms: the discrepancy between their “virial” and “lensing” masses, their large magnetic fields, the correlation between their optical and X-ray luminosities, and the non-thermal tail of their X-ray spectrum.
Key Words.:
X rays: Clusters, Cosmic Rays: Interactionscola@coma.mporzio.astro.it
1 Introduction
The intergalactic plasma in the central regions of many clusters is cooler than in their outskirts, and it radiates X-rays at such a rate that the plasma cooling time is much shorter than the age of the cluster. It has been argued (Cowie & Binney 1997; Fabian & Nulsen 1977; for reviews see, e.g. Sarazin 1988; Fabian 1994, 2002; Binney 2001) that in such clusters there should be a flow of plasma from the outer hot regions to the cooler center —a “cooling flow” (CF)— in order to maintain hydrostatic equilibrium. For decades, the flows have been increasingly at variance with observation. Two of the old puzzles are that the inflowing material disappears with no observed trace and that the central-temperature depression is not as deep as expected on the basis of the plasma’s cooling rate, with the observed central temperature settling at a fraction (or the order of 1/2) of the outer temperature (see, e.g. McNamara 1997). More recently, high spatial resolution imaging with Chandra (e.g. McNamara et al. 2000; Fabian 2000; Blanton et al. 2001; Allen, Schmidt & Fabian 2001; Lewis, Stocke & Buote 2002; Blanton et al. 2002) and high spectral resolution measurements with the Reflecting Grating Spectrometer of XMM-Newton (Peterson et al. 2001, Tamura et al. 2001, Kaastra et al. 2001; Kahn et al. 2002; Peterson et al. 2002) and with XMM/EPIC (Bohringer et al. 2001a,b,c; Molendi and Pizzolato 2001; Matsushita et al. 2002) have sharpened the problem: lines corresponding to gas below are not seen, as if the gas cooled to this temperature and then vanished. We refer to these as the “CF problems”.
It has been recognized that some form of heating, e.g. by a central radio source, may alleviate the CF problems (Bohringer et al. 2002; Churazov et al. 2002). One difficulty with solutions along these lines is that the heating has to be distributed, like the plasma itself is. Another difficulty is that the bremsstrahlung cooling rate is proportional to , with the plasma’s electron number density: a suitable heating and pressure-building mechanism must somehow adapt itself to this behaviour, particularly as a function of , which varies by orders of magnitude along the clusters’ radii111Hydrogen in the plasma is fully ionized, and we are using in the Introduction ..
Heating by cosmic rays (CRs) has also been discussed (Rephaeli 1987; Rephaeli & Silk 1995), but it does not seem to be a good solution. The traditional theory of CRs posits that the bulk of them is accelerated by expanding supernova (SN) shells. The total energy in CRs made this way falls short of the required heating energy by more than one order of magnitude. Moreover, the acceleration takes place close to the central parts of galaxies, and the CRs would not deposit energy throughout a cluster as uniformly as it is required.
A somewhat different theory of the origin of CRs has been proposed, according to which SNe indeed accelerate CRs, but in an unconventional way. Like matter-accreting quasars and microquasars, most SN explosions would be accompanied by the emission of bipolar jets of ultrarelativistic “cannonballs” (CBs), with initial Lorentz factors, , of . The asymmetry in these jets would be responsible for the observed large “kick” velocity of neutron stars (Dar & Plaga 1999; Dar & De Rújula 2000a). When these CBs are moving close to the line of sight of an observer, they are seen as gamma ray bursts (GRBs) and their afterglows, providing an extremely simple, detailed and successful description of these phenomena (Dar & De Rújula 2000b; Dado, Dar & De Rújula 2002, 2003a, 2003b; De Rújula 2002; Dar 2003 and references therein). The CBs travel for kiloparsecs in the interstellar medium, decelerating by knocking out its constituents, which are thereby accelerated to become CRs. This CR theory provides a qualitative understanding of the CR spectrum (Dar & Plaga 1999; Plaga 2002) and a simple and very satisfactory understanding of the diffuse, high-galactic-altitude Gamma Background Radiation (GBR), which originates in the halo of our Galaxy, and is therefore not cosmological (Dar & De Rújula 2001a). The CRs in this theory are not confined to the disk of the Galaxy, but permeate a much larger halo. The theory also implies a total CR production rate that is more than an order of magnitude larger than the conventional figure, and yet, not in disagreement with observations (Dar and De Rújula 2001b).
We show here that this unconventional theory of CR production resolves in a very simple way the CF problems and results in a predicted temperature distribution in clusters that is in very good agreement with the observations, while implying the absence of significant flows. What are needed, we posit, are not cooling flows, but “warming rays” (WRs): cosmic rays222We do not use the expression “warming cosmic rays”, since cosmic rays are not “cosmic” in the current sense of the word. When referring to CRs in CF clusters, we use the expressions “CRs” and “WRs” as synonyms. that supply the X-ray energy emitted by clusters from their central regions and play a role in determining the temperature and pressure distribution in the whole intracluster space.
As a bonus, our theory offers plausible ways out from four other cluster conundra: the X-ray/optical luminosity correlation, the lensing/X-ray mass discrepancy, the (quite) large intracluster magnetic fields, and the origin of the non-thermal tail in the hard X-ray spectrum:
-
•
The luminosities of clusters in optical and X-ray bands are observed to be correlated: they are proportional (e.g. Miller & Nichol 2001). Once again, this requires an apparently surprising concatenation between two very different emission mechanisms. This correlation, and the value of its proportionality factor, are the ones implied by our theory of WRs.
-
•
The mass in cluster cores estimated from X-ray measurements is systematically a few times smaller than that estimated from observations of gravitational lensing (e.g. Hattori et al. 1999, and references therein). The X-ray estimate relies on an approximate hydrostatic equilibrium of the plasma in the clusters. If magnetic fields, WRs and the plasma they heat up are in energy equipartition, the pressure gradient of the first two —not taken into account in the assumed equilibrium— is of the right order of magnitude to solve the mass-discrepancy problem.
-
•
The very large CR production rate that we presuppose corresponds —again for an assumed energy equipartition— to the surprisingly large fields that are observed in clusters (e.g. Carilli & Taylor 2002; Eilek & Owen 2002, and references therein).
-
•
The high energy tail of the spectrum of the X-ray emission observed in some nearby clusters is non-thermal: (Fusco-Femianno et al. 1999, 2000; Rephaeli, Gruber & Blanco 1999). This is the expectation for the emission from the knocked on electrons produced in the CR showers that, in our theory, “warm up” the inner-cluster plasma.
We summarize in the text the features of the CB model most relevant to the problem of CF clusters, relegating to an Appendix the outline of their derivation, as well as a short overview of the model itself.
2 The distribution and luminosity of CRs
We have argued elsewhere that the “natal kicks” of neutron stars, cosmic rays, long-duration gamma-ray bursts and the diffuse gamma background radiation have a common origin: highly relativistic jets of cannonballs emitted in supernova explosions (for CRs and neutron stars, see Dar & Plaga 1999; for the GRBs and their associated SNe see, e.g., Dado et al. 2002; De Rújula 2002; Dar 2003 and references therein; for the GBR, see Dar & De Rújula 2001a). In our unconventional view of every one of these subjects, high-energy astrophysical phenomena would have a remarkable unity.
Of the quoted items, the most relevant to the current work are those leading to the estimate of the relation between the optical luminosity and the CR luminosity of a galaxy, and to the distribution of CRs in space. We summarize them here.
In Dar & Plaga 1999, Dar & De Rújula 2001a,b, and in the Appendix we argue that the CR luminosity of the Galaxy should be:
| (1) |
which is more than one order of magnitude bigger than conventionally believed. We also contend that the extension of the CR distribution in the Galaxy may be much larger than generally accepted, so that the CRs permeate a “cosmic-ray halo” extending for tens of kiloparsecs. Such a CR distribution in the galaxies of a dense cluster would permeate the cluster fairly uniformly, and result in a CR population proportional to the number density of galaxies in the cluster333 Active Galactic Nuclei (AGNs) emit powerful jets of CBs that should also be efficient CR accelerators, but not all clusters contain observed AGNs, nor is the CR population that AGNs generate uniformly distributed.. For the O(10) G magnetic fields of an intracluster medium (e.g. Carilli & Taylor 2002), the bulk of the CRs does not escape the cluster over times comparable to its age (e.g. Colafrancesco & Blasi 1998).
Our arguments are based on observations of long-duration GRBs and core-collapse SNe (of type II, Ib and Ic). In using them to discuss the CR luminosity of clusters we ought to ponder the relative frequencies of SNe of various types in spirals or ellipticals, and on the abundances of the various galaxy types in clusters. Though such considerations would not affect our results by large factors, we make the simplifying assumption that all SN types produce jets and CRs of similar energy: Type Ia supernova explosions occur as the mass of a white dwarf in a binary increases beyond the Chandrasekhar limit because of the mass accretion from a non-degenerate companion or a merger with another white dwarf. These processes result in an unstable accretion configuration akin to that observed in micro-quasars, and should also result in the emission of jets. If, as we presume, Type Ia SNe are associated with short-duration GRBs, the energy of their jets should not be much smaller than for core-collapse SNe.
The contention that long-duration GRBs are produced by core-collapse SNe (Dar 1999, Dar & Plaga 1999, Dar and De Rújula 2000, Dado et al. 2002) has recently received striking observational support: the predictions of Dado, Dar& De Rújula 2003c of a SN associated with GRB 030329, its properties and even the date when it would be convincingly discovered have been found to be correct (Stanek et al. 2003).
3 Cosmic rays in the intracluster (IC) medium
The IC space of dense clusters is filled with a highly ionized plasma at a temperature of a few keV, electron number density to cm-3 near the center, and slightly sub-solar metal abundance. This plasma is responsible for most of the cluster’s thermal X-ray emission, via bremsstrahlung in the 0.1 to 10 keV range (see, e.g. Sarazin 1988).
In the CB model the main acceleration mechanism of electrons and nuclei by CBs is simply the “collisionless” scattering of these ambient particles by the magnetic field of the moving CBs, which makes them recoil with energies proportional to their masses. Thus, the ratio of electron to nuclear CR energies is , with the mass of the corresponding nucleus: the bulk of the CR energy is carried by CR nuclei, mainly protons.
The dominant energy-loss mechanisms for hadronic CRs in the IC medium are Coulomb collisions with the ambient electrons, which lead to electromagnetic showers initiated by the knocked-on electrons, and hadronic collisions with the ambient nuclei, which also lead to high-energy electrons and positrons via pion production, followed by the decay chains , ; . A relatively small fraction of the available energy escapes, carried away by neutrinos and by rays from production and decay. The rest of the CR energy is deposited in the plasma and thermalizes, via electromagnetic interactions of the electrons and positrons, and elastic collisions of the low energy hadronic CRs with the IC electrons and nuclei.
A highly ionized plasma is much more efficient than non-ionized gas in slowing down the CR nuclei. Energy losses via Coulomb collisions with neutral atoms become significant only for energy transfers larger than their ionization potential . The corresponding small impact parameters imply relatively small cross sections. For the IC plasma the role of is played by the much smaller quantity , with the plasma frequency. Let be the (suitably averaged) squared charge of the plasma’s nuclei. For moderately relativistic CR nuclei with a charge moving with a velocity and Lorentz factor , the energy-loss rate is:
| (2) |
with and fm. The rate of Eq. (2), for typical plasma densities near the center of clusters ( cm-3), is times larger than for neutral hydrogen. For protons () with a typical CR energy and for a plasma consisting of H, He (by number), and traces of heavier elements, and GeV/s, for the quoted electron density.
Hadronic collisions between CRs and plasma nuclei constitute an energy-loss mechanism approximately as efficient as that of Eq. (2). Consider the collisions of CR protons with ambient protons, the discussion of proton–nucleon and nucleon–nucleon collisions being far too cumbersome to be justified by the small admixtures of nuclei heavier than protons in the CR and IC constituencies. For of the incident proton the cross section is mbarn, and dominantly inelastic. In practically all of these collisions the incident proton survives unscathed, as the “leading” (most energetic) final-state particle, carrying on average some 70% of the incident proton’s energy. Thus, a proton’s energy-loss rate by hadronic collisions in a hydrogenic plasma is:
| (3) |
that is GeV/s, for our reference and . This is very close to the Coulomb energy loss computed at the end of the previous paragraph for the same reference parameters.
The characteristic time for a CR proton to lose its energy is , with the sum of Eqs. (2) and (3). Once again for the chosen reference values, s. This is shorter than the age of the cluster which, for the relatively nearby clusters of interest here, is approximately the age of the Universe, s.
To summarize, to a good approximation, CRs deposit their energy within a CF cluster in a time shorter than the cluster’s age. Thus, in the absence of other significant energy sources, the IC plasma cools until its energy-loss rate by bremsstrahlung is balanced by the CR energy-deposition rate. Since the source of X-ray energy at the cluster centers are the “warming” CRs, the cluster luminosities in CRs and X-rays are approximately equal: .
4 The X-ray luminosity of a cluster
“Cooling Flow” clusters contain large amounts of plasma and, as we have argued, we may estimate their X-ray luminosity as the CR luminosity of the galaxies they contain. The latter, in turn, can be estimated from their optical luminosity, , as follows.
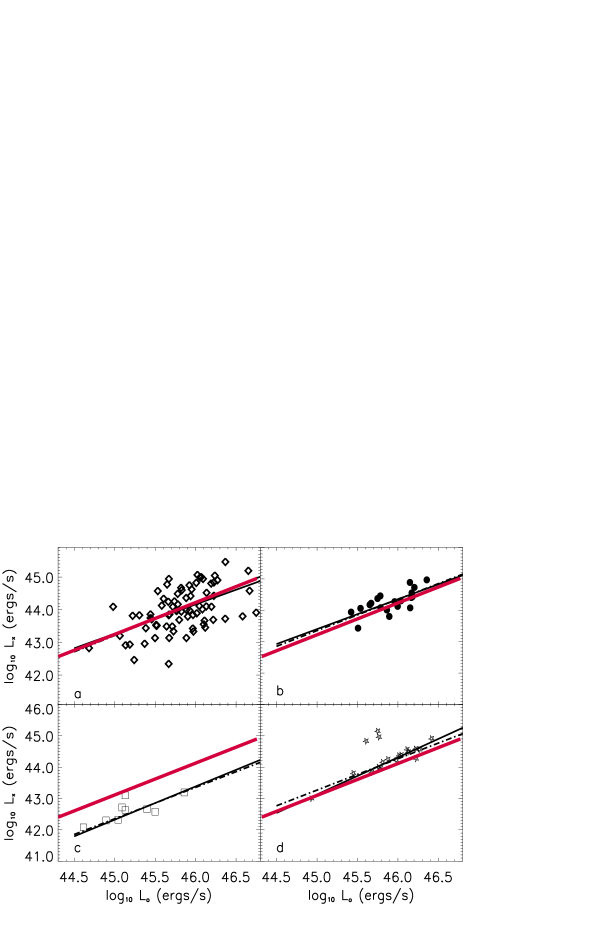
The Shapley–Ames “fiducial” sample of 342 galaxies within the Virgo circle has a mean-galaxy B-band luminosity and, for a galaxy or cluster of B-band luminosity , a mean rate of SNe per century (Van den Bergh and Tamman 1991). We have argued that the total CR energy produced by a SN is roughly twice the jet energy estimated from the typical neutron-star velocities; see the Appendix, Eq. (16). Assembling these facts and converting from a B-band to an optical solar reference, we conclude that the X-ray, CR and optical luminosities of clusters ought to satisfy:
| (4) |
The predicted relation between and is consistent with the observations for CF clusters, as we show in Fig. (1), adapted from Miller et al. 1999. The panel (c) in this figure disagrees with the prediction, but it refers to groups and not clusters of galaxies. Since WRs are not confined in the magnetic field of a group, their X-ray and optical luminosities should be linearly related, albeit with a smaller coefficient than that of Eq. (4), as observed. Encouraged by these results on the optical/X-ray luminosity relation, we proceed to study its radial distribution in CF clusters.
5 The temperature profile in cooling flow clusters
The “virial” expectation for the temperature of the plasma in a cluster, for a spherical distribution with mass within a radius , is:
| (5) | |||||
The observed “outer” temperature of the plasma in a cluster, , is —at large radii where the cooling time should be longer than the cluster’s age— roughly compatible with the virial expectation. In the inner regions the temperature is somewhat smaller ( of ) than that of Eq. (5), and significantly larger than the cooling rate would imply (see, e.g., Peterson et al. 2001).
What is the effect of the “warming rays” on a cluster’s temperature distribution? To answer this question we make the following simplifying assumptions:
-
•
Spherical symmetry.
-
•
The density of the plasma is proportional to that of galaxies and of the SNe they contain (clearly without sufficient “resolution” to individuate single galaxies). This implies that the CR distribution —which in our model traces with bad resolution the SN distribution— also traces the plasma distribution: the radial distribution of the CR intensity is proportional to that of the plasma density.
-
•
The temperature of the plasma in its “initial state” (as the cluster is born) can be approximated by a radius-independent constant.
-
•
Cooling by X-ray emission and heating and pressure-building by WRs are the dominant evolutionary agents. Flows and cluster ageing are relatively unimportant.
Given our assumptions, the rate per unit volume at which the plasma loses energy by the emission of X-rays is:
| (6) |
where is an average charge of the IC matter and in the numerics we have approximated the Gaunt factor by unity. The rate per unit volume at which the WRs deposit energy in the plasma is also quadratic in :
| (7) |
since we have first argued and then assumed that the WR production rate per unit volume is proportional to . The evolution of the temperature anywhere in the IC plasma satisfies the energy-conservation relation:
| (8) |
with the initial condition . Rewrite Eq. (8) as:
| (9) |
and integrate, to obtain:
| (10) |
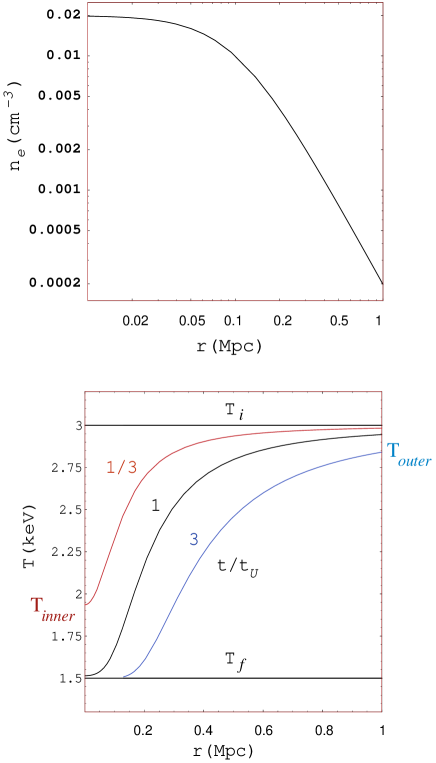
where is the steady temperature first reached at the center of the cluster, where the density is high, and at asymptotically late time in the periphery, where the density is vanishingly small. We have written the r.h.s. of Eq. (10) in a way that shows that the evolution of is determined by the ratio between the WR deposition rate and the thermal energy per unit volume at the cluster’s central temperature.
The temperature evolution described by Eq. (10) is shown in Fig. (2), for and , with the current age of the Universe444We use a cosmology with , and but in relating the radial coordinate of a given cluster to the observed angular coordinate, we use in each case the value of assumed by the observers.. In the particular example in Fig. (2) the central density is high enough for the equilibrium between X-ray cooling and WR heating to have been reached at the center of the cluster in a time of the order of its current age. In such a case, , the presently observed inner-cluster temperature. We shall see that some clusters have reached this stage, while others have not. For all the clusters we study, the cooling time in the outer parts of the cluster is much longer than , so that .
6 Temperature distributions of specific clusters
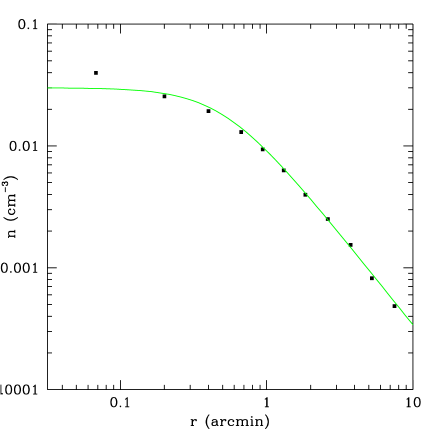
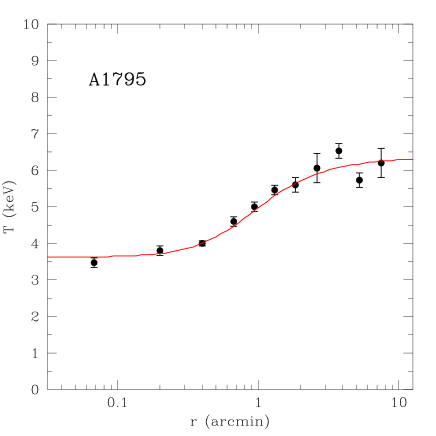
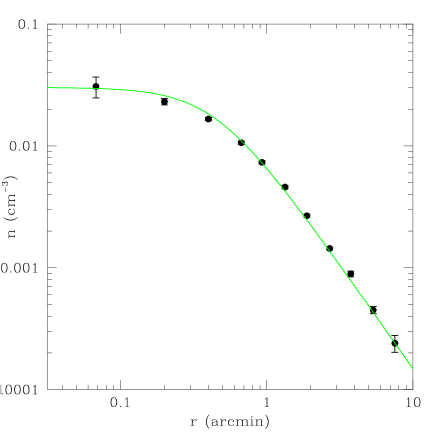
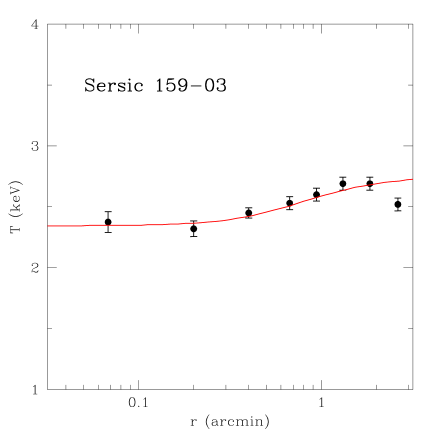
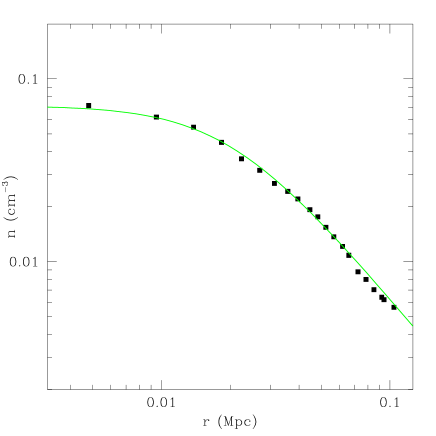
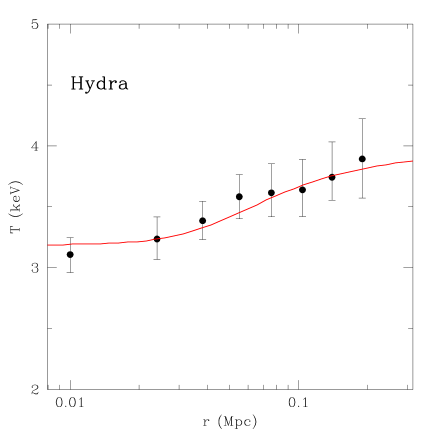
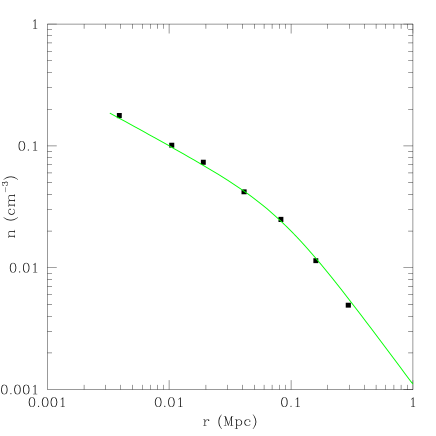
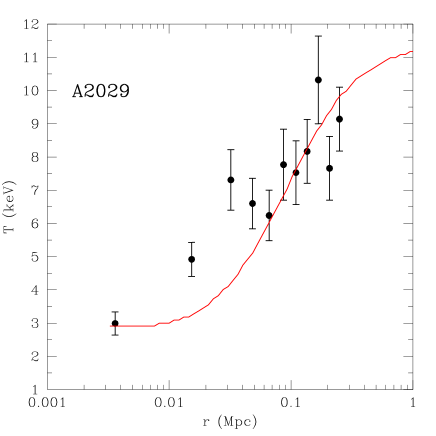
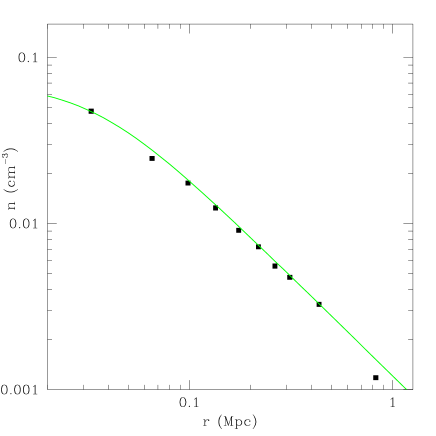
We fit Eq. (10) to the temperature distribution of a given cluster as follows: we fix from the observations an ansatz value of , we input the observed (either point by point, or via a “-model” or a variation thereof) and we vary a single parameter —or, equivalently, — to obtain a best fit at the current age of the clusters ( is fixed by the cosmological model we have adopted).
We show in Figs. (3) to (6) the measured density profiles and the predicted and observed temperature profiles of the clusters A1795, Sersic 159-03, Hydra A, and A2029. The temperature and density data are taken, respectively, from Tamura et al. (2001), Kaastra et al. (2001), David et al. (2001) and Lewis et al. (2002). These figures demonstrate that the correlation between the input density profile and the output temperature profile predicted by Eq. (10) is in excellent agreement with the observations: in all cases the shape of is snugly reproduced.
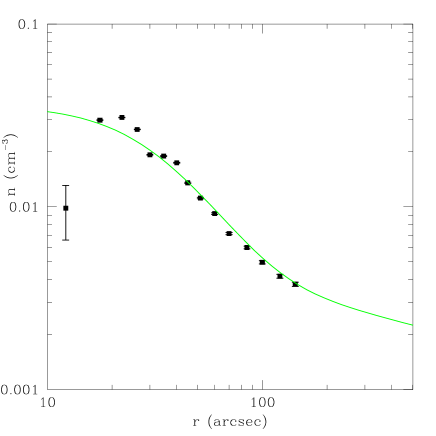
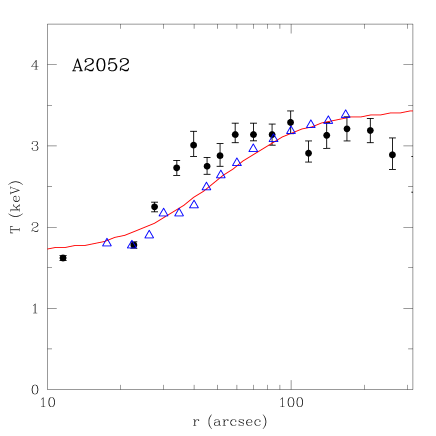
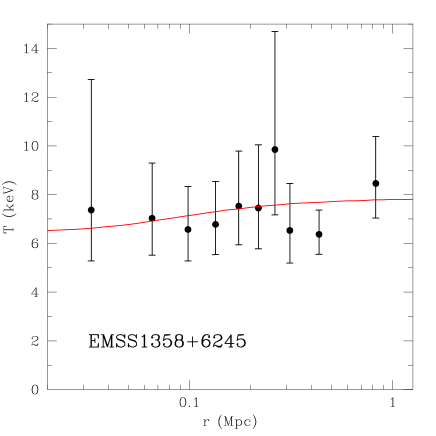
The examples of A2052 and EMSS1358+6425 are shown in Figs. (7) and (8). The data are from Blanton et al. (2002) and Arabadjis et al. (2001), respectively. In the first of these clusters, the observed is not very smooth and we have made two predictions for . One prediction uses, as in all other cases, the best fit and results in a smooth prediction for . The other prediction uses the measured point-by-point density, and results in a point-by-point prediction for , shown in Fig.(7) as a series of triangles. The latter prediction follows the shape of the observed somewhat better than the smooth curve does. EMSS1358+6425 is special, in that its measured is compatible with a constant, albeit with very large errors.
The values of the central asymptotic temperature, , resulting from our fits are shown in Table I, and compared with , the innermost observed temperature. Also given in the table are the values of , the initial constant input temperature, and of , the outermost observed temperature555For two clusters, Sersic 159-03 and A2052, the quoted value of is that of the penultimate radial point, since the lower value of the last point may indicate the “end” of the cluster.. The meaning of all these temperatures is illustrated in the lower panel of Fig. (2). In Sersic 159-03 and in Hydra, within errors, so that the centers of the cl;usters have reached a nearly steady final temperature. For A1795 and A2052 there is an indication that , so that the cluster’s central temperature should still cool in the future (not a prediction the success of which we are likely to witness). In these four clusters, indicating that their outer regions have also cooled with time. The fits to the temperature profile in Figs. (3) to (6) are very satisfactory. In the case of A2052 the observed density is so erratic that the formal errors of our simple fit cannot be trusted; the large reflects this, as is clear in Fig. (7). For EMSS1358+6425, shown in Fig. (8), the errors in the observed temperatures are so large that the fit is not very illuminating.
7 The mass discrepancy in clusters
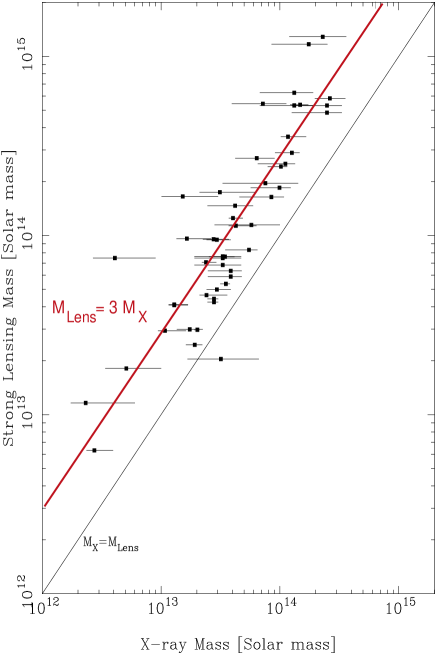
The gravitational lensing of distant galaxies by an intervening cluster can be used to infer the cluster’s mass distribution (e.g. Grossman & Narayan 1989). Such mass estimates are quite consistent with the ones derived from the observed velocities of the galaxies in the clusters. On the other hand, the mass deduced from lensing or from the motion of the galaxies is times larger than the mass deduced from the clusters’ X-ray emission (e.g. Hattori et al. 1999). Fabian and Allen (2003) obtain an agreement between the two mass estimates by using the density profile obtained by numerical simulations (Navarro, Frenk & White 1997), but this profile deviates significantly from the observed plasma distribution near the center (where it diverges as ) and in the periphery (where its asymptotic behaviour is significantly steeper than the observed one).
Assume the WRs to be in approximate energy equipartition with the magnetic field that confines them. Given our other assumptions on WRs, their pressure is proportional to the thermal pressure of the plasma. Let be the gravitational potential of a spherically symmetric cluster and the mean atomic weight of its plasma. The total mass-density distribution of the cluster, , can be inferred from the density distribution of the X-ray-emitting gas, , via Poisson’s equation666We neglect the (logarithmic) temperature gradient relative to the corresponding density gradient, a good approximation in the cases at hand.:
| (11) | |||||
where is the proportionality constant relating the sum of the magnetic and CR pressures to the thermal pressure. In approximate equipartition (), the total mass deduced from the temperature and density distribution of the X-ray-emitting plasma is approximately three times larger than that inferred by neglecting the magnetic and CR pressures. This brings the different mass estimates to better agreement, as can be seen from Fig. (9), adapted from Hattori et al. (1999). The substantial contribution of the magnetic and WR pressures helps in explaining why our last simplifying assumption in Section 5 —that flows are relatively unimportant in determining the temperature profiles— may be a fair approximation.
If the magnetic field is in rough energy equipartition with the WRs, the corresponding pressures are related by . The magnetic field would thus be:
| (12) |
which is in the observed domain. (e.g. Carilli and Taylor 2002; Eilek & Owen 2002; and references therein).
8 The X-ray tail
CR nuclei of charge , velocity and Lorentz factor deposit their energy in the IC plasma via Coulomb scattering of the plasma electrons. These knocked-on electrons recoil with kinetic energies up to . In a plasma of electron density the number of electrons per unit time and volume scattered to a kinetic energy in the range is:
| (13) |
We are interested in electrons of energy much smaller than the values corresponding to typical CRs, so that the integration over the CR spectrum, which peaks at , preserves the shape of Eq. (13) up to .
The scattered electrons cool and thermalize in the plasma mainly by bremsstrahlung emission at high energy and by Coulomb collisions at low energy. A detailed calculation of the resulting quasi-steady electron energy distribution is beyond the scope of this paper, but this distribution must be thermal at low energies with a power-law tail whose power-law index is . Hence, the thin bremsstrahlung emission, which dominates the radiative cooling of these electrons, has a thermal (thin) bremsstrahlung shape at low energies, with a power-law tail with the same index as the energetic electrons. This behaviour (prior to photoabsorption corrections along the line of sight) may be roughly interpolated by:
| (14) |
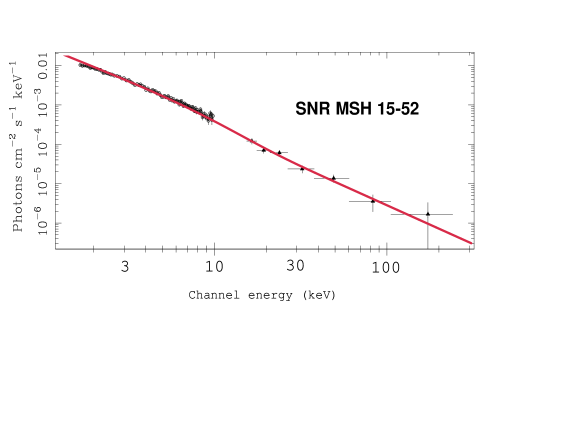
Such “thermal” distributions with the expected power-law tail have been observed in the X-ray emission of some clusters, e.g. by BeppoSAX (e.g. Fusco-Femiano et al. 1999; 2000) and by RXTE (Rephaeli, Gruber & Blanco, 1999). Non-thermal power-law tails in the “thermal” bremsstrahlung emission from plasmas that contain high-energy CRs have also been observed in SN remnants (e.g. Mineo et al. 2001; Dyer et al. 2001), elliptical galaxies (e.g., Guainnazzi & Molendi, 1999), and GRBs (e.g. Dar & De Rújula 2000b; De Rújula 2002; Dar 2003 and references therein).
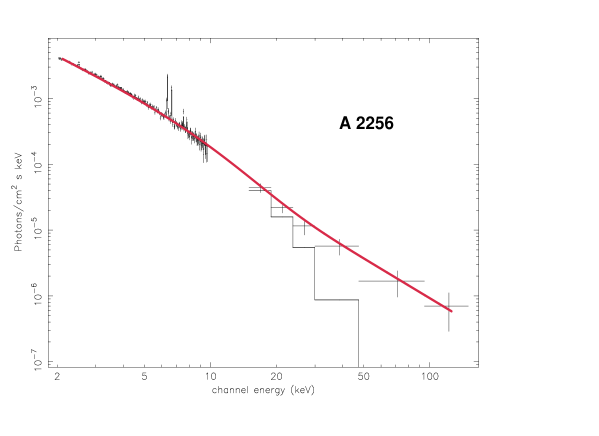
The example of the spectrum of the SN remnant SNR MSH 15-12 (Mineo et al. 2001) is given in Fig. (10), showing that the data can be described by Eq. (14) with , as expected, and (in keV units) and . The figure also shows the spectrum of the cluster A2256 (Fusco-Femiano et al. 2000), for which we used , and . A relatively large in a given cluster is indicative of a large WR supply, so that its central temperature trough should be relatively unpronounced. There are currently no data to test this expected correlation.
We conclude that the observed non-thermal power-law tail of the X-ray emission from CF clusters is but one example of the behaviour of plasmas subject to a high-energy CR flux, and that its presence adds consistency to our contention that the cluster’s plasma is subject to an intense flux of “warming rays”.
9 The radio emission
The diffuse radio emission from the halo or IC medium of clusters was first detected by Large et al. (1959) in Coma, and first studied by Wilson (1970). It is due to synchrotron radiation in the magnetic field of the IC medium, emitted by electrons with Lorentz factors . A detailed discussion of this radio emission is beyond the scope of this paper, but some comments are appropriate.
The radio-emitting electrons lose energy by inverse Compton scattering, with a cross-section cm-2, on the real photons of the cosmic background radiation and on the virtual ones of the cluster’s magnetic field, whose energy densities are eV cm-3 and . The electron’s cooling time:
| (15) | |||||
is very much shorter than the age of the cluster. Consequently, these electrons must be supplied continuously and fairly uniformly over the cluster. In particular, they cannot be supplied by electron-accelerating SN shells, since the electrons’ cooling time is also much shorter than their diffusion time out of the dense regions of galaxies.
In our WR model, the high-energy electrons are supplied —steadily and in a distributed fashion— by the highly relativistic and far-reaching CBs jetted by SNe (and AGNs). The energy of these electrons is locally re-emitted by synchrotron radiation and dominates at radio frequencies.
10 The -ray emission
In a cluster, as we have shown, the CR protons lose about as much energy to knocked-on electrons as they do in hadronic collisions with the IC nuclei. Very roughly, the CR proton spectrum carries comparable kinetic energy above and below 1 GeV. The higher-energy protons, when colliding hadronically, transfer about 1/3 of their energy to ’s, which decay into rays. This implies that the -ray luminosity of a CF cluster ought to be (very) roughly 1/6 of its X-ray luminosity.
The -ray spectrum is hard to ascertain with confidence, one reason for this being that the spectral shape of the parent CRs in a cluster is not known. The spectral shape of the CRs on Earth is affected at low energies by the planet’s magnetic field and, at all but the highest energies, by the energy-dependence of the confining time of CRs in the Galaxy and its halo. Predicting the spectral shape of a cluster’s -ray spectrum, therefore, requires extra assumptions beyond the ones made in this paper.
11 Conclusions
Cooling flow clusters were named after an inference —the flow itself— and not a direct observation. It is therefore not very surprising that further observations led to contradictions. We have seen how an extremely simple model of the origin, luminosity and location of cosmic rays provides a good understanding of the main “cooling flow problem”: the observed temperature profile of these clusters. This Warming Ray model also explains in simple terms the clusters’ X-ray luminosity, its correlation to the optical luminosity, the cluster’s magnetic field intensity, the discrepancy between virial and lensing masses, and the high-energy tail of the X-ray spectra.
The Warming Ray model has no specific consequences regarding other interesting cluster properties —such as their “metal” abundances— but it is part of a non-standard unified view of high-energy astrophysical phenomena, which includes the “natal kicks” of neutron stars, quasar and microquasar emissions, -ray bursts and their afterglows, and the origin and acceleration of cosmic rays.
12 Appendix: Astrophysical Cannonballs
We briefly review the CB model of GRBs, as well as our unconventional views on the CR distribution and luminosity of galaxies (for other reviews and for references, see e.g. De Rújula 2002, Plaga 2002, Dar 2003).
12.1 The cannon
The “cannon”, or engine, producing the jets of CBs, is not understood. We assume that, in a SN explosion, a small fraction of the infalling matter may be jetted along the axis with highly relativistic velocities in a succession of shots, before its reservoir is exhausted. This emission of CBs would be akin to that observed in quasars and microquasars, in which episodes of accretion from a disk or torus into a central compact object result in the axial ejection of relativistic “plasmoids” —or CBs— made of ordinary matter777In the CBs of the micro-quasar SS 433, Balmer H and He lines (e.g. Eikenberry et al. 2001) and the K line of Fe (Migliari et al. 2002) have been observed..
12.2 The GRB
When crossing the SN shell and the matter distribution produced by the “wind” emitted by the progenitor star, the front of a CB is heated to a time-dependent temperature , of keV. The typical initial Lorentz factor of a CB, , follows from the observed energies of the GRB photons which, Doppler-boosted and cosmologically red-shifted, peak at a fraction of 1 MeV. The quasi-thermal radiation a CB emits, boosted and collimated by its relativistic motion, is a single -ray pulse in a GRB. The cadence of pulses reflects the chaotic accretion and is not predictable, but the individual-pulse temporal and spectral properties are.
12.3 The afterglow of a GRB
The ejected CBs, as observed in micro-quasars, are assumed to contain a tangled magnetic field. As they plough through matter, they gather and magnetically scatter its baryonic constituents, mainly protons. The re-emitted protons exert an inward pressure on the CBs, which counters their expansion and makes them reach an asymptotic radius , in minutes of the observer’s time888This mechanism may explain the surprisingly small size of the CBs emitted, for instance, by the Pictor-A quasar (Wilson, Young, & Shopbell 2001). The GRB’s afterglow is dominated by synchrotron radiation by the electrons swept in by the CB in its voyage through the interstellar medium (ISM).
12.4 The generation of CRs
A CB ploughing through the ISM decelerates, and its time-dependent Lorentz factor is explicitly calculable. The ISM nuclei of mass that are simply reflected by the CB’s magnetic field at time recoil with a flat energy distribution extending to . Their time-integrated spectrum is the CR spectrum, extending up to the spectral feature known as the “knee”. The higher-energy spectrum would be due to the ISM nuclei that have been Fermi-accelerated in the CB’s tangled magnetic field before they exit again into the ISM. The overall CR spectrum and the interpretation of its very high-energy “ankle” are discussed in Dar & Plaga 1999. The fraction of the original CB’s energy ending up in electrons is . Thus, the overall efficiency of this mechanism in accelerating CR nuclei is %: essentially all the initial kinetic energy of a CB ends up in CR nuclei.
12.5 The CR luminosity of the Galaxy
What is the total energy of the CRs produced by the jets of CBs emitted in a single SN explosion? In the case of a core-collapse SN leading to the formation of a NS, we may roughly estimate this quantity as follows. The mean sky velocity of neutron stars (Lyne and Lorimer, 1964) is km s-1. Assume this velocity to be due to a “natal kick”: a momentum imbalance between the two jets of CBs emitted axially in opposite directions, as the NS is born. This implies:
| (16) |
with the inequality becoming an equality in the case of a large momentum asymmetry. The total energy per SN ending up in CRs would be of the order of twice the r.h.s. of Eq. (16). 1;2c1;2c The estimated rate of Type II, Ib and Ic supernovae in the Galaxy is per year (van den Bergh and Tammann 1991). The CR luminosity of a Milky-Way-equivalent galaxy would then be given by:
| (17) |
the numerical result being the one quoted in Eq. (1). This is more than one order of magnitude larger than the classic estimate erg s-1, based on the observed ratios of primary CRs to the secondary ones produced by collisions with the ISM (Drury et al. 1989). The alterity can be easily understood: the ISM gas density, volume and grammage used to derive the classic result all refer to a region close to the visible Galaxy. The derivation is invalid (e.g. Longair 1992) if the locally observed CRs may have spent a fraction of their travel-time in a much less dense, though magnetized halo.
12.6 The GBR and the locus of CRs
In Dar & De Rújula 2001a we analysed the possibility that the diffuse Gamma Background Radiation at high galactic latitudes could be dominated by inverse Compton scattering of CR electrons on the cosmic microwave background radiation, and on starlight from our own galaxy. Assuming the mechanisms that accelerate galactic CR hadrons and electrons to be the same —as they are if accelerated by CBs— we derived simple and successful relations between the spectral indices of the GBR above a few MeV, and of the CR electrons and CR nuclei above a few GeV. We reproduced the observed intensity and angular dependence of the GBR, in directions away from the galactic disk and center, without recourse to hypothetical extragalactic sources: the GBR is, we argued, predominantly not “cosmological”.
The above results require that the CR population of the Galaxy extend well beyond its disk. In a model with a fitted gaussian scale height kpc above the Galactic plane, and a scale radius kpc in directions perpendicular to the Galactic axis, we reproduced the observed properties of the GBR. To obtain these results, we assumed the nuclear CRs and the CR electrons to be equally distributed —as they would, if accelerated by CBs—, with their flux ratio fixed to the locally observed value. A scale height of CR nuclei as high as 20 kpc rises the eyebrows of some experts and the swords of referees, but is not excluded by data on relative CR abundances999For the most elaborate models (Strong and Moskalenko 1998) a “leaky-box” scale height of 20 kpc is only some 1.3 above the central value of the most precise observations (Connell et al. 1998); it is perfectly compatible with the average of all previous and somewhat less precise results, 1;2c1;2c1;2ccompiled in Lukasiak et al. 1994.. A CR distribution of this large scale is a “cosmic-ray halo”. Its computed total luminosity, for the fitted values of and , coincides with the “large” value of Eq. (1).
A CR halo of similarly distributed electrons and ions is what is expected if CRs are accelerated by CBs, emitted by SNe close to the galactic disk. A CB of mass and roughly constant cross section , travelling in an interstellar medium of roughly constant density , has its Lorentz factor diminished from to in a distance:
| (18) |
where . By explicitly fitting the spectra and time dependence of the afterglows of all GRBs of known redshift, Dado et al. (2002, 2003a) have found that the fitted values of are distributed over two orders of magnitude, peaking at Mpc, while the values of are narrowly peaked around . It takes a distance kpc for a CB to half its original Lorentz factor, while transferring half of its energy to CRs. We cannot extend with confidence Eq. (18) all the way to and trust the result: afterglow fluences decrease with a large power of and cannot be followed long enough, and one does not expect the approximations of constant and to hold over distances much longer than a few kpc. Be it as it may, Eq. (18) indicates that it takes very much longer for a CB to lose and transfer the other half of its kinetic energy: Mpc in the stated untrustworthy approximations.
References
- Allen et al. (2001) Allen, S. W., Schmidt, R. W. & Fabian, A. C., 2001, MNRAS, 328, L37
- (2) Arabadjis, J. S., Bautz, M. W. & Garmire, G. P., 2001, ApJ, 572, 66
- Binney (2001) Binney, J. J., 2001, astro-ph/0103398
- Blanton et al. (2001) Blanton, E. L., Sarazin, C. L., McNamara, B. R. & Wise, M. W., 2001, ApJ, 558, L15
- Blanton et al. (2002) Blanton, E. L., Sarazin, C. L. & McNamara, B. R., 2002, AAS, 201.0302
- Bohringer et al. (2001a) Bohringer, H., et al. 2001a, A&A, 365, L181
- Bohringer et al. (2001b) Bohringer, H., et al. 2001b, A&A in press (astro-ph/0111112)
- Bohringer et al. (2001c) Bohringer, H., Matsushita, K. & Ikebe. Y., 2001c, astro-ph/0111113
- Bohringer et al. (2002) 1;2c1;2c1;2c1;2c1;2cBo hringer, H., Matsushita, K., Churazov, E., Ikebe, Y. & Chen, Y., 2002, A&A, 382, 804
- Carilli & Taylor (2002) Carilli, C. L. & Taylor, G. B., 2002, ARA&A, 40, 319
- Colafrancesco e& Blasi (1998) Colafrancesco, S. & Blasi, P., 1998, Astroparticle Physics, 9, 227
- Connell (1998) Connell, J. J., 1998, ApJ, 501, L59
- Cowie & Binney (2001a) Cowie, L. L. & Binney, J. J., 1997, ApJ., 215, 723
- Churazov et al. (2002) Churazov, E., Sunyaev, R., Forman, W. & B hringer, H., 2002, MNRAS, 332, 729
- Dado et al. (2002) Dado, S., Dar, A. & De Rújula, A., 2002, A&A, 388, 1079
- Dado et al1;2c1;2c. 2003a (2003a) Dado, S., Dar, A. & De Rújula, A., 2003a, A&A, 401, 243
- Dado et al. 2003b (2003b) Dado, S., Dar, A. & De Rújula, A., 2003b, astro-ph/0302429
- Dado et al. 2003c (2003c) Dado, S., Dar, A. & De Rújula, A. 2003c, astro-ph/0304106
- (19) Dar, A., 1999, Proceedings of “Neutrino Telescopes 1999” (ed. M. Baldo Ceolin), Venice, February 23-26 (astro-ph/9905315)
- Dar 2003 (2003) Dar, A., 2003, astro-ph/0301389
- Dar & De Rújula (2000a) Dar. A, & De Rújula A., 2000a, astro-ph/0008474
- Dar & De Rújula (2000b) Dar. A, & De Rújula A., 2000b, astro-ph/0012227
- Dar & De Rújula (2001a) Dar, A. & De Rújula, A., 2001a, MNRAS, 323, 391
- Dar & De Rújula (2001b) Dar, A. & De Rújula, A., 2001b, ApJ, 547, L33
- Dar & Plaga (2001a) Dar, A. & Plaga, R., 1999, A&A, 349, 259
- David et al. (2001) David, L. P., et al. 2001, ApJ, 557, 546
- ADR (2002) De Rújula, A., 2002, astro-ph/0207033 and New Views on Microquasars , the Fourth Microquasars Workshop, Institut d’Etudes Scientifiques de Cargèse, Corsica, France, May 27 - June 1, 2002. Eds. Ph. Durouchoux, Y. Fuchs, and J. Rodriguez. Center for Space Physics, Kolkata, India, p. 177
- Drury (1989) Drury, L. O’C., Markiewicz, W. J. & Völk, H. J., 1989, A&A, 225, 179
- Dyer et al. (2001) Dyer, K. K., Reynolds, S. P., Borkowski, K. J., Allen, G. E. & Petre, R., 2001, ApJ, 551, 439
- Eilek & Owen 2002 (2002) Eilek, J. A. & Owen, F. N., 2002, ApJ, 567, 202
- Eikenberry (2001) Eikenberry, S. S., Cameron, P. B., Fierce, B. W., Kull, D. M., Dror, D. H., Houck, J. R. & Margon, B., 2001, ApJ, 561, 1027
- Fabian (1994) Fabian, A. C., 1994, ARA&A, 32, 277
- Fabian (2000) Fabian, A. C., 2000, AAS, 196.3413
- Fabian (2002) Fabian, A. C., 2002, Galaxy Evolution: Theory and Observations, Eds. V. Avila-Reese et al. (astro-ph/0210150)
- Fabian & Nulsen (1977) Fabian, A. C. & Nulsen, P. E. J., 1977, MNRAS, 180, 479
- Fabian (2003) Fabian, A.C. & Allen, S. W., 2003, astro-ph/0304020
- Fusco-Femiano et al. (1999) Fusco-Femiano, R., et al. 1999, ApJ, 513, L21
- Fusco-Femiano et al. (2000) 1;2cFusco-Femiano, R., et al. 2000, ApJ, 534, L7
- Grossman (1989) Grossman, S. A. & Narayan, R., 1989, ApJ, 344, 637
- (40) 1;2cGuainnazzi, M. & Molendi, S., 1999, A&A, 351, L19
- Hattori et al. (1999) Hattori, M., Kneib, J. P. & Makino, N., 1999, astro-ph/9905009
- Kaastra et al. (2001) Kaastra, J. S., Ferrigno, C., Tamura, T., Paerels, F. B. S., Peterson, J. R. & Mittaz, J. P. D., 2001, A&A, 365, L99
- Lewis et al. (2001) Kahn, S. M., et al., 2002, astro-ph/0210665
- (44) Large, M. I., Matheson, D. S. & Haslam. C. G. T., 1959, Nature, 183, 1663
- Lewis et al. (2001) Lewis, A. D., Stocke, J. T. & Buote, D. A., 2002, ApJ, 573, L13
- Longair (1992) Longair, M. S., 1992, High energy astrophysics (Cambridge Univ. Press).
- Lukasiac et al. (1994) Lukasiak. A., Ferrando, P., McDonald, F. B. & Webber W. R., 1994, ApJ, 423, 426
- Lyne (1964) Lyne, A. G. & Lorimer, D. R., 1964, Nature, 369, 127
- McNamara (1997) McNamara, B. R., 1997, in Galactic and Cluster Cooling Flows, ed. N. Soker (San Francisco:PASP), 109
- Matsushita et al. (2002) 1;2cMatsushita, K., Belsole, E., Finoguenov, A. & Bo hringer, H., 2002, A&A, 386, 77
- McNamara (2000) McNamara, B. R., Wise, M. W., David, L. P., Nulsen, P. E. J. & Sarazin, C. L., 2000, AAS, 32.13211;2c
- Migliari (2002) Migliari, S., Fender, R. & Mendez, M., 2002, Science, 297, 1673
- Miller & Nichol (2001) Miller, C. J. & Nichol, R. C., 2001, A&A, S198, 6603
- Miller et al. (2001) Miller, C. J., Melott, A. L. & Nichol, R. C., 1999, astro-ph/9912362
- 1;2cMineo et al (2001) Mineo, T., Cusumano, G., Maccarone, M. C., Massaglia, S., Massaro, E. & Trussoni, E., 2001, A&A, 380, 695
- Molendi & Pizzolato (2001) Molendi, S. & Pizzolato, F., 2001, ApJ, 560, 194
- Navarro et al. (1997) Navarro, J. F., Frenk, C. S. & White, S. D. M., 1997, ApJ, 490, 403
- Peterson et al. (2001) Peterson, J. R., et al. 2001, A&A, 365, L104
- Peterson et al. (2002) Peterson, J. R., et al. 2002, astro-ph/0202108
- Plaga (2002) Plaga, R., 2002, New Astronomy, 7, 317
- Rephaeli (1987) Rephaeli, Y., 1987, MNRAS, 225, 851
- Rephaeli et al. (1999) Rephaeli, Y., Gruber, D. E. & Blanco, P., 1999, ApJ, 511, L21
- Rephaeli & Silk (1995) Rephaeli, Y. & Silk, J., 1995, ApJ, 442, 91
- Sarazin (1988) Sarazin, C. L., 1988, X-ray emission from clusters of galaxies (Cambridge University Press)
- Stakek (2003) Stanek, K. Z., et al. 2003, astro-ph/0304173
- Strong (1988) Strong, A. & Moskalenko, I. V., 1998, ApJ, 509, 212
- Tamura et al. (2001) Tamura, T., et al. 2001, A&A, 365, L87
- Van den Bergh (1991) Van den Bergh, S. & Tammann, G. A., 1991, ARAA, 29, 363
- (69) Wilson, M. A. G., 1970, MNRAS, 151, 1
- Wilson et al. (2001) Wilson, A. S., Young, A. J. & Shopbell, P. L., 2001, ApJ, 547, 740
| Cluster | |||||
|---|---|---|---|---|---|
| A1795 | 0.0625 | ||||
| Sersic | 0.0564 | ||||
| Hydra | 0.0539 | ||||
| A2029 | 0.0767 | ||||
| A2052 | 0.0348 | ||||
| EMSS | 0.328 |