11email: nils.bergvall@astro.uu.se 22institutetext: Division of Astronomy, Dept. of Physical Sciences, University of Oulu, FIN-90570 Oulu, Finland
22email: eija@sun3.oulu.fi 33institutetext: Onsala Space Observatory, S-439 92 Onsala, Sweden
33email: susanne@oso.chalmers.se
Galaxy interactions - poor starburst triggers.††thanks: Based on observations collected at the European Southern Observatory, La Silla, Chile.
We report on a study of tidally triggered star formation in galaxies based on spectroscopic/photometric observations in the optical/near-IR of a magnitude limited sample of 59 systems of interacting and merging galaxies and a comparison sample of 38 normal isolated galaxies. From a statistical point of view the sample gives us a unique opportunity to trace the effects of tidally induced star formation. In contrast to results from previous investigations, our global UBV colours do not support a significant enhancement of starforming activity in the interacting/merging galaxies. We also show that, contrary to previous claims, there is no significantly increased scatter in the colours of Arp galaxies as compared to normal galaxies. We do find support for moderate (a factor of 2-3) increase in star formation in the very centres of the interacting galaxies of our sample, contributing marginally to the total luminosity. The interacting and in particular the merging galaxies are characterized by increased far infrared (hereafter FIR) luminosities and temperatures that weakly correlate with the central activity. The LFIR/LB ratio however, is remarkably similar in the two samples, indicating that true starbursts normally are not hiding in the central regions of the FIR luminous cases. The gas mass-to-luminosity ratio in optical-IR is practically independent of luminosity, lending further support to the paucity of true massive starburst galaxies triggered by interactions/mergers. We estimate the frequency of such cases to be of the order of 0.1% of the galaxies in an apparent magnitude limited sample. Our conclusion is that interacting and merging galaxies, from the global star formation aspect, generally do not differ dramatically from scaled up versions of normal, isolated galaxies. No drastic change with redshift is expected. One consequence is that galaxy formation probably continued over a long period of time and did not peak at a specific redshift. The effects of massive starbursts, like blowouts caused by superwinds and cosmic reionization caused by starburst populations would also be less important than what is normally assumed.
Key Words.:
galaxies: interactions – galaxies: evolution – galaxies: starburst – galaxies: halos – galaxies: stellar content1 Introduction
1.1 Historical background and scientific drivers
For a long time it has been known that galaxy interactions and mergers are of fundamental importance for the evolution of galaxies, clusters of galaxies and the intergalactic medium. This became evident when the first deep survey images from HST were analyzed (Abraham et al. abraham (1996)). But already a long time before this, several models focused on the importance of mergers for the evolution of structure in the universe and in the interpretation of the redshift-number density evolution (White white (1979), Frenk et al. frenk (1987), Barnes barnes2 (1990), Rocca-Volmerange & Guiderdoni rocca (1990), Lacey et al. lacey (1993)). The analysis of the HST images allowed a direct morphological study resulting in claims that the merger frequency increases with redshift (e.g. Patton et al. patton (1997), Roche & Eales roche (1999), Le Fèvre et al. lefevre (2000)). These results have immediate implications on our understanding of evolution of the galaxy luminosity function with redshift (Mobasher et al. mobasher (1993)).
In principle, the recent estimates of the extragalactic background light combined with simulations of structure evolution in the early universe could be used to obtain interesting constraints on merger rates, star and galaxy formation processes at high redshifts (e.g. Guiderdoni et al. bruno (1998)). However, it is important to remember that, partly as an effect of loosely controlled sample biases in many previous investigations, there is a lack of quantitative empirical information about the processes that lead to induced star formation. In particular we want to know to what extent and under what conditions (relative masses, gas mass fractions, initial configurations etc.) true starbursts, i.e. corresponding to gas consumption rates Hubble age, can be tidally triggered and which effects starbursts have on the intergalactic medium in terms of outflow rates and initial mass function (IMF).
It is normally assumed that the star formation rate (hereafter SFR) in starbursts is increased with one or two magnitudes to a level at which the gas content of the galaxy will be consumed on a time scale short as compared to the Hubble time. Again, numerical simulations seem to support tidally triggered nuclear starbursts related to bar formation (Noguchi noguchi2 (1988), Salo salo1 (1991), Barnes & Hernquist barnes3 (1991)) or encounters between disks and small satellites (Hernquist hernquist2 (1989), Mihos & Hernquist mihos (1994)).
Observational indications of starbursts in merging and interacting galaxies come in many different flavours. The work by Larson and Tinsley (larson2 (1978), hereafter LT) has had a major influence on the general opinion regarding tidally triggered star formation. Among the other properties used to study the effects of interactions are the H emission (e.g. Kennicutt et al. kennicutt2 (1987)) and the FIR IRAS emission (e.g. Appleton & Struck-Marcell appleton (1987), Kennicutt et al. kennicutt2 (1987), Bushouse et al. bushouse1 (1988), Kennicutt kennicutt3 (1998), Sanders & Mirabel sanders (1996)). Almost all find strong support of tidally induced starbursts. The effect is found to be strongest in the nucleus but the star formation rate is also enhanced in the disk (as a counterexample see e.g. Hummel hummel (1980)). Extended emission in the radio continuum in dusty galaxies as well as direct evidences for global outflows of gas (e.g. Heckman et al. heckman (1990)) have also been put forward as evidence for a dramatically increased supernova activity from a starburst region. Although some of these observations seem compelling, there is no unique way to interpret them. A widely accepted idea is that luminous IRAS galaxies that show no signs of an active nucleus are strong starbursts. Such a generalization is doubtful however, since there are alternative explanations to the observed FIR fluxes. For example Thronson et al. (thronson (1990)) presents a scenario where the fragmentation and disruption of dust clouds may lead to an increase in the efficiency of the dust heating without the addition of new heating sources via a starburst. The warmer dust will result in an increase in the integrated FIR flux. There is, of course, compelling evidence for interacting galaxies having an increase in star formation activity but the important questions are - what is the level of increase and how frequently do these events occur?
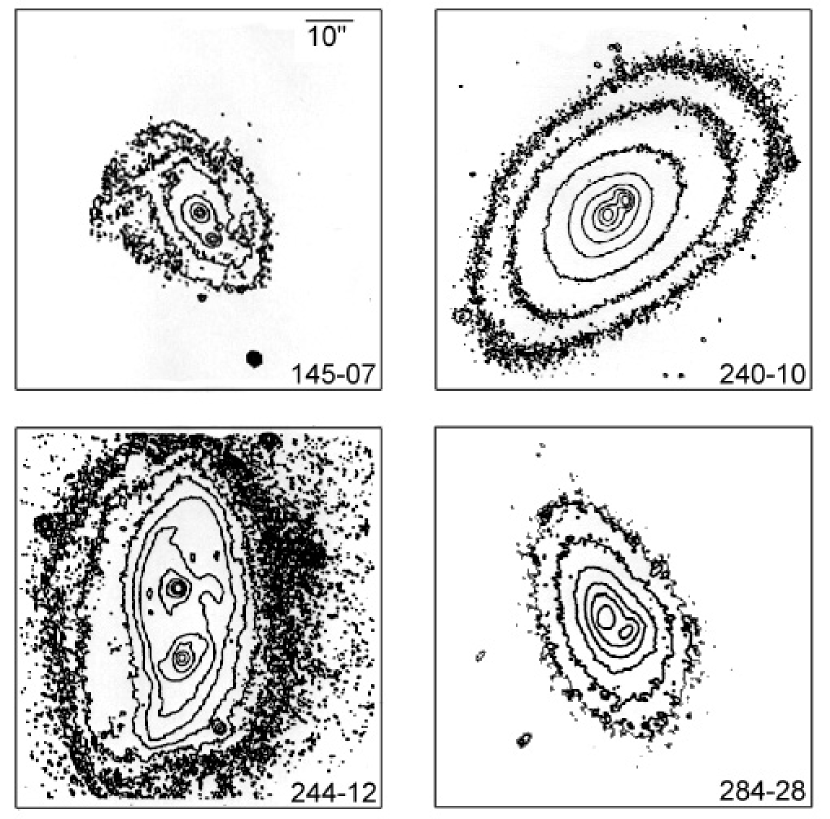
One of the most interesting problems in this context is the origin of elliptical galaxies and massive spirals. Do they essentially form from a single gas cloud at high redshift (the monolithic scenario) or as a result of a series of mergers (the hierarchical scenario)? The hierarchical scenario, first suggested by Toomre (toomre2 (1977)) has been defended by e.g. Schweizer (schweizer3 (1992)) and Kormendy (kormendy (1990)). Strong support of recent mergers and cannibalism in samples of nearby galaxies is found in morphological distortions like tails, shells (Schweizer schweizer1 (1980), Quinn quinn (1984), Schweizer and Seitzer schweizer3 (1992)), boxy isophotes and double nuclei in bright ellipticals (e.g. Schweizer schweizer5 (1999)). A large fraction of our merger candidates also have double nuclei. As an example figure 1 shows images of four merger candidates of various morphological types obtained in the H band (minimizing the risk of misinterpreting the double structure due to extinction effects). Compelling support of hierarchical galaxy formation also comes from observations at intermediate redshifts (Franceschini et al. franceschini (1998)).
| ESO-nr | D” | V | V | B-V | (B-V) | U-B | (U-B) | Reference |
|---|---|---|---|---|---|---|---|---|
| 026- G04 | 31.2 | 12.78 | 1.22 | 0.56 | JB | |||
| 31.2 | 12.92 | 0.14 | 1.11 | 0.11 | 0.62 | -0.06 | Lauberts lauberts (1984) | |
| 109-IG22 W | 31.2 | 12.86 | 0.96 | 0.56 | JB | |||
| 31. | 12.93 | -0.07 | 0.99 | -0.03 | 0.51 | 0.05 | West et al. west (1981) | |
| 110- G22 W | 60.8 | 13.96 | 0.68 | -0.18 | JB | |||
| 62. | 13.82 | 0.14 | 0.73 | -0.05 | Peterson peterson (1986) | |||
| 110- G23 E | 60.8 | 13.29 | 0.85 | 0.19 | JB | |||
| 62. | 13.29 | 0.00 | 0.84 | 0.01 | Peterson peterson (1986) | |||
| 145-IG07 | 31.2 | 14.58 | 0.93 | 0.82 | JB | |||
| 25. | 14.55 | 0.95 | Peterson peterson (1986) | |||||
| 36. | 14.27 | 0.85 | ” | |||||
| 31. | 14.39 | 0.19 | 0.89 | 0.04 | ”, interpolated data | |||
| 148-IG10 | 31.2 | 14.15 | 0.49 | -0.29 | JB | |||
| 25. | 14.50 | 0.50 | Peterson peterson (1986) | |||||
| 36. | 13.97 | 0.47 | ” | |||||
| 31. | 14.20 | -0.05 | 0.48 | 0.01 | ”, interpolated data | |||
| 157- G22 | 31.2 | 11.36 | 0.96 | 0.59 | JB | |||
| 31.5 | 11.36 | 0.00 | 0.96 | 0.00 | Chincarini et al. chincarini (1984) | |||
| 30. | 11.42 | -0.06 | 0.90 | 0.06 | 0.64 | -0.05 | Sandage and Visvanathan sandage2 (1978) | |
| 193- G19 N | 31.2 | 14.38 | 0.87 | 0.90 | JB | |||
| 25. | 14.55 | 0.99 | Peterson peterson (1986) | |||||
| 36. | 14.30 | 0.90 | ” | |||||
| 31. | 14.41 | -0.03 | 0.94 | -0.07 | ”, interpolated data | |||
| 200-IG31 N | 43.4 | 13.69 | 0.84 | 0.38 | JB | |||
| 43.4 | 13.75 | -0.06 | 0.76 | 0.08 | Chincarini et al. chincarini (1984) | |||
| 233- G21 | 31.2 | 12.61 | 1.00 | 0.52 | JB | |||
| 60.8 | 12.16 | 0.98 | 0.49 | JB | ||||
| 30. | 12.57 | 0.04 | 0.92 | 0.08 | 0.51 | 0.01 | Sandage and Visvanathan sandage2 (1978) | |
| 52. | 12.28 | -0.12 | 0.94 | 0.04 | 0.48 | 0.01 | Shobbrook shobbrook (1966) | |
| 236- G01 | 86.6 | 11.01 | 0.80 | 0.00 | JB | |||
| 89. | 10.95 | 0.06 | 1.06 | -0.26 | 0.47 | -0.47 | Alcaino alcaino (1976) | |
| 249-IG31 | 86.6 | 12.34 | 0.36 | -0.31 | JB, Johnson filters | |||
| 86.6 | 12.28 | 0.35 | -0.34 | ” | ||||
| 87. | 12.11 | 0.13 | 0.38 | -0.02 | -0.29 | -0.02 | Bergvall et al. bergvall5 (1978) | |
| 284- G28 S | 31.2 | 12.67 | 0.97 | 0.42 | JB | |||
| 12.64 | 0.98 | 0.38 | Lauberts lauberts (1984) | |||||
| 12.69 | -0.02 | 1.01 | -0.04 | 0.36 | 0.06 | Sandage & Visvanathan sandage2 (1978) | ||
| 286-IG19 | 22.9 | 14.70 | 0.61 | -0.06 | JB | |||
| 22. | 14.79 | -0.09 | 0.53 | 0.08 | -0.02 | -0.04 | Bergvall et al. bergvall5 (1978) | |
| 287- G17 | 43.4 | 13.20 | 1.01 | 0.48 | JB | |||
| 43. | 13.29 | -0.09 | 0.95 | 0.06 | Sadler sadler (1982) | |||
| 299- G07 | 86.6 | 11.65 | 0.81 | 0.14 | JB | |||
| 81. | 11.68 | -0.03 | 0.79 | 0.02 | Peterson peterson2 (1982) | |||
| 91. | 11.56 | 0.09 | 0.78 | 0.03 | 0.10 | 0.04 | Griersmith griersmith (1980) | |
| 91. | 11.53 | 0.12 | 0.79 | 0.02 | 0.11 | 0.03 | Griersmith griersmith (1980) | |
| Mean , m.e. | 0.01, 0.11 | 0.02, 0.06 | 0.01, 0.04 | * | ||||
| Median | 0.00 | 0.02 | 0.01 | |||||
| Median | 0.06 | 0.04 | 0.04 | |||||
| *) ESO 236-G01 excluded |
| ESO-nr | v | n | |
| km s-1 | km s-1 | ||
| 073-IG32 S | 5305 | 103 | 4a,0e |
| 079-IG13 E | 11557 | 107 | 3a,0e |
| 079-IG13 W | 11526 | 12 | 3a,1e |
| 079- G16 | 5661 | 11 | 0a,9e |
| 080-IG02 W | 7509 | 38 | 0a,4e |
| 080-IG02 E | 7301 | - | 1a,0e |
| 085-IG05 | 6160 | 49 | 0a,3e |
| 105- G26 W | 10911 | 131 | 3a,1e |
| 108-IG18 W | 8010 | 49 | 2a,1e |
| 108-IG18 E | 7908 | 17 | 0a,7e |
| 108-IG21 | 3423 | 69 | 3a,5e |
| 109-IG22 E | 3291 | 64 | 6a,0e |
| 109-IG22 W | 3320 | 19 | 4a,0e |
| 110- G22 W | 9755 | 41 | 6a,4e |
| 110- G23 E | 10189 | 19 | 3a,0e |
| 112- G08A | 10167 | 16 | 5a,0e |
| 117- G16 | 10612 | - | 0a,1e |
| 143- G04 | 15218 | 30 | 3a,2e |
| 145-IG07 | 8540 | 27 | 3a,0e |
| 145-IG21 N | 19869 | 18 | 2a,2e |
| 145-IG21 S | 20145 | 36 | 1a,8e |
| 148-IG10 | 3201 | 53 | 1a,4e |
| 151-IG36 W | 3233 | 119 | 1a,4e |
| 151-IG36 E | 3349 | 37 | 11a,7e |
| 157-IG05 | 1141 | 48 | 2a,2e |
| 157-IG50 W | 3760 | 37 | 0a,9e |
| 186- G29 N | 2708 | 49 | 2a,1e |
| 187-IG13 S | 12838 | - | 0a,1e |
| 187-IG13 N | 13654 | 39 | 1a,1e |
| 188-IG18 W | 4922 | 54 | 3a,5e |
| 188-IG18 E | 4761 | 27 | 3a,6e |
| 193- G19 N | 10291 | 27 | 4a,2e |
| 199- G01 | 9046 | 141 | 2a,2e |
| 200-IG31 N | 12462 | - | 0a,1e |
| 200-IG31 S | 11422 | - | 0a,1e |
| 205- G01 | 546 | 17 | 0a,9e |
| 235-IG23 S | 6678 | 98 | 4a,0e |
| 235-IG23 N | 6725 | 62 | 3a,1e |
| 240- G10 | 3474 | - | 1a,0e |
| 240- G10 NW | 3315 | 100 | 2a,0e |
| 240- G01 W | 15406 | 42 | 9a,0e |
| 243- G15 N | 7014 | 46 | 5a,1e |
| 244- G12 N | 6274 | 8 | 2a,8e |
| 244- G12 S | 6339 | 18 | 3a,6e |
| 244- G17 W | 6910 | 40 | 3a,2e |
| 244- G17 E | 6954 | 48 | 2a,2e |
| 244-IG30 | 7193 | 60 | 3a,3e |
| 244- G46 E | 5908 | 99 | 3a,1e |
| 245- G10 | 6070 | - | 1a,0e |
| 249-IG31 | 329 | 68 | 0a,5e |
| 284- G28 S | 3049 | - | 1a,0e |
| ESO-nr | v | n | |
| km s-1 | km s-1 | ||
| 284-IG41 N | 4932 | 119 | 4a,0e |
| 284-IG41 S | 5165 | 41 | 8a,1e |
| 284-IG45 | 5324 | 201 | 4a,0e |
| 284-IG48 | 5152 | 128 | 2a,2e |
| 285- G04 | 15979 | 155 | 3a,0e |
| 285- G13 | 3115 | 65 | 4a,0e |
| 285-IG35 | 9002 | 73 | 3a,1e |
| 286-IG19 | 12975 | 57 | 3a,4e |
| 287- G40 | 8976 | 96 | 1a,1e |
| 288- G32 E | 6058 | - | 1a,0e |
| 288- G32 W | 7325 | 90 | 3a,6e |
| 290- G45 | 2378 | 137 | 5a,7e |
| 293- G22 N | 6681 | 66 | 2a,2e |
| 297- G11 W | 4822 | 111 | 2a,3e |
| 297- G12 E | 4848 | 146 | 2a,4e |
| 299-IG01 N | 5366 | 153 | 5a,0e |
| 299-IG01 S | 5773 | 148 | 3a,4e |
| 303- G17 W | 3834 | 98 | 2a,0e |
| 306- G12 S | 10994 | - | 1a,0e |
| 340- G29 | 9283 | 14 | 2a,2e |
| 341-IG04 | 6225 | 72 | 6a,0e |
| 342-IG13 N | 2754 | 19 | 0a,5e |
| 344- G13 S | 10639 | 63 | 5a,5e |
| ESO-nr | v | n | |
| km s-1 | km s-1 | ||
| 015- G05 | 4919 | 30 | 6a,1e |
| 026- G04 | 2921 | 24 | 7a,1e |
| 027- G14 | 4591 | 21 | 0a,5e |
| 047- G19 | 3135 | 52 | 5a,0e |
| 048- G25 | 11262 | 33 | 0a,2e |
| 052- G16 | 8079 | 23 | 5a,0e |
| 074- G26 | 3246 | 51 | 2a,2e |
| 105- G12 | 4127 | 44 | 5a,0e |
| 106- G08 | 3248 | 29 | 2a,1e |
| 109- G15 | 3552 | 34 | 6a,0e |
| 114- G16 | 7171 | 82 | 3a,0e |
| 151- G43 | 5051 | 73 | 2a,2e |
| 153- G01 | 6885 | 26 | 5a,0e |
| 153- G33 | 5772 | 24 | 4a,2e |
| 157- G22 | 958 | 36 | 8a,0e |
| 193- G09 | 6156 | - | 1a,0e |
| 197- G18 | 5893 | 128 | 6a,0e |
| 201- G12 | 1045 | - | 0a,1e |
| 200- G36 | 1064 | 41 | 3a,3e |
| 233- G21 | 3140 | 27 | 8a,0e |
| 236- G01 | 2450 | 55 | 6a,0e |
| 240- G12 | 1819 | 14 | 0a,6e |
| 242- G05 | 6004 | 29 | 7a,0e |
| 285- G13 | 3115 | 65 | 4a,0e |
| 287- G17 | 5385 | 15 | 6a,0e |
| 287- G21 | 6232 | 9 | 1a,1e |
| 293- G04 | 1806 | 24 | 1a,4e |
| 298- G27 | 5189 | 9 | 2a,0e |
| 299- G07 | 1743 | 20 | 1a,5e |
| 299- G20 | 1686 | 36 | 1a,8e |
| 303- G14 | 6208 | 27 | 4a,5e |
| 304- G19 | 6478 | 21 | 10a,0e |
| 340- G07 | 6100 | 28 | 3a,3e |
| 341- G32 | 2792 | - | 0a,1e |
| 345- G49 | 2475 | 26 | 1a,2e |
It has long been suspected that strong interactions and mergers may trigger nuclear activity. Indeed, most of the quasar host galaxies show distorted morphologies, reminiscent of the aftermaths of mergers (McLeod & Rieke 1994a , 1994b , Bachall et al. bachall (1997)). It is not immediately clear however, that the reverse situation is true. Even though Dahari (dahari1 (1984)) first suggested that Seyferts have more frequently companions than the non-active galaxies, this probably is not the case. Laurikainen & Salo (laurik2 (1995)) have reviewed that in that kind of comparisons the apparent controversies between different authors can be largely explained by selection effects. Also, Barton et al. (barton (2000)) shows no elevation in counts of Seyferts and active galaxies among galaxies in pairs.
The major goal with the present work is to try to quantify the effects of interaction on star formation and nuclear activity in a unique way. We will compare two samples of galaxies. One sample contains isolated pairs of interacting galaxies and merger candidates and the other consists of isolated single galaxies.

2 The samples and data extraction
Several samples of interacting and merging galaxies have been used in previous studies in order to tackle the issues discussed above. However, few are based on selection criteria that open a possibility to relate the results to the galaxy population in general in an unbiased way. The results from these studies consequently are contradictive.
Here we discuss a spectroscopic/photometric study of a magnitude-limited sample of interacting and merging galaxies and of isolated galaxies for comparison. The samples are presented by Johansson & Bergvall (johansson3 (1990), henceforth JB). It is based on a catalogue by Bergvall (1981a ) containing about 420 interacting galaxies and merger candidates and a comparison sample of about 320 isolated galaxies from the ESO/Uppsala Quick Blue Survey (holmberg (1980), lauberts2 (1982)). In Bergvall’s sample a merger is defined as an isolated galaxy (no obvious companion within a projected distance of 6 diameters) with a strongly distorted morphology. Based on the statistics of the large sample of galaxies Bergvall (1981b ) argues that a substantial part of these cases actually may be interacting pairs with the separation vector closely aligned with the line of sight, causing one component to hide the other from view. These hidden pairs are appearing as mergers in our sample. If it is assumed that the major/minor axes ratios of the cases classified as mergers are the same as that of the major components in strongly interacting pairs, almost all such cases may be major components of close pairs that are hiding the companions. In the following, for simplicity, we will sometimes use the word merger although it would be more proper to say merger candidate since we cannot claim to have sufficient information to prove that all merger-like cases are true mergers.
From the catalogue we selected 59 pairs and clear cases of mergers (hereafter IG) complete down to about mB = 14.50.3 mag. for a spectroscopic/photometric study. The non-interacting comparison sample contained 38 isolated galaxies (hereafter NIG). These were defined as galaxies having no neighbours (with a magnitude difference 2 magnitudes) closer than 6 diameters and having not more than 2 neighbours within 16 diameters. The limiting magnitude is the same as for the IG sample but the sample is not required to be complete (see below the discussions regarding the morphological selection and the luminosity function). In Bergvall and Johansson (bergvall1 (1995), henceforth BJ) we published the images, colour maps, spectra and energy continuum distributions of the IGs. Here some of the remaining optical data and an analysis of the global and nuclear star formation properties of the two samples are presented.
Since the following discussion will result in conclusions that deviate from those of many previous investigations of similar samples it is important to compare our criterion of what we regard as a galaxy with distorted morphology with that of others. A suitable comparison sample is the Arp-Madore sample of southern peculiar galaxies and associations (Arp & Madore arp2 (1987)), obtained from a region of the sky including our sample. We find that 84% of our galaxies are included in the Arp-Madore catalogue. Among the remaining 11 cases, a few are wide pairs, others are pairs with low luminosity companions and some may be dwarf galaxy mergers.
In the following discussion it is also important to be aware of the possible selection effects occurring when we compare the two samples. The basic idea of this investigation is to find out what kind of changes appear in the physical conditions when galaxies are subject to interactions and mergers. If, as is often argued, the mean luminosity increases and the spectral distribution changes, it will influence the luminosity function. If one wants to compare non-interacting with interacting galaxies it would therefore be wrong to demand that the luminosity functions of the two samples should agree. Should this demand be applied it would e.g. result in a bias towards higher masses of the sample of non-interacting galaxies if interactions lead to an increasing star formation rate. If IGs normally live in environments where mergers are more frequent than in normal environments, this will also cause a shift of the luminosity function causing ambiguities.
The method we will use here is to select a comparison sample of isolated galaxies with a distribution of morphological types and luminosities that agrees reasonably well with that of the galaxies originally involved in the interaction/merging. All efforts to find out the differences between interacting and normal galaxies by comparing two different samples have their problems, since we a priori do not know the differences in evolutionary history of IGs and NIGs, but we think that our approach will lead to a result that will be concise and straightforward to interpret. It is impossible to derive the original properties of the galaxies of the IG sample but we can do our best to make a classification of the IGs and then make an appropriate selection of galaxies in the comparison sample that have morphologies that we think reasonably well represent those of the galaxies in the IG sample. In the original classification system that Bergvall used, the galaxies were morphologically classified according to: E: ellipticals or S0s; S-: early spiral galaxies; S+: late type spirals and irregulars; S: spiral galaxies difficult to classify; D: dwarfs; C: compact galaxies and G: unclassifiable. In this system, the two different samples under study here have the following distributions of morphological types. IGs: 27% E, 25% S-, 27% S+, 10% S and 10% G. NIGs: 31% E, 36% S-, 31% S+ and 1% S. If one only compares the relative numbers of the galaxies with reliable classification, the match between the morphological types is good (34/31/34 % and 31/36/32 % respectively). With few exceptions (Kennicutt et al. kennicutt2 (1987)) there is no other similar investigation that has taken into account the effects of morphological selection. Therefore they run a severe risk of biasing when comparing samples of interacting and noninteracting galaxies.

One may worry that the morphological selection may have introduced a bias in the LF of the NIG sample. This should not be a problem since we throw out only about 15% of the galaxies in the total sample of NIGs down to the limiting magnitude from Bergvalls original catalogue. Still, it seems to be a fact that the IG sample contains a larger proportion of luminous galaxies, despite that the limiting magnitude of the two samples is the same. Could there be other biases involved in the selection? We will make two tests that will demonstrate that this is not a problem.
Fig. 2 shows the distribution of total apparent B magnitudes of the NIG sample plotted against radial velocity. The magnitudes were obtained from LEDA (the Lyon-Meudon extragalactic database, through the CISM of the Lyon Claude-Bernard University) and have been corrected for galactic extinction (Burstein & Heiles burstein (1984)). The original magnitude limit (mB= 14.50.3 mag.) has been indicated and the agreement is good. A few additional isolated galaxies, used later in this paper, have also been included to increase the contrast at the high luminosity tail. As we can see from the diagram, and as will be confirmed in the next section, there does not seem to be any problem with the completeness at the high luminosity tail since it seems to be reached already at rather low redshifts. Fig. 3 shows the LF of the NIG sample (not including the ’extra’ isolated galaxies), as obtained after volume corrections of the numbers at each magnitude bin, assuming constant space density of the galaxies. A comparison with the LF of field galaxies (Ramella et al. ramella (1999)) shows that there is a relative underrepresentation of bright galaxies in our NIG sample. The evolution of isolated galaxies differ however from normal field galaxies in the sense that the field galaxies in the mean have experienced more merger events. If we apply a compensation for this fact by adding 0.5m to our NIG sample, corresponding to the increase in luminosity of a typical L∗ galaxy due to mergers between z=1 and 0 (Le Fèvre et al. lefevre (2000)), we obtain full agreement.

Now we will discuss a second approach that more directly supports our claim of completeness. Fig. 4 shows the distribution in the redshift-magnitude diagram of isolated galaxies (isolation class:0) obtained from the list of isolated galaxies by Karachentseva (Karachentseva kara1 (1973), Karachentseva et al. kara2 (1997)). The limiting magnitude is mV=15.7. This is deeper than the limiting magnitude of our sample. Thus is is possible to compare the two samples, one definitely reaching completeness at the high luminosity tail, as is seen from the figure, and the second our comparison sample. As the diagram shows, there is no doubt that we reach the high luminosity tail of the LF at v 5000 km s-1, i.e. below the velocity limit of our sample. To quantify this fact we show in Fig. 5 a comparison between the LF of our sample and that of Karachetseva. The V magnitudes of our sample have been calculated from the LEDA B magnitude data and transferred to V, using our B-V data. A correction of 0.2 magnitudes was then applied on our V magnitudes to approximately correct for the difference in galactic extinction between our sample and Karachentsevas. A zeropoint correction term of 0.5 magnitudes was also added to our data. This correction is based on a comparison between LEDA data of a few of the brighter galaxies in the Karachentseva sample but the exact value to within a fraction of a magnitude is not important for the result of the comparison. As we see from the diagram the LFs agree well within the statistical noise exept in the fainter end where the dwarfs in our sample normally were given a lower weight in the selection since they do not occur frequently in the IG sample. We also note that there is no lack of luminous galaxies in our sample as one might have suspected. Instead there is a small overrepresentation at higher luminosities that probably is due to the morphological selection. But the differences are small and one has to keep in mind that it is not completely adequate to compare the samples since one was selected on V magnitudes while our galaxies were selected on B magnitudes. Anyway, these discussions show that the LF of our sample is representative of a sample of isolated galaxies at the same time as it has a relevant morphological distribution in comparison with the IGs.

In Tables 1-5 the results of the spectroscopy of the central 1.5”x3” of the sample galaxies are presented. The fact that the redshift distribution is different for the IG and NIG will result in a different mean absolute size of the sampled central region. However, based on estimates by Carter et al. (carter (2001)) , the effect on the equivalent widths will be insignificant in our case. Tables 2-4 contain the radial velocity data and Tables 5-6 the emission line flux densities. The emission line data were corrected for atmospheric and Galactic extinction as described in BJ. The line intensities were measured by fitting a gaussian profile to the observed line profile. Blended lines were deblended by assuming the wavelength shift between the lines to be known and then applying an optimized double gaussian fit. The underlying continuum was approximated with a straight line. Each line measurement was tagged with a weight that was calculated from the noise statistics in the gaussian fit. The weight depends on the noise in a manner that was derived from measurements of synthetic spectral lines that were degraded with different amounts of noise. The velocities were then calculated from the weighted mean of the absorption or the emission lines separately. Some emission lines, like [OIII]4959, are sometimes strongly hampered by Telluric atmospheric emission lines and are therefore not included in the tables. Normally the error in the line intensities are estimated to be about 10% for the brighter lines and about 20% for the weakest ones tabulated.
Throughout this paper we will assume a Hubble parameter of H0=70 km s-1 Mpc -1.
3 Star formation properties
3.1 Introduction
The idea that interacting galaxies experience an enhanced star formation activity as compared to noninteracting galaxies was permanently established by LT in their analysis of the broadband UBV colours. They compared two different samples at a Galactic latitude b 20∘ - the noninteracting galaxies taken from the Hubble Atlas of Galaxies by Sandage (sandage (1961); hereafter Hubble galaxies) and interacting galaxies from Arp’s Atlas of Peculiar Galaxies (arp (1966); hereafter Arp galaxies). LT found that 1) the scatter in the U-B/B-V diagram was significantly larger for the interacting than for the noninteracting galaxies and that 2) there was a shift in the distribution of the interacting galaxies towards bluer B-V and U-B relative to the noninteracting galaxies. Based on spectral evolutionary models, their interpretation was that the major cause of both these effects was a significant increase in SFR among the interacting galaxies. In the most extreme cases the colours and luminosities correspond to a consumption of most of the available gas in less than a few times 107 yr. Following the work by LT, a number of investigations have examined other criteria of recent star formation and to a large extent confirmed the findings by LT (e.g. Keel et al. keel (1985), Kennicutt et al. kennicutt2 (1987), Bushouse bushouse2 (1986), Sekiguchi & Wolstencroft sekig (1992)). These criteria include H , FIR and radio continuum but none of these criteria is really univocally related to star formation so one should always take care to discuss also other possible sources.
Below we will discuss the implications of the broadband photometry, the spectroscopy of the central regions and the FIR luminosities in the context of starburst activity.

3.2 Optical data
3.2.1 Global properties
| ESO-nr | H | H | H | [OII] | [O III] | [N II] | [S II] | [S II] |
| 6563 | 4861 | 4340 | 3727 | 5007 | 6584 | 6717 | 6731 | |
| 079-IG13 W | 33 | - | - | - | - | - | - | - |
| 079- G16 | 2170 | 507 | 182 | 1180 | 1260 | 472 | 217 | 207 |
| 080-IG02 W | 31 | 11 | 4.0 | 28 | 6.8 | 5.6 | 4.7 | 4.0 |
| 085-IG05 | 11 | 1.9 | - | 6.1 | 3.3 | 2.9 | 3.7 | - |
| 105- G26 W | 2.2 | -0.6 | -3.9 | - | - | 0.9 | - | 1.2 |
| 108-IG18 W | 329 | 65 | 27 | - | - | 146 | 63 | 38 |
| 108-IG18 E | 156 | 27 | - | - | 50 | 46 | 48 | 27 |
| 108-IG21 | 72 | 13 | - | 25 | 5.1 | 24 | 26 | - |
| 110- G22 W | 16 | - | - | 3.4 | 4.1 | 5.6 | 4.5 | - |
| 110- G23 E | 16 | - | - | - | - | 17 | - | - |
| 117- G16 | 16 | - | - | - | - | - | - | - |
| 143- G04 | 86 | 16 | - | - | - | 79 | - | - |
| 145-IG21 N | 3.1 | - | -1.5 | - | - | 3.3 | - | - |
| 145-IG21 S | 44 | 6.7 | 2.3 | 11 | 4.5 | 20 | 14 | - |
| 148-IG10 | 31 | 9.0 | 2.8 | 28 | 2.4 | 10 | 10 | - |
| 151-IG36 W | 37 | 11 | - | 72 | 17 | 8.8 | 11 | - |
| 151-IG36 E | 88 | - | -3.6 | - | 74 | 90 | 33 | - |
| 157-IG05 | 18 | 4.3 | - | 6.5 | - | 4.5 | 4.3 | - |
| 157-IG50 W | 16 | 2.5 | - | 16 | 8.0 | 1.0 | 3.4 | 2.1 |
| 187-IG13 S | 5.4 | - | - | - | - | 0.2 | - | - |
| 187-IG13 N | 1.6 | - | - | - | - | - | 1.4 | - |
| 188-IG18 W | 25 | 1.6 | -0.6 | 7.0 | 2.6 | 12 | 4.9 | 5.9 |
| 188-IG18 E | 70 | 8.6 | 2.9 | 9.0 | 5.4 | 29 | 30 | - |
| 193- G19 N | 4.0 | - | - | 7.3 | - | 11 | 3.4 | 2.2 |
| 199- G01 | 105 | - | - | - | - | 55 | 12 | 16 |
| 200-IG31 N | 40 | - | - | - | - | - | - | - |
| 200-IG31 S | 6.6 | - | - | - | - | - | - | - |
| 205- G01 | 101 | 30 | 16 | 102 | 105 | 3.3 | 7.7 | 5.3 |
| 235-IG23 N | 5.2 | - | - | - | - | - | - | - |
| 243- G15 N | - | -5.6 | -2.7 | - | - | 3.8 | 11 | - |
| 244- G12 N | 390 | 29 | 5.9 | 21 | 26 | 214 | 48 | 40 |
| 244- G12 S | 26 | 7.4 | - | 16 | 5.6 | 12 | 5.1 | 4.5 |
| 244- G17 W | -0.2 | 1.9 | -0.6 | - | 5.7 | 2.4 | - | - |
| 244- G17 E | 133 | 32 | 13 | 7.3 | 36 | -11 | 4.4 | 3.5 |
| 244-IG30 | 33 | 7.5 | - | 37 | 11 | 10 | 11 | 9.0 |
| 244- G46 E | -1.5 | -6.8 | - | - | - | 2.7 | - | - |
| 249-IG31 | 116 | 28 | 9.1 | 75 | 60 | 18 | 15 | 5.5 |
| 284-IG41 S | 11 | -6.7 | -1.0 | - | - | 6.8 | 5.7 | - |
| 284-IG48 | 6.8 | - | -1.4 | - | - | 2.1 | 1.6 | 0.6 |
| 285-IG35 | 3.2 | -0.8 | - | 8.5 | - | 2.3 | - | - |
| 286-IG19 | 245 | 41 | - | 154 | 46 | 89 | 75 | 53 |
| 287- G40 | - | -0.5 | - | - | - | 1.3 | - | - |
| 288- G32 W | 22 | 3.2 | -0.7 | 7.7 | 2.7 | 6.7 | 6.8 | - |
| 290- G45 | 76 | 11 | - | 24 | 9.2 | 26 | 27 | - |
| 293- G22 N | 47 | - | - | - | - | 26 | - | - |
| 297- G11 W | 97 | 10 | - | 12 | 6.6 | 43 | 12 | 8.9 |
| 297- G12 E | 50 | 5.3 | - | 8.8 | 5.3 | 28 | 11 | 27 |
| 299-IG01 S | 25 | 3.2 | 1.5 | 12 | 2.7 | 16 | 4.8 | 1.7 |
| 306- G12 S | 4.8 | - | -1.2 | - | - | 1.6 | - | - |
| 340- G29 | 19 | -3.8 | - | - | - | 6.6 | 6.5 | 2.7 |
| 342-IG13 N | 66 | 8.6 | -6.8 | 39 | 14 | 20 | 13 | 9.6 |
| 344- G13 S | 10 | 1.4 | - | - | - | 2.7 | - | 5.1 |
| 285-IG35 | 3.2 | -0.8 | - | 8.5 | - | 2.3 | 4.7 | 1.1 |
| ESO-nr | H | H | H | [OII] | [O III] | [N II] | [S II] | [S II] |
| 6563 | 4861 | 4340 | 3727 | 5007 | 6584 | 6717 | 6731 | |
| 015- G05 | 9.9 | -5.1 | -2.3 | - | - | 23 | - | - |
| 026- G04 | - | -1.1 | - | - | - | 11 | - | - |
| 027- G14 | 35 | 5.4 | - | - | - | 14 | 3.9 | 1.9 |
| 048- G25 | 7.9 | - | - | - | - | 1.2 | - | - |
| 074- G26 | 17 | - | - | - | - | 6.8 | - | - |
| 106- G08 | 10 | - | - | - | - | 5.5 | - | - |
| 151- G43 | 2.8 | - | - | - | - | 0.3 | - | - |
| 153- G33 | 3.5 | - | - | - | - | 2.9 | 1.1 | 0.8 |
| 201- G12 | 13 | - | - | - | - | - | - | - |
| 200- G36 | 22 | -4.6 | - | - | - | 12 | 4.3 | 2.9 |
| 240- G12 | 21 | 3.6 | - | 14 | 5.9 | 7.0 | 7.6 | 2.7 |
| 287- G21 | 8.7 | - | - | - | - | - | - | - |
| 293- G04 | 11 | - | -8.1 | 24 | 3.1 | 3.3 | 2.5 | 1.9 |
| 299- G07 | 269 | 30 | - | - | - | 128 | 24 | 21 |
| 299- G20 | 269 | 33 | 13 | - | 5.0 | 139 | 22 | 20 |
| 303- G14 | 79 | 13 | - | 11 | 7.6 | 48 | 11 | 7.6 |
| 340- G07 | 6.0 | - | - | - | 6.9 | 9.0 | - | - |
| 341- G32 | 4.8 | - | - | - | - | - | - | - |
| 345- G49 | 11 | -2.0 | - | - | - | 4.4 | - | - |

Fig. 6 shows the two-colour diagram based on our photoelectrically obtained UBV data and Fig. 7 shows the corresponding cumulative distributions. The colours have been corrected for Galactic extinction according to Burstein & Heiles (burstein (1984)). The apertures used in the photometry have been chosen so that they approximately correspond to the effective diameters. The error cross in the figure is the estimated total standard deviation in the colours. The estimate is based on a few unrelated factors. We estimate the internal uncertainty due to instrumental effects to about 0.02 mag. To this is added the effect due to the problem with the photometric quality of the night, the accuracies of the stardard stars, the centering of the aperture and the fact that we do not make any effort to homogenize our data to a standard diameter. The effects of the first three problems can be estimated from the data we have obtained here and from other investigations we have carried out, where we have collected many observations of the same galaxy in the same diaphragm. An independent check of the consistency of our data is obtained from comparisons with results from other groups. Table 1 lists all galaxies in our sample for which there exists comparable photometry from other studies. In general the agreement is very good. One strongly deviating case is ESO 236-IG01. We cannot judge what could be the explanation of this and we therefore exclude it in the discussion. The median difference between our remaining data and data from other groups are 0.01 mag. in U-B and 0.02 in B-V and the median of the individual deviations are 0.04 mag. in both colours. The morphological type dependent relations between colours and aperture/effective diameter, presented in diagrams in RC3 (de Vaucouleurs et al. dev4 (1991)) was used to obtain estimates of the uncertainty in the colours due to the fact we do not use a standard diameter. We finally adopted (U-B)=0.08 and (B-V)=0.06.


For comparison Fig. 6 also displays the predicted evolution of a dust free star forming galaxy with solar abundances and a Salpeter initial mass function (Zackrisson et al. erik (2001)). Two extreme star formation scenarios were assumed: 1) a burst with a duration of 108 yr and 2) a continuous star formation. As is seen, the predicted colours agree reasonably well with the mean colours of the samples. As expected, the model with a short burst followed by passive evolution fits the galaxies of elliptical type while the model with continuous star formation fits better the irregulars and spiral galaxies. But no model within a metallicity range of 0.01-2 times solar can explain the colours in the lower (large values of U-B) left part of the distribution. A comparison with predictions from other models (Fioc & Rocca-Volmerange fioc1 (1997), fioc2 (2000); Worthey worthey (1994)) can not remedy the situation. We note that similar, ”deviating” colours are also found in e.g. the sample of spiral galaxies by Gavazzi et al. (gavazzi (1991)).
Somewhat surprisingly, we do not see the same trends as seen in the LT data. As in their corresponding diagram, the IGs also here have a larger dispersion than the NIGs but only slightly so. What is more interesting is that instead of a blue excess, the envelope of the IGs shows a small red excess basically in U-B relative to the noninteracting galaxies. Why is our result different from that of LT?
There may be a suspicion that a difference in mean absolute luminosity between our two samples would introduce a systematic difference in the colours according to the well established colour-luminosity relationship. Later we will indeed claim that the LF of the IGs extends to significantly higher luminosities than the NIGs. Luminous galaxies tend to be redder than less luminous ones so if we compare galaxies drawn from a normal sample, the mean colours would correlate with mean luminosities. Whatever the reason may be, it is interesting to ask whether it would be possible that this effect could hide a blue excess caused by increased star formation triggered by the interaction.
We have estimated the effect of this possible bias from the study of normal galaxies carried out by Jansen et al. (jansen (2000)). From Fig. 5c in their paper we estimate the trend in B-R to d(B-R)/dM0.07, for both early and late type galaxies. The mean magnitude difference between the NIG sample and the IG sample is 1 mag, which would result in a difference of 0.07 mag. in B-R. Assuming the corresponding difference in B-V to be approximately the same and in U-B to be slightly smaller (Jansen’s et al. Fig. 5d), a possible effect of differences in absolute magnitudes would shift the distributions of the IGs and the NIGs in the two-colour diagram to make them come somewhat closer but not to change the relative positions. This is completely insignificant for the results. In addition we would like to point out that our results in this paper indicate that interacting galaxies are likely to have experienced more mergers than isolated galaxies. This would tend to reduce differences in colours betweeen galaxies of different luminosities when compared to the monolithic evolutionary scenario thus making the estimated colour difference even smaller.
Let us for a while assume that the IGs have a significantly increased star formation. Could the effect be masked by reddening effects due to different distribution and amount of dust in the NIGs vs. the IGs? It cannot exclusively be due to an increased effect of dust relative to the NIG sample since the slope of the envelope for the internal reddening is steeper than the reddening vector in the normally assumed ”screen” dust distribution. Also, the effect of dust would be to shift the sample of interacting galaxies above, not below that of the noninteracting galaxies in the two color diagram. The effects of dust on broad-band colors may even be smaller than often suggested, because of the wavelength-dependent effects of dust absorption (reddening) and scattering (blueing), which may largely compensate each other in a dusty interstellar medium (Mathis mathis (1970)). A detailed study of the effects of dust on broad-band colors has been carried out by Witt et al. (witt (1992)), who estimated the reddening effects by including scattering of light and making the calculations for star and dust distributions imitating different astrophysical environments. Witt et al. point out the fact that a small reddening will be obtained both in galaxies with a small amount of dust and in very dust rich starburst galaxies where the dust is centrally concentrated such that it hides most of the light from the central starburst. The latter situation may occur if the dust during a close interaction or in a merger is redistributed such that a substantial part of it is brought to the centre. This would clean up the ”off-centre” regions and make the centre more opaque. This is a possible explanation of the different distributions of the IGs and NIGs in our two-colour diagram.
But let us return to the comparison with the LT results. There are important differences between their sample and ours. Firstly, the galaxies in our sample were obtained from a catalogue limited to a region at Galactic latitude -30∘, with the purpose to avoid problems of Galactic extinction. The lower limit in Galactic latitude by LT was 20∘ and thus Galactic extinction starts to become a problem. However, LT did not correct for Galactic extinction. According to them Galactic extinction could not cause the dispersion in the diagram, because the reddening line is in the same direction as the slope of the distribution of the galaxies in the diagram (internal reddening is supposed to be even less important but this may be debated). However, the lack of attention to the effects of Galactic extinction at low latitudes certainly can explain part of the differences between LT and us.
A second reason for the disagreement with LT and us may be the differences in sample homogeneity. Our samples were selected from a magnitude limited catalogue compiled by the same person and the photometry was obtained by the same team using the same instrumentation. On the other hand, while the Hubble galaxies are all nearby well studied galaxies, often having detailed photometry out to large distances, the Arp objects are significantly more distant and have less frequently good photometric data available. One would suspect that this could induce an increased scatter in the Arp sample. LT claim that the mean error in the measurements is more or less the same in the two samples. However, a remarkable fact is that the photometric errors of the individual Hubble galaxies are significantly larger (about a factor of 3) than the scatter in the two-colour diagrams by LT.
An additional contribution to the differences found by LT and not by us may lie in the selection of galaxies. The LT sample is biased towards the most dramatic cases of closely interacting galaxies and mergers and thus is not representative for this type of galaxies. They also include blue compact galaxies, Seyfert galaxies and ”peculiar” galaxies in general. They do not discuss the effects of differences in the distribution of morphological types in the two samples but from their diagrams one gets the impression that there is an underrepresentation of late type galaxies in the Hubble sample. This may have an important impact on their result.
The results found by LT were also discussed by Bergvall (1981a ) who compared the colours of noninteracting galaxies taken from RC2, based on statistics of a larger sample than the Hubble galaxies, with a sample of galaxy pairs, different from our sample here. He found that the difference between interacting (based on data from RC2) and noninteracting galaxies as regards the dispersion perpendicular to the correlation in the colour-colour diagram disappears. Bergvall’s conclusion was that there was no difference between interacting and noninteracting galaxies as regards the scatter in the U-B/B-V diagram.
We have reconstructed the diagram of UBV colours of Arp galaxies as based on the total magnitudes available in NED. We show the result in Fig. 8. All data have been corrected for galactic extinction according to Burstein & Heiles (burstein (1984)). The NED photometry of NGC 1241 disagrees strongly with more recent data from LEDA and this galaxy was not included in the diagram. NGC 1596 was also not included because of the large uncertainty in the extinction correction. We note differences between our diagram and Fig. 1. of the work by LT. The spread of the data is smaller in our diagram and the distribution is more gaussian with the data more concentrated towards the mean Hubble distribution, especially at the blue and red edges. This fact is a consequence of an increased quality in the data and supports our suspicion that the error bars in the LT diagram are too small, leading to the erroneous conclusion that the intrinsic scatter of the Arp galaxies is dramatically larger than that of the normal Hubble galaxies. The error box in the LT Fig. 1 corresponds to a mean error in both colours of 0.04 magnitudes. As they say in the figure caption, this is obtained from RC2. This is hard to understand since the median error of the corresponding sample, of similar size, obtained from RC3 is 0.13 magnitudes. Once we adapt the RC3 value, that should be more correct, the data points of all galaxies in our Fig. 8 are within the quoted errors. No extra scatter is needed to explain the distribution perpendicular to the major trend.
To clarify this point we have indicated with a box (the small hatched box) in the diagram the location of normal Hubble galaxies according to de Vaucouleurs (dev3 (1977)). The galaxies are obtained from RC2 and the colours have been corrected for galactic extinction. Originally the colours were also corrected for the redshift (the K-effect) but we have readjusted these corrections to correspond to the median redshift of the Arp galaxies (4950 kms-1) according to the same procedure as used by de Vaucouleurs in RC2 (dev (1976)). Before including the data to calculate mean colours, de Vaucouleurs rejected those that deviated more than 2, thus restricting the final data sample to galaxies showing normal behaviour. The width of the box corresponds to 3 standard deviations of the mean colors (3 x de Vaucouleurs’ parameter). To compare with the Arp galaxies we also display in the diagram the same ’Hubble box’ but increased to a size that corresponds to the median observational errors of the Arp galaxies ((U-B)=(B-V)=0.13 mag.). If there is no extra scatter among the Arp galaxies compared to normal Hubble galaxies and the distribution is gaussian we thus expect almost 100% of the galaxies to be located within the box. This is in fact the case. Thus there is no support from the global broadband colours of an increased star formation activity triggered by the interactions. We also note that the distribution of the Arp galaxies agree well with our data but that the scatter is slightly larger for our galaxies. This may be a consequence of a larger morphological diversity among our data and the fact that our data have not been homogenized to total magnitudes whereas the NED data are homogenized.
Fig. 9 shows the Arp data in comparison with evolutionary tracks derived from our spectral evolutionary models. We find that the observations agree very well with the model predictions. As shown also in fig. 6, we find no galaxies along the first part of the evolutionary tracks. This is probably a consequence of internal extinction. In our studies of luminous blue compact galaxies we have found that the extinction we derive from the H/H emission line ratio typically amounts to a little less than AV=1 magnitudes. If we apply this amount of extinction to the late type galaxies in the diagram the evolutionary track will follow the right hand side of the envelope of the colour distribution of the Arp sample. We conclude that all galaxies in the diagram would fit into the traditional model of galaxy evolution where the stellar population has a Salpeter IMF and where massive galaxies consume the gas faster than the low mass galaxies. The scatter of the UBV data gives no support of interaction induced star formation and definitely not of starbursts.
The reason we have devoted so much space for discussion of the now rather old result by LT is that it still has such an impact on our concept of tidally induced star formation. We conclude that there is no strong support of a significant difference between the global optical colours (and thus neither in global SFRs) of noninteracting and interacting/merging galaxies in our samples nor in the Arp sample with available photometry.

3.2.2 Nuclear properties
Even if we see no tendency for increased star formation in the global colours, the colours of the very central regions behave differently. To obtain the colours, we integrated the spectra using a top-hat transmission function with a width of 100 Å. We study two colours. The first is m4150-m5500, roughly corresponding to B-V. The second is based on the Balmer jump, represented by m3900-m4150. The advantage with using this colour is that it is only weakly dependent on extinction (typically 0.1m). The m3900-m4150 index grows monotonically with spectral type and is a measure of star formation activity. This can be seen in Fig. 10, showing the colour plotted against the equivalent width of H . We see a clear correlation between the two parameters. We also see that H emission is mostly found in objects with blue colours, m3900-m4150 0.4.

Figure 11 shows the two-colour diagram of the galaxies. Here one clearly sees that, as m4150-m5500 becomes redder, a significant difference in the distribution appears between IG and NIG. A possible explanation is that the IGs have experienced a major star formation event more recently than the NIGs which would shift the 3900-4150 index towards the blue. Another explanation could be that the young stars in the IGs are more centrally concentrated. A third possibility is that the colours of the IGs are more affected by dust as the increased star formation activity is located mainly in the central regions. Probably all three effects contribute.

It is interesting to compare this result with two spectral line parameters, H and [OIII]5007/H , shown in Fig. 12. These data were derived from the same spectra of the central regions as the data in Fig. 11. In Fig. 12 the same trend as in the previous diagram is seen - a support for an increased SFR in IGs. The relative number of galaxies with measurable [OIII] lines are much higher in the IG sample than in the NIG sample (34 and 13% respectively). 58% of the IGs and 47% of the NIGs show H . A Kolmogorov-Smirnov test of the equivalent width of H (W(H) ) shows that the probability that the two samples are drawn from the same population is 17%. Thus, even if the support is weak, central star formation is more frequent in interacting and merging galaxies, confirming the previous findings. Our result is also in the same line with the previous study by Laurikainen & Moles (laurik3 (1989)), who used H intensity to show that star formation in interacting systems in comparison to isolated galaxies is pronounced mainly only in the central regions of the galaxies. The increase in SFR we find in our sample is modest however. The mean W(H) is 40 Å and 16 Å for the IGs and NIGs, respectively. This result agrees well with two other investigations of the nuclear (i.e. non-global) properties. One is the study of the difference between Arp galaxies and isolated spiral galaxies by Keel et al. (keel (1985)) and the other a study of interacting pairs by Donzelli & Pastoriza (donzelli (1997)). None of these investigations were however based on magnitude limited samples.
The difference in W(H) between IGs and NIGs that we obtain corresponds to a difference in SFR of a factor of 2-3 in the mean. Thus it is not relevant to talk about starbursts except for a few cases. Possible effects due to differences in luminosity functions could change these numbers with not more than about 10% (Carter et al. carter (2001)). Although a direct comparison is not possible due to the difference in the contribution from old stars to the stellar continuum, true starbursts as those one may witness in some blue compact galaxies (cmp. Terlevich et al. terlevich (1991)), have W(H) much larger, of the order of several 100 Å. Moreover, the [OIII]5007/H ratios of the dwarf starbursts are several times higher than in our sample of IGs. We may compare the increase in SFR obtained from W(H) with that derived from radio continuum data. Hummel et al. (hummel2 (1990)) studied a large sample of spiral galaxies and found that those involved in interaction had a nuclear radio continuum emission 5 times stronger than the more isolated ones and that the radio emission was correlated with the activity in HII regions. Taking into account that the IGs appear to have a higher gas mass (see the discussion below), and assuming the star formation rate being correlated with the gas mass, there seem to be an agreement between our result and that of Hummel et al..
Another relevant issue is the frequency of AGNs. The increased level of excitation in the interacting galaxies seems not to have resulted in Seyfert-type activity in them. By using the criteria by Osterbrock (osterbrock (1991)) we found only 2 Seyferts (244-G17W and 151-IG36E) among the interacting galaxies, which means 4% , and none in the comparison sample. The frequency of 4% we obtained is similar as found for samples of interacting and noninteracting galaxies in previous investigations. Dahari, dahari2 (1985), and Keel et al. keel (1985) used a field galaxy sample composed of the samples by Keel (keel2 (1983)) and Stauffer (stauffer (1982)) and found that the contribution of Seyferts in the NIG-sample was 4.6% and 5.6% respectively, the fraction of Seyferts in IG samples being rather similar. Barton et al. (barton (2000)), using a different sample, found that 4% were Seyferts. On the other hand, our comparison sample is so small that in the same frequency level of active galaxies no Seyferts would be expected. 16% of the IGs display LINER like properties with [NII]6584/H 0.7 and [OIII]5007/H 3. Within the statistical uncertainties, this is equal to the relative number of LINERs in an apparent magnitude limited general sample of galaxies (20%; Ho et al. ho (1997)). There are too few NIG spectra available to allow for a statistically reliable estimate of this number.
3.3 Near-IR data
Fig. 13 shows the near-IR J-H/H-K two-colour diagram of the galaxies that were sufficiently bright to measure. The observations were carried out with apertures that cover a substantial part of the galaxy and are in this sense comparable to the optical data for global galaxy properties. But we will see that a larger portion of the near-IR emission probably originates from the nuclear region than the optical data do. Fig. 13 shows that while the comparison galaxies are contained within a well defined sequence close to the distribution of red supergiants, the interacting galaxies show a significantly larger scatter. Since this cannot be due to dust extinction (cf. the reddening arrow in the diagram), the reason has to be found in the properties and spatial distribution of the stellar population and the emission from circumstellar and interstellar gas and dust and possible AGNs. AGNs are normally situated in the right hand part of the diagram (e.g. Spinoglio et al. spinoglio (1995)). The mean H-K of Seyfert 1:s is 0.840.33, i.e. significantly separated from the envelope of the IGs. The mean H-K of Seyfert 2:s is 0.610.37 which is just at the edge of the IG distribution. The effects of emission from hot dust and nebular emission have been indicated in the figure. It seems likely that the spread of the IGs can be traced to such processes, possibly mixed with weak AGN activity.
The fact that the photometric properties of the IG and NIG samples differ strongly in the near-IR but not in the optical seems to indicate that a substantial part of the energy production in IGs is taking place in regions that are heavily enshrouded by dust. This is not necessarily an indication of hidden starburst activity. One should also consider effects of shock heating caused by infalling clouds, possible hidden AGN activity and the consequences of different distribution of gas and dust relative to the stars and other heat sources in the two samples.

3.4 Far-IR data
Figs. 14a and 14b show the histograms of the FIR luminosities and the dust temperatures of the galaxies in the IG and NIG samples. The luminosities and temperatures are based on the IRAS 60 and 100 fluxes from the Faint Source Catalogue (Moshir et al. moshir (1990)). When these fluxes were used in combination with optical/near-IR data in the discussion below, they were corrected for IRAS aperture confusion - thus the total magnitudes of interacting pairs were used when the IRAS aperture covered both galaxies of the pair. Absolute luminosities were calculated from the equation LFIR = 5.5e5 r2 (2.58f60+f100) L⊙ (Lonsdale & Helou lonsdale (1985)) where r is the distance in Mpc and f is in Jy:s. We see that there is a significant difference both in the distribution of the IRAS luminosities and in mean dust temperatures between the samples. The IGs are brighter and hotter than the NIGs thus confirming the results from previous studies of interacting galaxies (Young et al. young1 (1986), Kennicutt & Keel kennicutt1 (1984), Bushouse et al. bushouse1 (1988), Telesco et al. telesco (1988), Laurikainen & Moles laurik3 (1989), Xu & Sulentic xu (1991), Liu & Kennicutt liu (1995)). One would normally draw the conclusion that this is due to an increased SFR and/or efficiency in interacting galaxies. However, Fig. 14c hints at an alternative explanation. The diagram shows the ratio between the FIR and blue luminosities (based on aperture photometry approximately at the effective radius). Contrary to what one would expect, judging from results from previous studies (e.g. Liu & Kennicutt liu (1995)), the distribution is essentially the same for the two samples. We applied a Kolmogorov-Smirnov test to the data in the three cases shown in the diagram and found that the probabilities that the samples are drawn from the same population are 0.6% when the IRAS temperatures were tested, 0.3% for the luminosities and 34% for the FIR/B data. Thus, while the distributions of the 60/100 ratios and the IRAS luminosities are significantly different, the FIR/B ratios are not.
In the previous section we concluded that the star formation activity is significantly higher only in the central region of IGs as compared to NIGs. However, even if one assumes that the difference in the nuclear W(H) between IGs and NIGs represents a difference in global SRF, the measured increase is insufficient to account for the enhanced IRAS 60 and 100 m fluxes in the IG sample. The difference in dust temperature can explain part of the increase in luminosity but rather modest. If we assume an emissivity of B, with 1.42.0 (Lisenfeld et al. lisenfeld (2000)), only a 60% increase of the enhanced FIR emission can be explained. Thus, the difference between IGs and NIGs in the FIR flux may not primarily be due to different SFRs but to different mass and different distribution of stars and dust. On top of this there may be additional energy sources. These include hidden AGNs and mechanical heating when the potential energy is released from infalling gas clouds. Those sources are expected to be important in massive systems but are likely to play a minor role here. It appears that the main difference between the NIGs and the IGs is the scale in mass. One possible explanation is that, although originally having a similar luminosity function as the NIGs, IGs now have become brighter than NIGs because they are located in a richer environment so that they merge more frequently and thus build up the masses faster.

As an example we show in Fig. 15 and 16 the merger NGC 1487 in the B and H bands. The B image was obtained with the equipment described by Bergvall & Johansson (bergvall1 (1995)) and the H image was obtained in August 1993 with ESOs IRAC2 near-IR camera equipped with a 256x256 NICMOS detector. While the optical image shows the chaotic signature of a starburst, the near-IR image reveals the smoother structure of the old stellar component. From a Sky Survey image one may get the impression that there are two gas rich galaxies merging but it seems more likely from the images that the galaxy is involved in a process of a merger between several dwarf galaxies forming a small group. There is an increasing observational evidence that this is a common phenomenon at high redshifts. E.g. Colina et al. (colina (2001)) show that multiple mergers of sub-L∗ galaxies is the dominating process in ultraluminous galaxies (ULIGs).
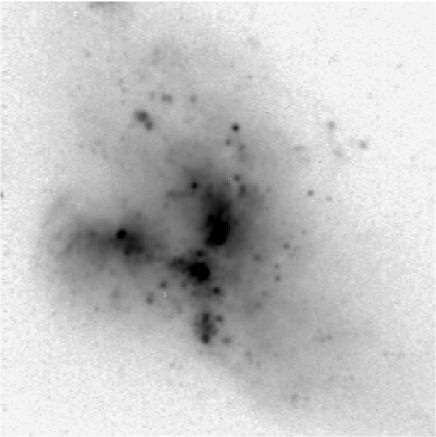
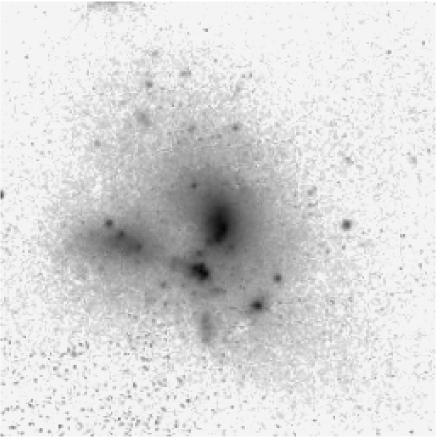
The difference between how we view a merger through the optical window versus the near-IR has an impact on our concept of the process in the same way as our ignorance of the HI component when we look at images in the optical. There is a difference between the result if we merge two massive galaxies or if we merge a group of dwarf galaxies even if the final luminosity is the same. For one thing the relative gas mass and thus the SFR will be higher in the former case, mimicking a starburst. There is also a difference in the visual perception that will influence the interpretation. The epoch of maximum merger rate probably relates to the mean galaxy density of the local universe. Regions of high densities had their most active merger epoch at higher redshift while regions of intermediate densities are sites of the peak merger activity today. During this epoch there should be an increase in relative gas mass fraction compared to ’passive’ galaxies since the subunits in the mean have a higher gas mass fraction than a single galaxy of equal total luminosity. In such case one would expect that the gas mass fraction and consequently the SFR is higher than in an isolated galaxy of similar mass. The increase in SFR can thus be understood without invoking an increase in star formation efficiency (SFE).
It is interesting to relate this discussion to some results from CO observations. Aalto et al. (susanne1 (1991), susanne2 (1995), susanne3 (1997) and susanne4 (2000)) found unusually large R=12CO/13CO intensity ratios in a sample of luminous mergers. This was interpreted as a consequence of turbulent, high-pressure gas in the centres. In a related study, Taniguchi & Ohyama (taniguchi (1998)) find that both the dust and the 13CO gas are depressed with respect to the 12CO gas in mergers with high FIR luminosities. This would tend to increase the dust temperature if it is assumed that the radiation density is unchanged. Mass estimates show however that the dust mass is also higher than normal in these galaxies, despite the depression in dust/gas ratio. The authors conclude that the high FIR luminosity of the mergers can be explained as a combination of an increased dust temperature and a higher dust mass than normal, caused by a high merger frequency of gas and dust rich companions. Starbursts that produce supernova shocks causing sputtring and grain-grain collisions have been proposed to explain the depression of the dust grain content. However, high velocity shocks occur also in the merger event itself and could be a valid alternative and it seems that on the whole, the observations seem to support a scenario with several combined effects behind the high FIR luminosity.


How do the IRAS data correlate with the optical star formation signatures? One should keep in mind that we sample regions of different sizes in different wavelength regions. The IRAS aperture is of the order of 1 arcminute, i.e. larger than the optical and near-IR apertures and much larger that the apertures used for the spectroscopy. Fig. 17 shows the FIR temperature index f60/f100, the m3900-m4150 index, W(H) and J-H plotted against the FIR luminosity. Except for U-B these indices are only weakly extinction dependent. We see no strong correlation between these indices and the FIR luminosity in these diagrams but we note that the two samples are clearly separated in the W(H) and the 3900-4150 index diagrams. Fig. 18 shows the situation as regards the FIR temperature, represented by the f60μ/f100μ ratio. No correlation is found with the global U-B colours but significant correlations are found in the the m3900-m4150 and W(H) diagrams. It seems that warm IRAS galaxies tend to have more active star formation in the central regions than colder IRAS galaxies. This does not necessarily mean that the SFE is higher.
Fig. 19 shows the relationship between the absolute blue magnitude and the FIR luminosity. In order to improve the statistics, we included an extra set of isolated galaxies obtained from Bergvall’s original list (1981b ). The ESO numbers of these galaxies are: 73-09, 74-18, 85-24, 85-47, 143-13, 237-15, 285-20, 287-52, 303-20, 341-23. These have well determined B magnitudes and IRAS fluxes, all obtained from the NED database. In the cases where photometric photometry was not available we used the total B magnitudes from NED and added a correction term of 0.2 mags. to adapt to the mean difference between our measured photometry and the total B magnitude from NED.
We see a strong correlation between B-magnitudes and FIR-fluxes. It is important to note that the isolated galaxies follow the same relation as the interacting and merging galaxies. The interacting galaxies are shifted relative to the isolated ones with an amount corresponding to a factor of a few in FIR luminosity (cmp. Fig. 14). Thus if the FIR radiation measures star formation activity, it means that the data indicate an increase in SFR of the same magnitude, due to the interaction. This is quite moderate as compared to the general notion about induced star formation in such systems. True starbursts are exceptional and we notice that, in comparison with established massive starbursts like NGC 6240 and Arp 220 (see positions in the figure) we find only one such case in our sample - ESO 286-IG19 (Johansson johansson4 (1991)).
However, there is an alternative interpretation of the different distributions of IGs and NIGs in figure 19 that deserves a discussion. The solid lines in the diagram show the linear regression lines (MB as function of LFIR and vice versa) of the complete data set (excluding NGC6240 and Arp 220) and the hatched line is the bisector line. The equation of the bisector line is MB = -1.703(0.005) log LFIR -2.41 and the correlation coefficient is 0.8. Using a simple model we will show that one may predict the value of the slope, -1.7. In the model we will assume that a star forming region is a 3-dimensional structure that is opaque in the optical but transparent in the far infrared. We will also assume that the mean gas density and the SFE is independent of the mass of the gas available for star formation. Then the IRAS luminosities would simply scale as the volume V (or the total mass) of the star forming region. The B luminosity, remembering that the model assumes that the bulk of the blue light originates from a thin surface layer, would grow as V2/3. We would thus expect to find a relationship = -1.7 log LFIR, in perfect agreement with the empirical slope. If the SFE increases with luminosity, as would be the case for starbursts, the slope would become flatter. This is what is observed if one compares the low luminosity galaxies of our sample with the FIR starbursts NGC 6240, Arp 220 and ESO 286-IG19, suspected to host starbursts.

We conclude that, at least as concerns the specific sample discussed here, both the lack of correlation between the FIR and global optical/near-IR data and the slope of the relation between the optical and FIR luminosity favour a model where the bulk of the FIR luminosity comes from regions of normal star formation activity. The overluminosity in the IG sample as compared to the comparison sample may essentially be explained as a difference in mean mass, relative gas mass fraction, spatial distribution of gas, stars and dust between the two groups and the effect of shocks in mergers. Since mass determinations of interacting galaxies are often dubious, possible systematic mass differences are difficult to check but we show below that the IGs have higher gas masses. A mass difference is not unexpected, since statistically one would expect to find the more massive galaxies in regions where mergers are frequent. These mergers would involve gas rich low mass galaxies with relatively high SFRs as compared to more massive systems and therefore the mean SFR in the IG sample would automatically be higher than in the NIG sample, disregarding the possible effects of tidal effects and mergers. We would thus predict that IGs have 1) higher masses than isolated galaxies and 2) higher relative HI content than normal galaxies of the same mass.


3.5 Neutral gas
CO-observations of part of our sample were obtained by Horellou & Booth (horell1 (1997), horell2 (1999)). The results can in principle be interpreted in terms of increased SFR in the IG sample, because the SFE, measured as / (H2), is somewhat higher for them. However, this difference may as well be related to different distributions of stars and dust. Solomon & Sage (solomon (1988)) also argue that the observed high SFE in late interacting systems may arise from an underestimation of the H2 mass in these galaxies by the CO luminosity.

If the SFE increases as a consequence of the interaction, one would expect LFIR/LB to increase with gas mass. There is no such trend (Fig. 22) for those galaxies in our samples that have measured HI and/or H2 masses. Most of the data for the IG sample were obtained from Horellou & Booth (horell1 (1997)). Data for the rest of the galaxies were obtained from NED. When only HI masses were available, corrections to convert these data to total hydrogen gas masses were done, using the morphological classifications and the relationship between morphological types and the HI /H2 mass ratio from Young & Scoville (young3 (1991)). Figure 23 shows the gas masses as a function of LFIR. Although the data are scarce, two things are evident from the figure: 1) The hydrogen masses are higher for the IGs with roughly by a factor of 2-3; 2) As seen from the shape of the upper envelope of the distribution, there is roughly a linear relationship between (HI+H2) and LFIR. Both these results agree with a model in which the differences in the IRAS data between the samples to a significant amount are due to differences in gas mass. The statistics are poor, but if we assume that there is a difference in gas mass of a factor of 2-3 and also remember that the IGs in the mean have higher FIR temperatures, that will boost the total FIR emission, the difference in FIR luminosity can be fully accounted for. The three probable massive starbursts Arp 220, NGC 6240 and ESO 286-IG19 clearly deviate from the rest of the sample. The estimated star formation rates in these three galaxies, of the order of 100 yr-1 or more (Kennicutt kennicutt4 (1998), Johansson johansson2 (1990)), are indeed outstanding.
4 Tidal action
Part of the dispersion for interacting galaxies in the color-color diagram may also be related to different orbital geometries of the encountering galaxies. The importance of orbital geometry on reactivity of galactic disks was addressed already by Toomre & Toomre (toomre1 (1972)). The star formation properties of the encountering galaxies depend, among other things, on the orbital inclination, on the sense of the spinning of the disks and the mass distribution in the galaxies. The effects of orbital inclination on star formation has been discussed for example by Salo & Laurikainen (salo2 (1993), salo3 (2000)) for the pairs NGC 7753/7752 (Arp 86) and M51. They demonstrated that in NGC 7753/7752, where the companion moves nearly in the main galactic disk mass transfer to the companion is possible, whereas in M51, for the nearly perpendicular orbit of the companion it is not allowed.
It would be interesting to investigate in more detail how interaction affects star formation both in the disk and in the centre. At this stage we will only discuss the possible correlation between the strength of the tidal interaction between the two components of the system and the parameters already discussed, W(H), m3900-m4150 and the IRAS temperature. As a rough measure of the strength of interaction we will use the Q1 and Q2 parameters, defined by Dahari & de Robertis (dahari (1988)). The interesting result (Fig. 20 and Fig. 21) is that none of the star forming parameters show any strong correlation. Only dust temperature shows a weak rather insignificant correlation in Fig. 20 and only the mergers show high temeratures. This could be understood as an effect of a redistribution of the dust towards the centre, probably leading to a more efficient heating of the dust by the old stars (e.g. thronson (1990)). It means that, on average, the star formation seen in the IGs is not much ruled by the strength of the interaction. The orbital parameters have been shown to be important for mass transfer under certain conditions (e.g. as in NGC 7753/7752) but these events are rare and the induced events of star formation may be shortlived. Conditions for true starbursts may be more frequent in mergers and related to their internal structure rather than the orbital parameters of the preceding close encounters (Mihos & Hernquist mihos (1994)). The total mass and relative gas content are other important parameters.

5 Discussion
As mentioned above, there is only one true massive starburst galaxy in the sample. Our IG sample constitutes of 8% of the total number of galaxies in the ESO/Uppsala catalogue at the same magnitude limit. If our sample is representative of galaxies in general, it also means that about 0.1% of a magnitude limited sample are massive starbursts generated by interactions and mergers. On the other hand virtually all luminous infrared galaxies (ULIRGS) have distorted morphologies (Joseph & Wright joseph (1985), Armus et al. armus (1987), Sanders et al. sanders2 (1988), Clements et al. clements (1996), Murphy et al. murphy (1996)), indicating recent mergers. This leaves little room for other mechanisms that could trigger massive starbursts. Therefore the figure is likely to hold also for the total population of such cases. Such rare phenomena have no important influence on the mean star formation rate of galaxies in general. This conclusion agrees qualitatively with that of Kennicutt et al. (kennicutt2 (1987)) although they claim a higher rate of ”active galaxies”. It also agrees with the result from Allam‘s study of IRAS data of interacting galaxies (Allam allam (1996)) and is supported by the lack of influence of interactions on the ratio between the FIR and the 2.4 Ghz radio emission found by Lisenfelt et al. (lisenfeld2 (1996)).
But what is the situation like at higher redshifts? The evolution of the merger rate with redshift is apparently an important parameter. The results from recent studies are somewhat contradictive. From model comparisons with ISO and optical data Roche and Eales (roche (1999)) find support for a strong evolution to z1 and estimate the merger rate to increase with redshift as (z+1)2. The large observational redshift survey projects, however, seem to show no evolution (Carlberg et al. carlberg (2000)) in this redshift interval. Infante et al. (infante (1996)), working at slightly lower redshifts, are somewhere in between. At even higher redshifts there are no strong indications of a further increase in merger rate of luminous galaxies. Thus, for the upper part of the LF one would not expect more than a few times increase in merger rate to z 1.5 and then insignificant changes towards higher redshifts. If massive starbursts increase at the same rate, it would mean that less than a few times 0.1% of a magnitude limited sample of galaxies would be involved in massive starbursts. Since the SFR in such cases is enhanced with at least one magnitude it could be of significance for the mean gas consumption rate but for a typical galaxy, most stars would form in a more quiescent phase.
If tidally induced massive starbursts would dominate the star formation process at z=1 most of the metals would also be formed at this epoch since the gas consumption time scale would be of the order of a few 108 yr. From recent observations it is quite evident that this is not the case. Star formation activity at higher redshifts can also be studied directly. The largest sample of spectroscopically confirmed high redshift galaxies selected by narrow band infrared imaging was investigated by Moorwood et al. (moorwood (2000)). They derived star formation rates from the H fluxes. The peak rates they found were in the range 20-35 yr-1 without extinction correction (but the observations indicate low extinction). The velocity dispersions implied masses around 1010. The gas consumption timescale is thus of the order of the age of the universe at that redshift. These objects should not be labeled starburst galaxies. It seems more likely that these galaxies, being the brightest in the sample, are ellipticals in the formation phase exposed to continuous infall of gas clouds and dwarf galaxies.
Recent SCUBA results (Lilly et al. lilly (1999)) open the possibility for a significant portion of hidden massive starbursts but the interpretation of the infrared data is not univocal. Possibly, and maybe a major part of the emission is powered by AGNs (Lilly et al. lilly (1999)). From these data one cannot reach any conclusion regarding if starbursts of the Arp 220 type have a significant influence on the gas consumption and metal production at high redshifts.
6 Conclusions
We have discussed the star formation properties of a magnitude limited sample of interacting and merging galaxies (IGs) in comparison with a sample of isolated galaxies (NIGs) of similar morphological types. In particular we have compared a number of star formation signatures. The global optical colours do not support a significant increase in star formation activity in the IG sample. On the other hand the colours of the central regions differ which can be understood as a combination of extinction effects and a larger proportion of young stars. The H equivalent widths of the centres (although hampered by small number statistics), are 2-3 times higher in the IG sample indicating a modest increase in star formation activity in these regions. However, equivalent widths characteristic of true starbursts are rare. Starbursts do occur in our sample but are very uncommon or shortlived. In the general case we do not find any strong support that interactions and mergers trigger true starbursts. This is in conflict with the generally accepted view founded by Larson & Tinsley (larson2 (1978)), in which interactions are causing significant changes in global broadband colours, typical of an increasing contribution from young stars. We show that this result, based on a comparison between Arp galaxies and normal Hubble type galaxies, is probably an artifact caused by an underestimate of the errors in the photometry of the Arp sample.
We find that the interacting and merging galaxies in comparison with isolated galaxies are more luminous in optical and near-IR and that the dust temperature is higher. While this often is claimed as an effect of starburst activity, it may also be explained if the IGs in general have higher masses than the NIGs and/or the gas, dust and young stars are more centrally concentrated. The latter could also explain the increase in the H equivalent width in the central regions. Mass transport to the central region also causes mechanical heating and shock ionization. An excess in mass means higher mean metallicity and dust content, further increasing the FIR luminosity. Since mass determinations of dynamically distorted systems are difficult to carry out, such a situation may have been overlooked in many cases.
Many of the previous investigations on this issue, claiming frequent occurrences of tidally triggered starbursts, are hampered by strong selection effects, often biased towards IGs with infrared excess. Although we worry about the selection effects we want to emphasize that we do not claim that starbursts are not triggered by interactions or mergers. On the contrary, mergers seem to be a necessity to create true starbursts like those in blue compact galaxies or some ULIRGs. But it does not appear to be a sufficient condition. The role of dark matter, angular momentum flow and star formation processes in general need to be understood better. Our estimate is that about 0.1% of all galaxies in a magnitude limited sample are true starbursts. Even taking into account the increase in merger rate with redshift we find that tidal interaction and mergers probably do not have a major effect on the gas consumption rate at these epochs. The observational data are yet too meager for final conclusions but if confirmed, it will have a significant impact on theoretical modelling of early galaxy evolution (e.g. Bekki bekki (2001); Devriendt & Guiderdoni devriendt (2000); Guiderdoni et al. bruno (1998)). Obvious consequences are that there is no cosmic epoch at redshifts z5 at which the mean gas consumption time scales in massive galaxies are significantly shorter than the Hubble age at that epoch. Moreover, the effects of superwinds created by coeval supernova blasts would have less effects on the morphology of the massive galaxies and that it would be more difficult to reionize the universe at high redshifts because the ionization parameter would be reduced.
Acknowledgements.
We are indebted to Lennart Johansson for his contributions in the early phase of this project. Our referees are thanked for many useful comments that have helped to improve the quality of this paper. N. Bergvall gratefully acknowledges partial support from the Swedish Natural Science Research Council. We thank the ESO staff for helpful assistance. This research has made use of the NASA/IPAC Extragalactic Database (NED) which is operated by the Jet Propulsion Laboratory, California Institute of Technology, under contract with the National Aeronautics and Space Administration. We have made use of the LEDA database (http://leda.univ-lyon1.fr).References
- (1) Aalto, S., Black, J. H., Johansson, L. E. B., Booth, R.S., 1991, A&A, 249, 323
- (2) Aalto, S., Booth, R. S., Black, J. H., Johansson, L. E.B., 1995, A&A, 300, 369
- (3) Aalto, S., Radford, Simon J. E., Scoville, N. Z., Sargent, A. I, 1997, ApJ 475, L107
- (4) Aalto, S., Hüttemeister, S., 2000, A&A 362, 42
- (5) Abraham, R. G., Tanvir, N. R., Santiago, B. X., Ellis, R. S., Glazebrook, K., van den Berg, S., 1996, MNRAS 279, L47
- (6) Alcaino, G., 1976, A&AS 26, 261
- (7) Allam, S, 1996, IRAS study of interacting galaxies , Ph.D. Thesis, Potsdam
- (8) Appleton, P.N., Struck-Marcell, C., 1987, ApJ 312, 556
- (9) Armus, L., Heckman, T. M., Miley, G. H., 1987, AJ 94, 831
- (10) Arp, H.C., 1966, Atlas of Peculiar Galaxies, Pasadena, California Institute of Technology
- (11) Arp, H. C., Madore, B., 1987, ”A catalogue of southern peculiar galaxies and associations”, Cambridge, New York : Cambridge University Press
- (12) Bachall J. N., Kirhakos S., Saxe D. H., Schneider D. P., 1997, ApJ 479, 642
- (13) Barnes, J.: 1990, in ’Dynamics and Interactions of Galaxies’, ed. R. Wielen, Springer, Berlin Heidelberg
- (14) Barnes, J. E., Hernquist, L. 1991, ApJ 370, L65
- (15) Barton, Elizabeth J., Geller, Margaret J., Kenyon, Scott J., 2000, ApJ 530, 660
- (16) Bekki, K., 2001, ApJ 546, 189
- (17) Bekki, K., Shioya, Y., 2000, PASJ 52, L57
- (18) Bergvall, N. A. S., Ekman, A. B. G., Lauberts, A.; Westerlund, B. E., Borchkhadze, T. M., Breysacher, J., Laustsen, S., Muller, A. B., Schuster, H. E., Surdej, J., West, R. M., 1978, A&AS 33, 243
- (19) Bergvall, N., 1981, Uppsala Astronomical Observatory Report No. 18
- (20) Bergvall, N., 1981, Uppsala Astronomical Observatory Report No. 19
- (21) Bergvall, N., Johansson, L., 1995, A&AS 113, 499
- (22) Bergvall, N., Rönnback, J, Johansson, L., 1989, A&A 222, 49
- (23) Burstein, D., Heiles, C., 1984, ApJS 54, 33
- (24) Bushouse, H. A. 1986, AJ 91, 255
- (25) Bushouse, H. A., Lamb V. A., Werner, M. W. 1988, ApJ 335, 74
- (26) Carlberg, R. G., Cohen, J. G., Patton, D. R., Blandford, R., Hogg, D. W., Yee, H. K. C., Morris, S. L., Lin, H., Hall, Patrick B., Sawicki, M., Wirth, Gregory D., Cowie, L. L., Hu, E., Songaila, A., 2000, ApJ 532,1
- (27) Carter, B. J., Fabricant, D. G., Geller, M. J., Kurtz, M. J., McLean, B., 2001 ApJ 559, 606
- (28) Chincarini, G., Tarenghi, M., Sol, H., Crane, P., Manousoyannaki, I., Materne, J., 1984, A&ApS 57, 1
- (29) Clements, D. L., Sutherland, W. J., McMahon, R. G., Saunders, W., 1996, MNRAS 279, 477
- (30) Colina, Luis, Borne, Kirk, Bushouse, Howard, Lucas, Ray A., Rowan-Robinson, Michael, Lawrence, Andy, Clements, David, Baker, Amanda, Oliver, Seb, 2001, ApJ 563, 546
- (31) Dahari, O., 1984, AJ 89, 966
- (32) Dahari, O., 1985, AJ 90, 1772
- (33) Dahari, O., de Robertis, M.M., 1988, ApJ Suppl. Ser. 67, 249
- (34) de Robertis, M. M., Yee, H. K. C., Hayhoe, K., 1998, ApJ 496, 93
- (35) Devriendt, J.E.G., Guiderdoni, B., 2000, A&A, 263, 851
- (36) Donzelli, C.J, Pastoriza, M.G, 1997, ApJS 111, 181
- (37) Dultzin-Hacyan, D., Krongold, Y., Fuentes-Guridi, I., Marziani, P., 1999, ApJ 513, L111
- (38) Fioc, M., Rocca-Volmerange, B., 1997, A&A 326, 950
- (39) Fioc, M., Rocca-Volmerange, B., 2000, astro-ph/9912179
- (40) Franceschini, A., Silva, L., Fasano, G., Granato, L., Bressan, A., Arnouts, S., Danese, L., 1998, ApJ 506, 600
- (41) Frenk, C.S., White, S.D.M., Davis, M., Efstatiou, G.: 1987, ApJ 327, 507
- (42) Gavazzi, Giuseppe, Boselli, Alessandro, Kennicutt, Robert, 1991, AJ 101, 1207
- (43) Griersmith, D., 1980, MNRAS 191, 1
- (44) Guiderdoni, B., Hivon, E., Bouchet, F.R., Maffei, B., 1998, MNRAS, 295, 877
- (45) Heckman, T. M., Armus, L., Miley, George K., 1990, ApJS 74, 833
- (46) Hernquist, L, 1989, Nature 340, 687
- (47) Ho, L. C., Filippenko, A. V., & Sargent, W. L. W., 1997, ApJ 487, 568
- (48) Holmberg, E., Lauberts, A., Schuster, H.-E., West, R.M.: 1980, A&AS 39, 173
- (49) Horellou, C., Booth, R., A&AS 126, 3
- (50) Horellou, C., Booth, R., Karlsson, B., 1999, Ap&SS 269/270, 629
- (51) Hummel, E., 1980, A&A 89, L1
- (52) Hummel, E., van der Hulst, J. M., Kennicutt, R. C., Keel, W. C., 1990, A&A 236, 333
- (53) Infante L., de Mello D. F., Menanteau F., 1996, ApJ, 469, L85
- (54) Jansen, Rolf A., Franx, Marijn, Fabricant, Daniel, Caldwell, Nelson, 2000, ApJS, 126, 271
- (55) Johansson, L., 1988, A&A 191, 29
- (56) Johansson, L., 1990, A&A, 241, 389
- (57) Johansson, L., 1991, A&A 241, 38
- (58) Johansson, L., Bergvall, N., 1990, A&AS 86, 167
- (59) Joseph, R. D., Wright, G. S. 1985, MNRAS, 214, 87
- (60) Karachentseva, V. E., 1973, Soobshch. Spets. Astrof. Obs., 8, 3
- (61) Karachentseva, V. E., Lebedev, V. S., Shcherbanovskij, A. L., 1997, VizieR On-line Data Catalog: VII/82A.
- (62) Keel, W., 1983, ApJS, 52, 229
- (63) Keel, W.C., Kennicutt, Jr., R.C., Hummel, E., van der Hulst, J.M., 1985, AJ 90, 708
- (64) Kennicutt, Jr., R.C., Keel, W.C., 1984, ApJ 279, L5
- (65) Kennicutt, Jr. R. C., Keel, W. C., van der Hulst, J. M., Hummel, E., Roettiger, K. A., 1987, AJ 93, 1011
- (66) Kennicutt, Jr., R.C., 1998, ApJ 498, 541
- (67) Kennicutt, Jr., R.C., 1998, in ”Galaxies, Interactions and Induced Star Formation”, ed. Jr. R. C. Kennicutt, F. Schweitzer and J. E. Barnes, Saas-Fee, Springer
- (68) Kormendy, J.: 1990, in ’Dynamics and Interactions of Galaxies’, ed. R. Wielen, Springer, Berlin Heidelberg
- (69) Kunth, D., Östlin, G., 2000, A&ARv, 10, 1
- (70) Lacey, C., Guiderdoni, B., Rocca-Volmerange, B., Silk, J., 1993, ApJ 402, 15
- (71) Larson, R.B., Tinsley, B.,M., 1978, ApJ 219, 46
- (72) Lauberts, A., 1984, A&AS 58, 249
- (73) Lauberts, A., 1982, ”The ESO/Uppsala Survey of the ESO(B) Atlas”, ESO
- (74) Laurikainen, E., Salo, H., 1995, A&A 293, 683
- (75) Laurikainen, E., Moles, M., 1989, ApJ 345, 176
- (76) Le Fèvre, O., Abraham, R., Lilly, S. J., Ellis, R. S., Brinchmann, J., Schade, D., Tresse, L., Colless, M., Crampton, D., Glazebrook, K., Hammer, F., Broadhurst, T., 2000, MNRAS 311, 565
- (77) Lilly, S.J., Eales, S.A., Gear, W.K.P., Hammer, F., Le Févre, O., Crampton, D., Bond, R.J., Dunne, L., 1999, ApJ 518, 641
- (78) Lisenfeld, U., Völk, H.J., Xu, C., 1996, A&A 314, 745
- (79) Lisenfeld, U., Isaak, K. G., Hills, R., 2000, MNRAS 312, 433
- (80) Liu, C.T., Kennicutt, R.C., 1995, ApJ 450, 547
- (81) Lonsdale, C.J., Helou, G., 1985, ’Catalogued galaxies and quasars observed in the IRAS survey’, Pasadena: JPL
- (82) Mathis, J.,1970, ApJ 159, 263
- (83) McKenty, J.W., 1989, ApJ, 343, 125
- (84) McLeod, K. K., Rieke, G. H., 1994, ApJ 431, 137
- (85) McLeod, K.K, Rieke, G.H., 1994, ApJ 420, 58
- (86) Mihos, J. C., Hernquist, L., 1994, ApJ 425, 13
- (87) Mobasher, B., Sharples, R. M., Ellis, R. S., 1993, MNRAS 263, 560
- (88) Moorwood, A. F. M., van der Werf, P. P., Cuby, J. G., Oliva, E., 2000, A&A 362, 9
- (89) Moshir, M. et al., 1990, Infrared Astronomical Satellite Catalogs - The Faint Source Catalog, Version 2.0
- (90) Murphy, T. W., Armus, L., Matthews, K., Soifer, B. T., Mazzarella, J. M., Neugebauer, G., 1996, AJ 111, 102
- (91) Noguchi, M. 1988, A&A 203, 259
- (92) Osterbrock, D., 1991, PASP 103, 874
- (93) Patton, D. R., Pritchet, C. J., Yee, H. K. C., Ellingson, E., Carlberg, R. G., 1997, ApJ 475, 29
- (94) Peterson, C.J., 1982, PASP 94, 404
- (95) Peterson, C.J., 1986, PASP 98, 1273
- (96) Quinn, P.J., 1984, ApJ 279, 596
- (97) Ramella, M., Zamorani, G., Zucca, E., Stirpe, G. M., Vettolani, G., Balkowski, C., Blanchard, A., Cappi, A., Cayatte, V., Chincarini, G., Collins, C., Guzzo, L., MacGillivray, H., Maccagni, D., Maurogordato, S., Merighi, R., Mignoli, M., Pisani, A., Proust, D., Scaramella, R, 1999, A&A 342,1
- (98) Rocca-Volmerange, B., Guiderdoni, B.: 1990, A&A 227, 362
- (99) Roche, N., Eales, S.A., 1999, MNRAS 307, 111
- (100) Sadler, E., 1982, Ph.D. thesis, Mt Stromlo and Siding Spring observatories
- (101) Salo, H., 1991, A&A 243, 118
- (102) Salo, H., Laurikainen E., 1993, ApJ 410, 586
- (103) Salo, H., Laurikainen E., 2000, MNRAS 319, 377
- (104) Sandage, A., 1961, The Hubble Atlas of Galaxies (Washington: Carnegie Institution of Washington)
- (105) Sandage, A., Visvanathan, N., 1978 ApJ 223, 707
- (106) Sanders, D.B, Mirabel, I.F., 1996, Ann Rev Astr. Ap 34, 749
- (107) Sanders, D. B., Soifer, B. T., Elias, J. H., Madore, B. F., Matthews, K., Neugebauer, G., Scoville, N. Z., 1988, ApJ, 325, 74
- (108) Scalo, J.M., 1986, Fund. Cosmic Phys. 11, 1
- (109) Shobbrook, R.R., 1966, MNRAS 131, 351
- (110) Schweizer, F., 1980, ApJ 237, 303
- (111) Schweizer, F., 1990, in ’Dynamics and Interactions of Galaxies’, ed. R. Wielen, Springer, Berlin Heidelberg
- (112) Schweizer, F., Seitzer, P., 1992, AJ 104, 1039
- (113) Schweizer, F., 1999, in Physical Reports 321, No 1-3
- (114) Sekiguchi, K., Wolstencroft, R. D., 1992, MNRAS 255, 58
- (115) Solomon, P.M, Sage, L.J., 1988, ApJ 334, 613
- (116) Spinoglio, L., Malkan, M.A., Rush, B., Carrasco, L., Recillas-Cruz, E., 1995, ApJ 453, 616
- (117) Stauffer J., 1982, ApJS, 50, 517
- (118) Taniguchi, Y., Ohyama, Y., 1998, ApJ 508, L13
- (119) Telesco, C. M., Wolstencroft, R. D., Done, C., 1988, ApJ 329, 174
- (120) Terlevich, R., Melnick, J., Masegosa, J., Moles, M., Copetti, M. V. F., 1991, A&AS 91, 285
- (121) Thronson, H.A., Jr., Majewski, S., Descartes, L., Hereld, M., 1990, ApJ 364, 456
- (122) Toomre, A., Toomre, J. 1972, ApJ 178, 623
- (123) Toomre, A., 1977, in “The Evolution of Galaxies and Stellar Populations, ed. B. Tinsley, R. Larson, New Haven, Yale University Obs., p. 401
- (124) van den Bergh, S., 1990, QJRAS 31, 153
- (125) de Vaucouleurs, G., de Vaucouleurs, A., Corwin J.R., 1976, Second Reference Catalogue of Bright Galaxies, Austin: University of Texas Press
- (126) de Vaucouleurs, G., in ”The Evolution of Galaxies and Stellar Populations”, Tinsley, B.M. and Larson, R.B. (eds), Yale Univ. Press
- (127) de Vaucouleurs, G., de Vaucouleurs, A., Corwin, J. R., Buta, R. J., Paturel, G., Fouque, P., 1991, ”Third reference catalogue of Bright galaxies”, New York : Springer-Verlag
- (128) West, R. M., Surdej, J., Schuster, H.-E., Muller, A. B., Laustsen, S., Borchkhadze, T. M, 1981, A&AS 46, 57
- (129) White, S., 1979, Monthly Notices Roy. Astron. Soc. 189, 831
- (130) Whitemore, B. C., Miller, B. W., Schweizer, F., Fall, S. M., 1997, AnJ 114, 1797
- (131) Witt, A. N., Harley, A., Thronson, Jr., Capuano, Jr., 1992, ApJ 393, 611
- (132) Worthey, G., 1994, ApJS 95,107
- (133) Wright, G. S., James, P. A., Joseph, R. D., McLean, I. S., 1990, Nature 344, 417
- (134) Young, J. S., Kenney, J., Tacconi, L., Claussen, M., Huang, Y-L., Tacconi-Garman, L., Xie, S., Schloerb, F. P., 1986, ApJ 311, L17
- (135) Young, J.S., Scoville, N.Z., 1991, ARA&A 29, 581
- (136) Xu, C., Sulentic, J.W., 1991, ApJ 374, 407
- (137) Zackrisson, E., Bergvall, N., Olofsson, K., Siebert, A., 2001, A&A 375, 814