ISOGAL: A deep survey of the obscured inner Milky Way with ISO at 7m and 15m and with DENIS in the near-infrared. ††thanks: This is paper no. 20 in a refereed journal based on data from the ISOGAL project,††thanks: Based on observations with ISO, an ESA project with instruments funded by ESA Member States (especially the PI countries: France, Germany, the Netherlands and the United Kingdom) and with the participation of ISAS and NASA ††thanks: Based on observations collected at the European Southern Observatory, La Silla Chile.
The ISOGAL project is an infrared survey of specific regions sampling the Galactic Plane selected to provide information on Galactic structure, stellar populations, stellar mass-loss and the recent star formation history of the inner disk and Bulge of the Galaxy. ISOGAL combines 7 and 15 m ISOCAM observations – with a resolution of 6 at worst – with DENIS IJKs data to determine the nature of the sources and the interstellar
extinction. We have observed about 16 square degrees with a sensitivity approaching 10-20mJy, detecting 105 sources, mostly AGB stars, red giants and young stars. The main features of the ISOGAL survey and the observations are summarized in this paper, together with a brief discussion of data processing and quality. The primary ISOGAL products are described briefly (a full desciption is given in Schuller et al. 2003): viz. the images and the ISOGAL–DENIS five–wavelength point source catalogue. The main scientific results already derived or in progress are summarized. These include astrometrically calibrated 7 and 15 m images, determining structures of resolved sources; identification and properties of interstellar dark clouds; quantification of the infrared extinction law and source dereddening; analysis of red giant and (especially) AGB stellar populations in the central Bulge, determining luminosity, presence of circumstellar dust and mass–loss rate, and source classification, supplemented in some cases by ISO/CVF spectroscopy; detection of young stellar objects of diverse types, especially in the inner Bulge with information about the present and recent star formation rate; identification of foreground sources with mid-IR excess. These results are the subject of about 25 refereed papers published or in preparation.
Key Words.:
Stars: AGB and post-AGB - Stars: circumstellar matter - Stars: mass-loss - Stars: formation - Dust: extinction - Infrared: stars - Galaxy: Bulge1 Introduction
The ISOGAL project is a multi-wavelength infrared survey at high spatial resolution of the inner Galaxy, covering the central Galactic Bulge and sampling the obscured Disk within the Solar circle. The primary scientific aims are to quantify the spatial distributions of the diverse stellar populations and their properties in the inner Galaxy, together with the properties of the warm interstellar medium, and to derive how they are different from those in the vicinity of the solar system. ISOGAL is based on large-area broad-band imaging at 7 and 15 m with ISOCAM (Cesarsky et al. 1996) on the ISO satellite (Kessler et al. 1996), and constituted one of the largest programs using ISO. These mid-infrared data, with a resolution of 6 at worst, have been combined with observations at other wavelengths, mostly in the near-infrared. To date, most effort has focussed on the association with complementary DENIS IJKs observations of the central Galaxy (Epchtein et al. 1997, Simon et al. in preparation).
Our ISOCAM data (Schuller et al. 2003) are more sensitive by one to four magnitudes, and have a higher spatial resolution, than the recent survey of the whole Galactic Disk with MSX (see below); they are two orders of magnitude more sensitive, and have one order of magnitude higher spatial resolution, than IRAS: these improvements allow reliable and nearly complete point-source detection down to 10 mJy at 15 m and 10–20mJy at 7 m, depending on crowding and infrared background (the sensitivity is about a magnitude less in the few fields observed in star-forming regions with very strong background). The five wavelengths of ISOCAM + DENIS normally allow reliable determination of the nature of the sources and of their interstellar reddening. Generally, about 85% of the ISOCAM sources are matched with near-infrared sources from the DENIS survey. ISOGAL data are thus a powerful tool for the analysis of stellar populations in the most heavily obscured regions of the Milky Way.
While the majority of sources detected only with the deeper 7 m observation are red giants on the upper first ascent branch (RGB), the most numerous class of ISOGAL 15 m sources are Asymptotic Giant Branch (AGB) stars in the Galactic Bulge and central Disk, with luminosities above the RGB tip and with evidence for mass-loss in most cases. In addition to a few foreground main-sequence stars, ISOGAL has also detected a number of young stars. Most of them have circumstellar dust. These young sources are typically stars of a few solar masses in relatively nearby (1-2 kpc) regions, with a few higher-mass more distant sources. It is also expected that the ISOGAL sources include a number of as-yet unidentified peculiar stellar objects of diverse kinds with infrared excess. Near-infrared observations, and in particular the DENIS and 2MASS (Skrutskie et al. 1997, Cutri 1998) surveys, are generally better able than ISOGAL to detect most normal field stars, especially red giants and AGB stars with little mass-loss, when the interstellar reddening is not too high. However, from near-infrared data alone it is extremely difficult to disentangle interstellar reddening and circumstellar dust emission. Data at longer wavelengths, which are more sensitive to the infrared emission from cool circumstellar dust, and are less affected by interstellar reddening, are required. New mid-infrared space surveys, such as the present one with ISOCAM, and MSX (Price et al. 2001, Egan et al. 1996, 1998, 1999), are thus uniquely suited for carrying out a census of mass-losing AGB stars and for detecting young stellar objects in the inner Galaxy. ISOGAL is generally more sensitive than MSX by one or two magnitudes at 7–8 m, and by three or four magnitudes at 15 m; it has pixels at least three times smaller than MSX. However, MSX has observed the whole Galactic Disk, an area two orders of magnitude larger than ISOGAL.
In addition to the many stellar sources, the ISOGAL images provide a high spatial resolution study of the diffuse mid-infrared emission, yielding a wealth of information about its carriers (PAHs and dust). ISOGAL allows in particular the identification of dense globules and filaments, which are opaque even in the mid-infrared (Pérault et al. 1996, Hennebelle et al. 2001). The largest of such IR-detected dark clouds were observed by IRAS. ISO and MSX (Egan et al. 1998) showed that they were distinct and sharp edged. The much higher resolution of these experiments permitted them to detect many more dark clouds. The absorption in these clouds also provides a means of measuring the infrared extinction curve along diverse lines of sight.
Many specific ISOGAL results have already been published, including: i) first imaging results (Pérault et al. 1996); ii) a study of late-type giants and long–period and semi–regular variables in Baade’s Windows (Glass et al. 1999, Glass & Alves 2000, Alard et al. 2001); iii) AGB stars and their mass–loss rates in the intermediate inner Bulge (Omont et al. 1999); iv) source counts in specific fields by combining with the ISOCAM observations taken by the SWS dedicated time experiment GPSURVEY (Burgdorf et al. 2000); v) discoveries of young stellar objects (Testi et al. 1997, Felli et al. 2000, 2002), Schuller (2002), and VLA follow–up observations (Testi et al. 1999); vi) properties of dark interstellar globules (Hennebelle et al. 2001); vii) and subsequent millimetre (Teyssier et al. 2002) and submillimetre (Pierce-Price et al. 2000) observations. A number of other detailed analysis papers have been published, submitted for publication or are in preparation: associations with OH masers (Ortiz et al. 2002), new SiO masers (Messineo et al. 2002), analysis of specific fields (Ojha et al. 2003, van Loon et al. 2003, Jiang et al. 2003, Schuller 2002 and Schuller et al. in prep., Ganesh et al. in prep.), a catalogue of luminous infrared sources with cross-identifications in the central Bulge and Disk (Chitre et al. in prep.), visible spectroscopy (Schultheis et al. 2002), near-infrared spectroscopy (Schultheis et al. 2003), ISOCAM CVF spectroscopy (Blommaert et al. in preparation).
The present paper, accompanying the publication of the Point Source Catalogue (PSC) of 7 and 15 m ISOGAL sources cross-identified with DENIS, aims at a general presentation of the ISOGAL survey, of its products and their content, and of its present and expected achievements for the different classes of topics, fields and objects. A companion paper (Schuller et al. 2003) contains the Explanatory Supplement to the PSC and a detailed analysis of ISOGAL data processing and quality.
The paper begins with a brief summary of the main features of the ISOGAL observations, data processing and quality, and products (Sect. 1,2,3). We then discuss in turn the impact of ISOGAL on the main topics of interest: interstellar medium, stellar populations, AGB circumstellar dust and mass–loss, and young stars.
2 Observations
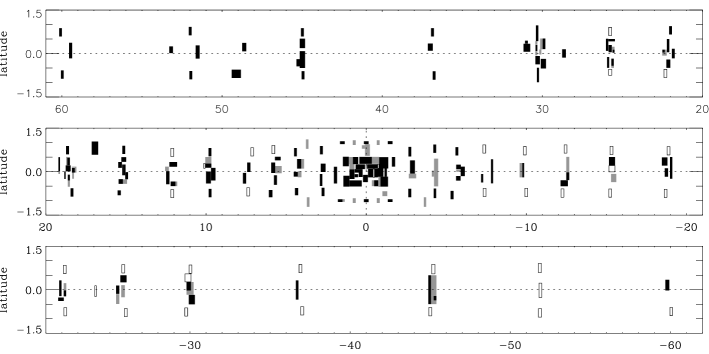
The ISOGAL observational program with ISOCAM extended from January 1996 to April 1998, i.e., over practically the whole ISO mission. It is the result of three successive proposals developed as the mission progressed, which unfortunately prevented simultaneous 7 and 15 m observations in many fields. The observed regions (16 deg2) were distributed along the inner Galactic Disk, mostly within 30∘, 1∘, to provide a regular sampling pattern, as shown in Figure 1. The central region ( 1.5∘, 0.5∘) was almost entirely observed in one wavelength at least, except very close to the Galactic Center and a few other problematic areas (Fig. 3). These omissions were necessary to avoid very strong sources, which would have saturated the ISOCAM detectors, causing long–lasting adverse side–effects.
Thus most of the fields were chosen to avoid strong IRAS sources. Each observation consisted of small rasters (0.1 deg2), oriented in Galactic coordinates. Standard ISOGAL observational conditions included (see Schuller et al. 2003): broad ISOCAM filters, LW2 (5-8.5 m) and LW3 (12-18 m); 6 pixels; half-overlapping 3’ x 3’ ISOCAM frames (32 x 32 pixels) and short total integration time (76 x 0.28 s = 21 s) per frame, with overhead time 10 s per frame.
In order to allow the observation of active star-forming regions, especially in the central area, the initial conservative flux-avoidance limit (6 Jy at 12 m) was subsequently relaxed by adopting: i) narrower filters (LW6 7.0-8.5 m, LW5 6.5-7.3 m, LW9 14-16m), ii) 3 pixels, and allowing explicitly for the fact that the flux of stronger IRAS sources, especially young stellar objects, is distributed over more than one ISOGAL pixel. In the last months of the ISO mission, the ISOGAL observations were extended in several directions, namely in regular sampling of the northern Galactic Disk up to = 105∘, in sampling of a few Bulge fields farther from the Galactic Plane 1∘ b 6∘, in specific observation of a few star-forming regions (16∘ 138∘), in repeated and other verification observations, and in taking CVF spectra (5-16m) of eighteen 3’x3’ fields.
Altogether, 250 hours of observing time were used, which makes ISOGAL one of the largest ISO programs. Detailed information on the observation parameters and in particular on the limits of the observed rasters is available in Table 3 of the ISOGAL Explanatory Supplement (Schuller et al. 2003) and on the ISOGAL web server (www-isogal.iap.fr/).
Systematic cross-identification with the near-infrared Ks, J, I sources of the DENIS survey is an integral part of the ISOGAL program. Special DENIS observations of the ISOGAL fields were performed to provide early availability of the data (Simon et al. in preparation). We are at present (early 2003) making available at the CDS Strasbourg data centre a five-wavelength catalogue of ISOGAL point sources with their DENIS identification, if available. The latter covers almost the whole observed area, excluding at present only the few northern ISOGAL fields with +2∘. The ISO archive also contains LWS data obtained in parallel mode, for regions of the sky 12’ apart, which will provide the spectral energy distribution of the far-infrared diffuse emission in the ISOGAL field areas (Lim et al. 2000); but we do not consider these LWS data to be a part of the ISOGAL program.
3 Data processing and analysis
Reducing ISOCAM data requires a considerable number of operations (see ISOCAM Handbook, Blommaert et al. 2001). The extensive data processing packages now available handle well the usual features of all ISOCAM data: glitches, the dead column, the time-dependent behavior of the detectors. Additional difficulties in reducing the ISOGAL data are due to the bright background of highly structured diffuse emission; the high spatial density of bright sources, which induce long-lasting remanence effects; our very short integration times; unavoidable undersampling of the images; no redundancy in sky-sampling; and image crowding in the fields. Therefore, a special reduction pipeline was devised by C. Alard, S. Ganesh and F. Schuller, to complement the standard treatment applied to the ISOCAM data as delivered (Schuller et al. 2003). This special pipeline uses several procedures of the Interactive Analysis System for ISOCAM (CIA) software [jointly developed by the ISOCAM Consortium and the ESA Astrophysics Division (Ott et al. 1997, Blommaert et al. 2001 )] which are not implemented in the standard treatment of ISO data. It also includes sophisticated source extraction, after regularisation of the point-spread-function (psf), and psf determination directly from the average ISOGAL data. The details of the processing of ISOGAL data and the assessment of their present quality are discussed in a companion paper (Schuller et al. 2003).
The completeness of point source extraction has been systematically addressed through retrieval of added artificial sources. Such completeness findings have been complemented and checked by the results of a few repeated observations (in one case with 3 pixels, rather than the typical 6 pixels, and hence with greatly reduced crowding), and by comparison with DENIS (or 7 m) red giant source counts. The completeness limit depends on the source density, on the intensity and the structure of the local diffuse background, and on the filter used. The sensitivities reached at 7 and 15 m for standard ISOGAL conditions are summarized in Table 1.
| Region22footnotemark: 2 | Source | Background | Pixel | Filter | 7 | 15 | ||
|---|---|---|---|---|---|---|---|---|
| density | mag | flux (mJy) | mag | flux (mJy) | ||||
| A | low | weak | 6″ | broad | 10 | 9 | 8.7 | 7 |
| B | high | moderate | 6″ | broad | 9 | 22 | 8 | 12 |
| C | very high | strong | 3″ | narrow | 8.4 | 35 | 7 | 30 |
| D | high | very strong | 6″ | narrow | 7.7 | 55 | 6.5 | 45 |
Sensitivity limits of ISOGAL sources published in PSC
Version 1, corresponding approximately to detection completeness
of 50% (Schuller et al. 2003).
22footnotemark: 2 Typical regions:
A Lowest density Bulge fields, b 2∘
B Standard Disk fields, b 0.5∘, 30∘
C Central Bulge/Disk fields, b 0.3∘, 1∘
D Most active star formation regions such as M16, W51.
As discussed in Schuller et al. (2003) a special care was taken in order to discard from the source lists possible remnant “ghosts” in the pixels which have seen a strong source in previous observation frames, and which may appear as normal sources in the images.
The statistical reliability of the final extracted point sources was checked through repeated observations of a few fields, and by confirmation of their reality by their detection in another ISOCAM or DENIS band. Such checks have shown that there are still a few unconfirmed sources, possibly spurious, among the weak ones with poor quality flags (see Schuller et al. 2003). These could be related to incomplete correction of remnant “ghosts”, background noise, straylight and other artefacts. Therefore, we limit the discussion to sources brighter than a lower limit, generally greater than 10 mJy in both bands, depending on the confusion and background noise in each field (see Schuller et al. 2003 and Table 1). Nevertheless we suggest that users should carefully question the reality of faint sources with poor quality flags not detected in at least two ISOCAM or DENIS bands.
Photometric accuracy is estimated from repeated observations and retrieval of added artificial sources. Typical rms is 0.2 mag, though higher for the faintest sources. A systematic bias in the absolute calibration of 0.1-0.2 mag is still possible because, in particular, of the difficulty of correcting transient effects. Both dispersion and bias increase close to the confusion limit in crowded fields.
Cross-identifications of LW2 and LW3 sources, either between each other or with DENIS sources, provide the main information for discussing the nature of the sources and their properties. Cross-identification efficiency can also be quite useful for assessing data quality. We applied routine standard procedures for 7 m–15 m and DENIS–ISOCAM cross-identifications (Schuller et al. 2003). The good quality of the pointing of ISO and of the correction of the ISOCAM field distortions permits, after optimisation of a small translation of each field, the rms residual of the nominal separation of matched sources to be reduced to . This is thus the order of magnitude of the accuracy of the astrometry of the ISOGAL sources not matched with DENIS sources (except in the few fields without DENIS observations). The other ISOGAL sources, the large majority, being matched with DENIS sources, benefit from the excellent DENIS astrometry ( 0.5).
In conclusion, although we hope that significant improvements will still be possible in the future, the present quality of the data is sufficiently acceptable, as concerns reliability, completeness, photometric accuracy and astrometry of the sources, to enable systematic scientific analysis.
4 ISOGAL products


In addition to the standard data available in the ISO archives, the ISOGAL Collaboration is making available more elaborate products, especially for stellar sources, from the data processing described above. A first version is about to become available through CDS/VizieR. It is intended to improve it in the future and to complete it with CVF 4–16 m spectra of eighteen 3’x3’ ISOCAM fields. The present data, the images and the multi–wavelength point source catalogue (PSC), are described in detail in their Explanatory Supplement in Schuller et al. (2003).
The ISOGAL images available at present are products of the ISO/CIA processing ((Ott et al. 1997, Blommaert et al. 2001 ). They are mosaiced images with the so-called “inversion” treatment of the time dependence of the detector signal. They still contain some obvious defects and it is intended to publish improved images soon with a better correction of transient and remnant effects (Miville–Deschênes et al. 2000 and in preparation). However, the astrometry of the present images has been improved by calibration through DENIS astrometry in most fields; it is thus significantly better than the standard ISOCAM astrometry. An image is provided for every reasonably good quality ISOGAL observation ( x b raster with given filter and pixel-field-of-view, corresponding to a given ISO Observation Number, “ION”), amounting to a total of 384 images. Fits images are available at the web page: http://www-isogal.iap.fr/Fields/index_tdt.html. In addition, specific lists are provided to identify and discard the spurious sources present in the images. Two-colour images are also provided, by combining 7 and 15 m data for the fields where both are available
(http://www-isogal.iap.fr/Fields/).
The ISOGAL PSC at present gives magnitudes, I, J, Ks, [7], [15], at five wavelengths (0.8, 1.25, 2.15, 7 & 15 m) with DENIS providing I,J,Ks associations when available. The PSC contains 105000 sources, of which about half have 7-15 m associations and 78% have DENIS associations. Since, in many cases, for observational reasons, the rasters observed at 7 and 15 m do not exactly coincide, the PSC is organised in classes of “fields” derived from the observed rasters : fields observed both at 7 and 15 m (163 fields); fields observed only at either 7 or 15 m (43 and 57 fields, respectively). Each “field” covers a rectangle in x b fully observed and sources too close to the “saw-tooth” edges are discarded. When several observations at the same wavelength (7 or 15 m) exist for a sky area, only one is used in the present catalogue. Quality flags are provided for each source at each wavelength, as well as for source associations, and only sources with a reasonable quality are published (see Schuller et al. 2003). A number of spurious sources, visible in the present images, are not included in the PSC because they are suspected to be artefacts, in particular possible remnants in pixels which have previously seen bright sources. For each field, such spurious sources are published in special tables (Schuller et al. 2003). Additional unpublished information on ISOGAL sources can be requested for special purposes from the ISOGAL PI (A.Omont).
5 Interstellar Medium
5.1 Images
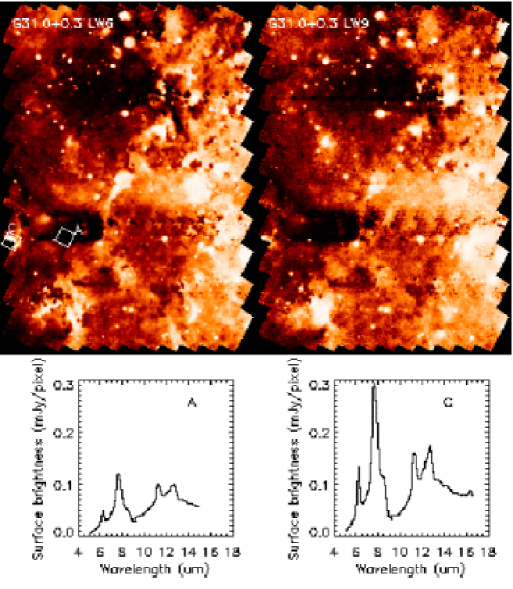
The high spatial resolution information on diffuse mid-infrared emission in ISOGAL images provides a wealth of information about its carriers (polycyclic aromatic hydrocarbons – PAHs – and dust), as well as about the interstellar radiation which excites them. All ISOGAL images display a rich structure of such diffuse emission, especially in or close to regions of star formation (Figs. 2–5). From ISOCAM studies of the interstellar medium in our Galaxy and others, it is well-established that the most important contributors to the emission in the diverse 7 m filters are the PAH bands. This is exemplified in the CVF spectra of a few typical pixels displayed in Fig. 5 (Pérault et al. in preparation). On the other hand, such bands are normally completely absent in the LW9 filter (14-16m), while the only PAH band contributing to the LW3 emission is the 12.7 m band at the blue side of the LW3 filter. It is known (Boulanger & Pérault 1988) that the diffuse emission in the 12–20 m range is generally dominated by very small interstellar grains. However, in HII regions the ionic line emission (12.8 m Ne II, 15.6 m Ne III) can also make an appreciable contribution to the LW3 or LW9 emission.
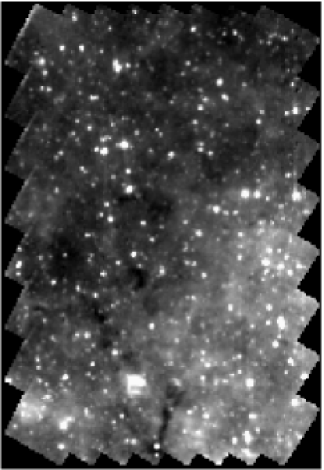
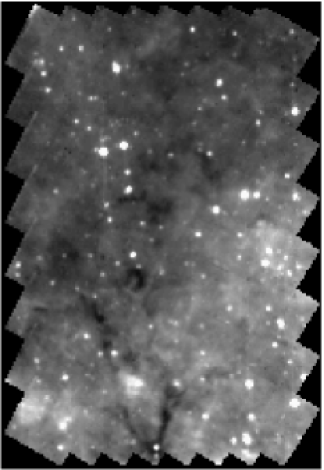
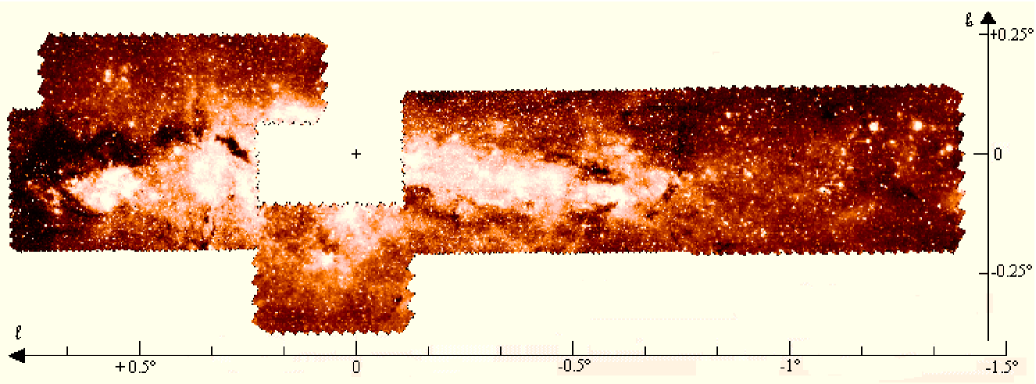
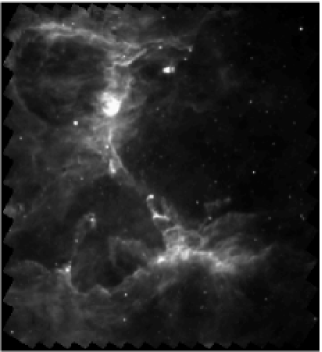
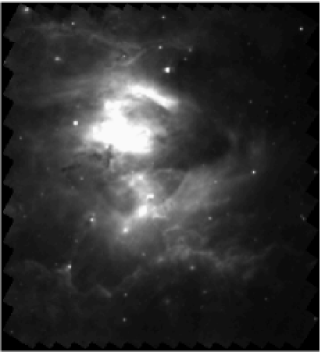
Fig. 2 displays the LW2/LW3 images of a “typical” ISOGAL field showing a general similarity in the morphology of the 7 and 15 m emission with a few infrared dark clouds (Sect. 5.2, see also Fig. 5). Figures 3 and 4 show two special cases: 1) two images, respectively in LW6 and LW9 filters, of the star-forming region M16, the Eagle Nebula, where the LW6 filter, centered on the main PAH feature, enhances the PAH emission and shows its extraordinary filamentary structure, while the emission in the narrow LW9 filter, which includes the 15.6 m Ne III line, displays a completely different structure centered on the H II region; 2) a mosaic of ISOGAL images (assembled by S. Ganesh, in preparation) in the neighbourhood of the Galactic Center in the narrow filter LW5 which, unlike LW6, minimizes the PAH emission. The spectacular dark condensations, especially the string between the Galactic Center and Sgr B2, strikingly coincide with mm/submm/far-IR emission features (Lis et al. 1994, 2001, Carey et al. 2000, Pierce–Price et al. 2000, Ganesh et al. in preparation).
5.2 Dark clouds and millimetre follow-up
The ISOGAL survey revealed a population of narrow (down to 10 in size), very dark, filaments and globules, seen in absorption in front of diffuse Galactic emission at 7 and 15 m, which are visible in practically all ISOGAL images (Figs. 2, 3, 5). They were first reported by Pérault et al. (1996), who showed that these features are very compact cores lying mainly between 2 and 8 kpc from the Sun. They are similar to those (more than 2000) visible at lower angular resolution in the MSX survey (Egan et al. 1998, Carey et al. 1998, Simon et al. 2001 and references therein). Hennebelle et al. (2001) performed multiresolution extraction leading to a systematic analysis of more than 450 such ISOGAL dark clouds located in the inner Galaxy, mostly in quiescent molecular complexes in the molecular ring and in regions interior to that. These authors derived opacities (Sect. 5.3) at 15 m in the range of 1–4 for a few selected objects, leading to column densities of the order of 1023 cm-2. For a typical dimension of a fraction of a parsec, such dark condensations have typical densities above 105 cm-3 and masses more than 103 M⊙. This interpretation was confirmed by follow-up observations at radio–mm wavelength carried out at the IRAM 30 m telescope by Teyssier et al. (2002). They derived physical conditions and chemical properties of the gas associated with some of these dense dust condensations, utilising maps of 13CO, C18O and 1.2 mm continuum emission: these maps show spectacular correlations with the mid–IR absorption. The molecular lines are surprisingly weak, indicating likely depletion onto cold grains. The kinetic temperatures are found to be between 8 and 25 K, with warmer clouds being associated with young embedded stars.
5.3 Extinction
Because of reduced extinction, infrared wavelengths are the only practical way of mapping regions of high extinction in the inner Galaxy. However, in certain regions having large values of AV (10–50), the effects of extinction are still important at near-IR wavelengths, and are not negligible at mid-IR ones. Extinction corrections must, therefore, be considered in the determination of intrinsic IR magnitudes and of bolometric magnitudes. The IR reddening or IR counts can be used to determine extinction in visual or infrared. In addition, when the distribution of AV along a line of sight is known, its determination for a specific star can provide a crude estimate of distance and, hence, of the stellar luminosity. An early map of AV in two square degrees around the Galactic Center was derived by Catchpole et al. (1990) (see also Glass et al. 1987), from near-IR reddening of red giants whose magnitudes correspond to AGB stars just above the RGB tip. Arendt et al. (1994) used a similar procedure, that is to assume the (J–K)0 colour was constant, to estimate the extinction towards the Bulge from the low resolution (0.7 degree) J and K COBE/DIRBE observations. Cambresy (1999) interpreted extant source counts from near-IR surveys to map extinction in nearby molecular clouds.

We have used the DENIS JKs data to extend the method of Glass et al. (1987), to map extinction in the most obscured part of the Bulge (30 deg2; Schultheis et al. 1999). The method is based on the very well defined K0/J0–K0 relation for most Bulge red giants and AGB stars (zero-extinction curve in Fig. 6). The JK interstellar reddening, and hence the AV, can thus be deduced immediately from the J and Ks of each star (Fig. 6). Along each line of sight, the peak of the distribution in J-Ks is interpreted as the Bulge value, giving the value of AV to the Bulge in this direction. Of course, this method is only approximate because of statistical fluctuations and of the difficulty of disentangling Bulge and Disk distributions at large . In addition, the method is not applicable to the largest extinctions (AV 25) where the DENIS J detections are not complete. Under these conditions, H–Ks 2MASS values may be useful with some caution to complement the J–Ks data (see e.g. Alard 2001).
There are still uncertainties in the infrared interstellar extinction law. In the near-infrared, proposed values for AK/AV differ by as much as 30 % (see e.g. Glass 1999). However, the difference is not larger than 7% for the J Ks reddening ( AJ–AK)/AV. The situation is even more uncertain for the mid-IR ISOGAL bands. In particular, Lutz et al. (1996; see also Moneti et al. 2001) have provided, for the Galactic Center line of sight, much larger values for the extinction in the 7 m region than those expected from the standard interstellar extinction curve for the Solar neighbourhood (see e.g. Draine & Lee 1984, Mathis 1990).
ISOGAL results provide a way to check the extinction value, averaged over the broad band used, on the line of sight of many fields along the Galactic Disk, and to correlate it with the distribution of the interstellar gas inferred from CO and HI surveys (Jiang et al. 2003). The most straightforward technique is to measure the ratio (AKs–A7)/(AJ–AKs), assuming a constant value for J0–Ks0 for the intermediate AGB stars and the luminous RGB stars. In J–Ks/Ks[–7] diagrams, most sources more or less follow a straight line with some dispersion. For instance, in a well behaved case ( = 18.63∘, b = 0.35∘) studied by Jiang et al. (2003), the slope (AKs–)/(AJ–AKs) 0.37 yields (AKs–) 0.06 AV for the average extinction in the band of the LW2 ISOCAM filter (5–8.5 m). Such a value is more compatible with the results of Lutz et al. (1996) than with the classical extinction curve. From the value of AK/AV = 0.089 recommended by Glass (1999) in agreement with van de Hulst (1946) one deduces /AV 0.027, while the value of Rieke & Lebobvsky (1985), AK/AV = 0.117, yields /AV 0.056. We favour the Glass–van de Hulst value for AK, but stress that the resulting value, /AV 0.03, is not significantly in disagreement with either the classical curve or Lutz et al.’s results. In other ISOGAL fields the J–Ks/Ks–[7] diagrams often tend to display a large dispersion in the values of Ks–[7], which makes the value of /AV less accurate. Nevertheless, the results are consistent with the value derived above (Jiang et al. in preparation). An estimate of 15/ AV from J–Ks/Ks–[15] diagrams by the same method is practically impossible because of the very large and various values of (Ks–[15])0 for many stars (see Sect. 7).
An independent analysis of the constraints on the interstellar extinction curve provided by the ISOGAL infrared dark clouds has been performed by Hennebelle et al. (2001). They show that the ratio between the dimming of the diffuse emission at 7 and 15 m is 0.750.15 for the clouds located away from the Galactic Center () and 1.050.15 for the clouds closest to the Galactic Center. They derive that the 7 m to 15 m opacity ratio is equal to 0.7 0.1 for the clouds located away from the Galactic Center. They discussed several explanations for the variation of the contrast ratio, including absorption along the line of sight and local variations of the extinction curve.
6 Stellar Populations
6.1 Colour–Magnitude Diagrams

The availability of multi-wavelength information allows one to make the distinction between intrinsic source properties and effects due to interstellar extinction. For this purpose the several colour–magnitude diagrams (CMD) and colour–colour diagrams that one can construct with the diverse combinations of the five bands from ISOCAM and DENIS are effective. The most useful examples are displayed in Fig. 7. As discussed in Sect. 5.3, the diagrams Ks/J–Ks, [7]/Ks–[7] or Ks/Ks–[7], J–Ks/Ks–[7] (and also I–J/J–Ks) are useful for determining interstellar extinction. I–J can provide, in particular, information about metallicity through the effect of absorption in molecular bands of TiO, VO, etc. (see van Loon et al. 2003). However, it is very difficult to separate the effects of Teff and metallicity. In addition, it should be realised that in many ISOGAL lines of sight, only a fraction of ISOGAL sources have useful I data, because the detection at I is limited to moderate values of AV (typically 10).
The most important new feature of ISOGAL data compared to previous near-IR studies is their ability to detect and characterise sources with a mid-infrared excess arising from even quite small amounts of circumstellar dust. The presence of such dust, even in very small amounts, is always revealed clearly by a 15 m excess, i.e., namely, by the colours (Ks–[15])0 and especially [7]–[15] (see Sect. 7). Indeed, the [7]–[15] colour, being weakly sensitive to extinction, can provide a direct estimate of mass-loss rates of AGB stars even without the need for explicit dereddening.
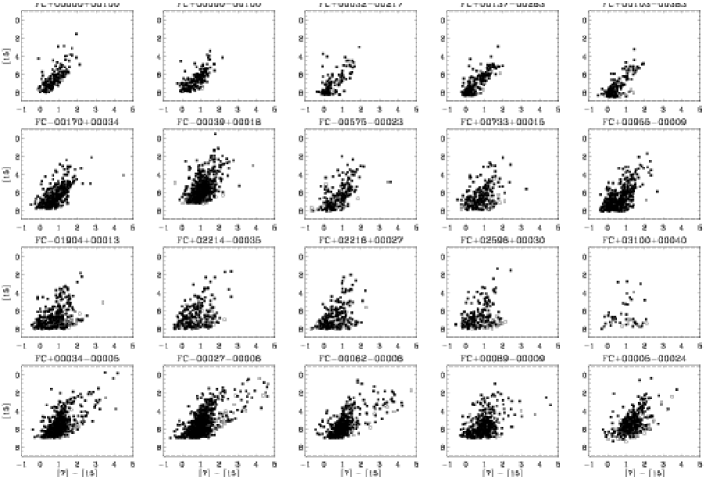
The colour-magnitude diagram [15]/[7]–[15] thus provides a straightforward view of the types and the number of dusty sources in each ISOGAL field, with even a direct measure of their mass-loss rates for AGB stars. Such diagrams are displayed in Fig. 8 for various typical ISOGAL fields in the Galactic Bulge and Disk. Their most conspicuous common feature is a sequence of AGB stars, with at least some inferred mass-loss; these are the majority of the sources detected at 15 m.
The interpretation is especially unambiguous in the intermediate Bulge, with b 1∘ (first row of Fig. 8 ; Glass et al. 1999, Omont et al. 1999, Ojha et al. 2003, van Loon et al. 2003). There, the sequence is particularly well defined and narrow, and it includes more than 90% of the sources. The obvious interpretation is that most stars are luminous red giants (AGB or RGB) at approximately the Galactic–Center distance, and that the extinction is small. The sources at the beginning of the sequence, with practically no 15 m excess, have the luminosity expected for Bulge giants at the tip of the first ascent red giant branch ([15] 8.5). The 15 m excess at the other end of the sequence is typical of that corresponding to the mass-loss rate from Mira variables ( a few /yr). The other stars of the sequence are thus “intermediate” AGB stars with very little, but still detectable, mass-loss. A few foreground or younger stars are also visible in the diagrams towards bluer colours and brighter magnitudes than the AGB sequence. Since dereddening is relatively easy in such lines of sight, the diagrams [15]0/(Ks–[15])0 and Ks0/(Ks–[15])0 are generally similar in their interpretation, tracing the same populations and their mass-loss and are even more sensitive than the [15]/[7]–[15] diagrams for mass-loss determination (Sect. 7).
The AGB sequence is also conspicuous in [15]/[7]–[15] diagrams in all other lines of sight (Fig. 8). Towards the very inner Bulge ( a few degrees, b , fourth row of Fig. 8), the sequence is vertically broadened by the very large and variable extinction AV 20 - 35 mags. Luminous and very cold AGB stars, mainly OH/IR stars, are also more numerous (Sect. 7.4). In addition, a population of luminous young stellar objects is conspicuous to the right of the diagrams (Sect. 8).
A similar AGB sequence is also visible in the lines of sight toward the Galactic Disk away from the Bulge. However, the diagrams are made less readily interpretable by the broader range of distances to the sources (see e.g. Jiang et al. 2003). The fraction of foreground sources (mostly RGB and AGB) is larger, which broadens the distributions towards the left. Depending on the line of sight, young stars may or may not be present in the (lower) right part of the diagrams; however, their distinction from AGB stars is not always obvious at the boundary of the AGB sequence (Sect. 8).
Although the information provided by the five–wavelength ISOGAL data is especially useful to estimate AV and the nature of the sources, it cannot remove all the ambiguities, in particular because of the non-simultaneity of the observations at various wavelengths. Complementary spectral information is necessary to check the photometric analysis and to address further questions such as metallicity. For most ISOGAL sources with AV 10, one needs near-IR spectroscopy. The recent results of Schultheis et al (2003) on lines of sight close to the Galactic Center illustrate the importance of such systematic follow-up programs: identification of mass-losing supergiants, of YSOs, of AGB stars with extremely red ISOGAL colours and the difficulty of separating YSOs and such AGB stars, metallicity estimates of inner Bulge AGB stars.
6.2 Red Giants
Sources on the upper first ascent red giant branch (RGB) are the most numerous at 7 m. Since there is no easy way to distinguish them, among ISOGAL sources, from the less numerous AGB stars of similar luminosity below the RGB tip based on ISOGAL measurements, we simply call stars of both types below the RGB tip “red giants”. (Symmetrically, “AGB stars” denotes stars on the asymptotic giant branch above the RGB tip). Since RGB red giants are very numerous in the ISOGAL data, and form a relatively homogeneous class of objects whose properties show less intrinsic dispersion than is seen on the AGB, 7 m sources are the best tracers of Galactic structure and of the old dominant stellar population. The low extinction at 7 m makes such tracers attractive in highly obscured regions of the inner Galactic Disk and Bulge. However, their interpretation is not really straightforward and needs some elaboration for two reasons: the extinction correction, although rather small, is not negligible, typically 0.3–0.5 mag (see Sect. 5.3); the uncertainty on the distance remains a major problem. Distance uncertainties are large and the reddening information yields only a rough distance determination when correlated with known structures. However, close to the Galactic Center direction, the highly peaked density in the central Bulge dominates the foreground and the background structures to such an extent that it allows, with some care, a detailed analysis of inner structure (see e.g. Alard 2001 for a near-infrared analysis). On the other hand, in the Disk away from the Bulge the distance uncertainty prevents any simple discussion of stellar ages based on AGB luminosities, and even a clear distinction between red giants and AGB stars.
An additional difficulty is that, especially in the Bulge region, the RGB tip magnitude, with [7] 8–8.5, is not very far from the ISOGAL sensitivity limit (Sect. 2) so that a completeness correction has to be applied, adding to the total uncertainty. The 7 m magnitude range usable for tracing structure will thus be reduced to about one magnitude. The surface density of red giants in the correct magnitude range is typically a few 103 deg-2, which gives good statistics in cells of a few 10-2 deg2, i.e. the typical dimension of the smallest ISOGAL fields. The latter give a sparse sampling of the stellar density of the inner Disk and Bulge, which can be compared with the density inferred from near-infrared surveys (see Alard 2001). Anyway, the best strategy is to combine near-IR and 7 m data: the 2MASS or DENIS Ks data allow one to check the completeness of the 7 m data and to correct 7 m counts; the 7 m data give a check on the extinction correction for the near-IR data.
Because of the difficulties described above, a comprehensive analysis of Galactic structure from ISOGAL data had to wait for a homogeneous and certified catalogue of ISOGAL sources. It is thus still in progress (see van Loon et al. 2003). Extension of current analyses of the red giant stellar populations at the scale of the ISOGAL fields, in the obscured inner Bulge and Disk, will be feasible with deeper near-IR and mid-IR observations with smaller pixels and larger cameras, with large ground telescopes in the near-IR and new space missions such as SIRTF or ASTRO–F.
6.3 Inner Bulge AGB: luminosity, photospheric colours and age
The AGB luminosity function is a very sensitive diagnostic of the age distribution of a stellar population. For ISOGAL, if the distance and the extinction are known, the luminosity is directly derived from the flux density in the five DENIS–ISOCAM bands, which cover the relevant spectral energy distribution (see e.g. Loup et al. 2003). Straightforward methods of interpolation and extrapolation provide a very good estimate of the total flux. Indeed, except for the extremely red ISOGAL sources, the dereddened Ks0 magnitude produces a good value of the total flux, since the Ks bolometric correction equals 3 for most sources with little scatter (see e.g. the discussion in Ojha et al. (2003) and the references therein). For a distance modulus of 14.5, corresponding to dGC = 8 kpc, the absolute bolometric magnitude of most ISOGAL-DENIS sources is thus approximately given by
| (1) |
Some care is required before determining the luminosity function of the Bulge ISOGAL sources. One needs to properly identify and discard foreground (and background) sources, to determine the interstellar extinction in the line of sight towards each source, to estimate the effects of the photometry and variability uncertainties, and to correct for count incompleteness.
The most obvious foreground sources are readily identified by inspection of the distribution of J–Ks for a given ISOGAL field or part of a field. In lines of sight towards the Bulge, the distribution of source counts is strongly peaked around a value (J–Ks) which corresponds to the mean extinction up to the central Bulge (Fig. 6). A minority of the sources lie below the bulk of J–Ks values, because they are in front of part of the dust down the line of sight towards the Bulge (see Sect. 5.3). However, this method is increasingly unreliable for more distant sources: depending on the inhomogeneity of the dust distribution in the Disk, Disk sources, nearer than the Bulge but close to it, cannot be distinguished from Bulge sources purely on the value of the extinction. The situation is similar for stars behind the Bulge (see e.g. Ojha at al. 2003).
The extinction in the line of sight towards a given star may often be accurately derived from the J and Ks magnitudes, either simply from the value
| (2) |
assuming an estimated value of J0–Ks0, or, better, from an isochrone Ks/J–Ks (see e.g. Schultheis et al. 1999, van Loon et al. 2003). However, this method fails when the extinction is so large (AV 25) that the star is not detected in J by DENIS or 2MASS (Sect. 5.3). One could then use another colour such as H–Ks (Alard 2001) or Ks–[7] (van Loon et al. 2003, Jiang et al. 2003). However, the method fails for very red AGB stars when the intrinsic colours such as J0 - Ks0 or Ks0–[7]0 are affected by the presence of mass-loss. A simpler, necessarily less accurate, method (Wood et al. 1998) is then to assume that such red AGB stars have the same interstellar extinction as the average bluer DENIS stars, such as determined e.g. by the general DENIS extinction map of the Bulge (Schultheis et al. 1999).
The present infrared surveys will significantly improve knowledge of the inner Bulge AGB population and allow the use of AGB stars as tracers to infer the age distribution of the inner Bulge stellar population (van Loon et al. 2003). Previous studies were mostly limited to the outer-Bulge low extinction windows (Frogel & Whitford 1987, Frogel et al. 1990, 1999, Tiede et al. 1995) or to very deep near-IR studies in very small fields (Rich et al. 1996), except for a few wide-area near-IR observations around the Galactic Center (Glass et al. 1987, Catchpole et al. 1990, Phillip et al. 1999).
Complementary data on Bulge AGB stars, allowing one to disentangle mixed populations, is becoming available from velocity information, extending previous work such as Sharples et al. (1990). Multi–object infrared or visible spectroscopy in regions where the extinction is not too high is currently feasible. Radial velocities of several hundreds of ISOGAL AGB stars are already measured from the detection of OH or SiO maser emissions (Sect. 7.4).
7 AGB circumstellar dust and mass–loss
As discussed in Sect. 6.1, the excess of emission at 15 m shows that the majority of sources detected at 15 m by ISOGAL are mass–losing AGB stars. ISOGAL thus provides a characterisation of AGB mass–loss in the whole inner Galaxy and especially in the inner Bulge. Such a very large sample, of several times 104 sources, with many extreme stars, will allow a large variety of follow-up studies of circumstellar envelopes to analyse their properties through the Galaxy. In particular, the identification of the exact nature of circumstellar dust in the bulk of AGB stars and in peculiar sources, as well as a good calibration of mass–loss, requires a comprehensive follow-up program of infrared spectroscopy: this is possible with SIRTF or ASTRO-F. ISOGAL CVF spectroscopy in a few small fields already brings preliminary information on AGB circumstellar dust in the central Galaxy.
7.1 CVF spectroscopy
In addition to the large imaging survey, ISOGAL has a small complementary spectroscopy program with the CVF mode of ISOCAM. It has provided 2-D integral-field spectroscopy (6 pixels, 5-16m, 35) in eighteen 3’ x 3’ sub-fields (32 x 32 pixels each) in chosen ISOGAL fields. This program had as dual goal of characterisation of the mid–infrared emission of the diffuse interstellar medium (dominated by PAHs, see Sect. 5.1 and Fig. 5) and of the strong point sources (AGB stars). Therefore, the CVF subfields were selected partly in regions of strong diffuse emission, and partly in fields of the intermediate Bulge with low diffuse emission and a high density of late type stars. It is known that the analysis of such CVF observations is particularly difficult in regions with strong diffuse emission and bright sources, such as ISOGAL fields, because of residual stray light. Consequently, the analysis of ISOGAL CVF spectra is still in progress (Blommaert et al. in preparation, Pérault et al. in preparation). Preliminary results have been discussed by Blommaert et al. (2000). The analysis of one 3’ x 3’ sub-field specially selected for the detection of Bulge late-type stars, has shown that around 30 objects were detected of which half had a significant flux density up to 16m. One may expect more than one hundred spectra of late-type stars from the other subfields. Most sources showing a mid–IR excess do not show the typical silicate feature often observed in Mira–type variables. The feature is much broader and peaks at longer wavelength (12m) than the traditional 9.7 m peak. Such broad emission features are common in IRAS data (Sloan & Price 1995 and references therein). They have been associated with aluminium oxide grains (Onaka et al. 1989, Egan & Sloan 2001 and references therein). It is predominantly observed in CVF spectra of sources with low mass-loss, in agreement with the interpretation that ISOGAL is mainly detecting the onset of the mass-loss on the AGB (Sect. 7.3).


7.2 15 m excess
The very red colours (Ks–[15])0 and [7]–[15] cannot be explained just by the emission of very cold photospheres, but are clearly dominated by dust emission. This is well demonstrated, e.g., in Fig. 9 for the two observed ISOGAL fields in the Baade’s Windows (Glass et al. 1999). For a number of stars with known spectral types, such observed infrared colours have been compared with the expected photospheric colours and the model isochrones derived from Bertelli et al. (1994) (van Loon et al. 2003). The 15 m excess is obvious for a large fraction of the sources. It increases with the luminosity and for the latest spectral types, as expected from the properties of mass–losing AGB stars in the solar neighbourhood. Similar 15 m excess measurements, showing the presence of circumstellar dust, are obvious in the analysis of every ISOGAL field (see Fig. 10, Omont et al. 1999, Alard et al. 2001, Ojha et al. 2003, Jiang et al. 2003). On the other hand, a similar excess at 7 m is much less obvious for most sources of Fig. 10 right, which are still dominated by photospheric emission at 7 m, except for the most luminous and coldest cases.
7.3 Mass–loss rates
Knowledge of the mid– or far–infrared emission characteristics of dust in circumstellar envelopes AGB stars is one of the best ways for estimating their mass–loss rates (see e.g. Jura 1987, Habing 1996, Le Bertre et al. 2001, Le Bertre & Winters 1998, Jeong et al. 2002 and references therein). As discussed in Ojha et al. (2003), the value of (Ks–[15])0 is the best way for deriving mass–loss rates from ISOGAL–DENIS data from the relation between and (Ks–[15])0 established from recent modelling by Jeong et al. (2002 and in preparation), which is in agreement with Whitelock et al. (1994) for (K-[12])0. When Ks0 is not accurately known, one can use [7]–[15], although this is less precise. However, in addition to the errors in (Ks–[15])0 due to variability and dereddening, such estimates of directly depend on the assumed model for circumstellar dust infrared properties and dust–to–gas ratio, which remain uncertain despite the important progress achieved by Jeong et al. (2002 and in preparation). Ojha et al. (2003) have performed a preliminary estimate of mass-loss rates from (Ks-[15])0 and Jeong et al’s model for the AGB stars of the ISOGAL fields of the intermediate Bulge ( 1∘ – 4∘). Within the old population, stars having small mass-loss rates contribute appreciably to the mass returned to the interstellar medium. However, larger mass-loss rates appear to have a dominent contribution for younger populations, and even the few stars (less than one percent) which have mass-loss rates 10-5 M⊙/yr, could dominate the mass return to the interstellar medium if they belong to the inner Bulge, although it is still unclear if indeed they do.
Systematic derivation of the distribution function of mass-loss rates for the AGB stars of the central Bulge and Disk, and of their global mass return to the interstellar medium is thus feasible, and will be a major outcome of ISOGAL. However, reliable consolidation of quantitative results relies on accurate observational validation of dust models, dereddening and Disk/Bulge discrimination, which are not simple tasks, but will certainly progress with future mid-infrared studies.
7.4 Specific AGB classes : Long-Period Variables, Masers
The largest AGB mass-loss rates ( 10-7 M⊙/yr) are associated with large amplitude, long period variability. In a very few ISOGAL fields of the Bulge, Mira-type long-period variables (LPV) had been previously identified by Lloyd Evans (1976), Glass & Feast (1982) and Glass et al. (1995, 2001). As expected, they correspond to bright ISOGAL sources with large values of (Ks–[15])0 (1.5–2.0) and [7]–[15] (1.0–1.5) (Glass et al. 1999, Schuller et al. in preparation). Information on large-amplitude variability may also be obtained in the few fields with repeated ISOGAL observations with identical parameters at different dates (Schultheis et al. 2000, Schuller et al. in preparation).
Discussions of the variability of ISOGAL sources have been considerably extended by the analysis by Glass & Alves (2000, Alard et al. 2001) of the MACHO data in two ISOGAL fields in Baade’s Windows. MACHO V and R light curves were derived for more than 300 ISOGAL stars, practically all those detected both at 7 and 15 m in the regions of the two fields observed by MACHO. These stars, mainly on the AGB and at the RGB-tip, are found to possess a wide and continuous distribution of pulsation periods. About 5% are Miras and nearly all the others are semi-regular variables with periods from 10 to 230 days and small amplitudes. Their mass-loss rates depend on luminosity and pulsation period. Some stars lose mass as rapidly as short-period Mira variables but do not show Mira-like amplitudes. It is found that a period of 70 days or longer is a necessary but not sufficient condition for mass-loss to occur. The DENIS and 2MASS near-infrared properties of these ISOGAL LPVs and their optical spectral types have been discussed by Schultheis & Glass (2001) and Glass & Schultheis (2002).
OH/IR stars are known to have the most extreme mass-loss rates among AGB stars, even larger than Miras. Their census is reasonably deep in a region 1∘ around the Galactic Center, which has been well covered by ISOGAL observations. Ortiz et al. (2002) have found that all the known OH/IR stars observed by ISOGAL are among the brightest 15 m sources detected. A mass-loss rate can be estimated from (Ks-[15])0 or ([7]-[15])0, and a bolometric luminosity L determined from dereddened magnitudes in the DENIS–ISOCAM bands. L is directly related to the initial mass Mi of the star and hence to its age. The number of the most luminous OH/IR stars thus reflects their formation rate in the inner Bulge 108–109 yr ago. Preliminary results by Ortiz et al. (2002) confirm that this number is relatively small.
A systematic search for 86 GHz SiO maser emission has begun using the IRAM 30 m telescope (Messineo et al. 2002). SiO masers have been detected in a large percentage of ISOGAL sources with infrared colours and magnitudes characteristic of Long Period Variables. More than 270 detections have already been achieved and their line–of–sight velocities indicate that the stars are located in the inner Galaxy. These new detections double the number of line–of–sight velocities derived from previous observations of OH and SiO masers in the central parts of the Galaxy and will facilitate dynamical studies. The newly-obtained longitude-velocity diagram clearly reveals a stellar nuclear Disk component. Follow-up near-infrared spectroscopy of those high-velocity SiO masing stars has been started (Messineo et al. in preparation). The analysis of the infrared properties of OH and SiO stellar maser emitters will also give new clues on the occurrence of the different masers with AGB type.
7.5 Related cases: M Supergiants, Planetary Nebulae and PPNe
It is clear that ISOGAL has detected most M supergiants present in the observed fields. The census of ISOGAL supergiants is triply interesting: it gives direct information on the star formation in the last few tens of millions of years in the inner Galaxy, especially in the broad neighbourhood of the Galactic Center; it offers specific information on the mass-loss from inner-galaxy supergiants; and it may yield the discovery of new exceptional objects, if any, with very large mass-loss and luminosity similar to VY CMa or NML Cyg (as, e.g., in the LMC for the exploitation of the MSX/2MASS data by Egan et al. 2001). It is clearly difficult to distinguish supergiants from AGB red giants from their luminosity unless their distance is known.
A census of the most luminous infrared sources in the broad vicinity of the Galactic Center is thus in progress from ISOGAL data complemented by the MSX survey (Schuller 2002, Chitre et al. in preparation). Preliminary results from Schuller (2002) have identified a couple of hundred M supergiant candidates. As for AGB stars (Sect. 7.3), reasonable estimates of the mass-loss rates can be provided by the values of (Ks–[15])0 or [7]–[15]. The mass-loss rates of red supergiants may span a large range of values (Jura 1987, Omont et al. 1993 ). Most of supergiant candidates identified by Schuller (2002) have relatively low luminosity in the range 2–5 104 L⊙ with low mass-loss. A few luminous ( 105 L⊙) supergiants with quite appreciable mass-loss rates (10-6-10-5 M⊙/yr) have also been identified in the central Bulge/Disk (Schultheis et al. 2003, Schuller 2002), outside the three well known clusters of massive young stars which could not be observed by ISOGAL because of the need to avoid detector saturation. However, no new extraordinary object with huge mass-loss, comparable to the few known in the Disk, has been identified in ISOGAL or MSX data within several degrees of the Galactic Center. In some cases, it may be very difficult to distinguish a low luminosity supergiant from a high luminosity AGB star without spectroscopy. Since optical spectroscopy is practically impossible for sources with very large extinction, it is necessary to rely on infrared spectroscopy. Preliminary results of the near-IR spectroscopy program of ISOGAL sources in the central Bulge (Schultheis et al. 2003) have confirmed the identification of a few such luminous mass-losing red supergiants.
Planetary nebulae (and post-AGB pre-planetary nebulae, PPNe) are another class of very red ISOGAL sources not easily distinguishable from YSOs and extremely red AGB stars, without information at longer wavelength than 15 m. Beyond the few planetary nebulae previously known in the ISOGAL fields, the search for such objects among ISOGAL sources thus requires additional information and is just beginning (Gorny et al. in progress).
8 Dust enshrouded young stars and star formation
Young stars with dusty circumstellar disks or cocoons (YSOs) are the second large class of Galactic sources identified by their excesses in the mid- or far-infrared. However, given the emission excess induced by large amounts of cold dust, relatively far infrared data, at 25 or 60 m, are generally essential to distinguish YSOs from AGB stars. The lack of a wavelength longer than 15 m in ISOGAL is a serious handicap to the identification of YSOs from the much more common AGB stars. The main criterion available for this purpose with ISOGAL–DENIS data is a very large excess in the colours [7]–[15] or (Ks–15)0 (similarly, very large Ks - [8.3] 2MASS–MSX colours have been used by Egan et al. (2001) to identify YSOs in LMC). However, robust discrimination between YSOs and AGB stars in ISOGAL data remains difficult. Additional criteria which are useful to fully confirm the identification of YSOs among ISOGAL sources (except for those with very large 15 m excess) include (Schuller 2002): the spatial extent of the ISOGAL source; association with a known star-forming region; association with a radio source; far-IR excess in MSX or IRAS data; infrared (or visible) spectroscopy.
Felli et al. (2000) have stressed that many luminous ISOGAL YSOs are extended sources. However, no systematic, complete extraction of extended sources has been performed yet; but the present Point Source Catalogue also contains sources of moderate extent, with sizes of the order of 10-20 (FWHM). These slightly-extended sources, if sufficiently bright, can be separated from the really point-like sources thanks to abnormally high values of their uncertainty on the measured magnitudes, with typical 0.15 mag for bright sources, whereas point sources in the same brightness range generally have mag. Aperture photometry has shown that the magnitude of such sources can in fact be underestimated by about 1 mag (Schuller et al. 2003, Schuller 2002).
The case of the most luminous, and, hence, most massive, YSOs [F(15m) 0.3 Jy, L 2500 L⊙ at 5 kpc, implying M 10 M⊙] has been systematically discussed by Felli et al. (2000, 2002). They have shown, from a radio identified sample of YSOs (Becker et al. 1994, Testi et al. 1999) that the criterion [7]–[15] 1.8 can be used to identify YSO candidates with a probability greater than 50%. Furthermore, the more conservative condition [7]–[15] 2.5 provides a more reliable discrimination from AGB (OH/IR) stars (however, see Schultheis et al. 2003). The first condition ([7]–[15] 1.8 with [15] 4.5, i.e. F(15m) 0.3 Jy) is met by 715 7–15 m sources of the ISOGAL catalogue, which are thus luminous YSO candidates. However, they represent only 2% of the total number of sources with good detection at both wavelengths. One should add about a hundred objects with comparable 15 m flux density, not detected at 7 m, most of which are probably young. The majority of these young ISOGAL stars are located in the molecular ring, or in the inner Bulge; their projected density is considerably higher in the latter (Felli et al. 2002). In his PhD Thesis, Schuller (2002) has made a complete analysis of the ISOGAL and MSX YSO candidates in the inner Bulge, within 1.65∘, b 0.5∘. Selecting them from their red 7–15 m colour and their extended 15 m emission, he has identified several hundred of them with O star luminosities. This allows a preliminary discussion of the present global formation rate of massive stars in the inner Bulge.
The ISOGAL catalogue includes a number of nearer, less massive young stars, mainly in nearby spiral arms at 1 or 2 kpc. Their colour [7]–[15] 1.2 is similar to the young stars in the main star forming regions, much closer to the Sun, studied by Nordh et al. (1996) and Bontemps et al. (2001). For many of these ISOGAL sources it is difficult to confirm their identification. However, such groups of sources are clearly apparent in some fields where other evidence of star formation is known, such as M16. A complete census of such ISOGAL low-mass young stars is still to be done. However, dedicated studies of particular regions are in progress.
Of course, such YSO analyses cannot be decoupled from studies of mm/submm molecular line and dust emission, and the identification of mid-IR dark condensations as discussed in Sect. 5.2. In some cases, red ISOGAL point sources, possibly YSOs, seem to be associated with such condensations (Teyssier et al. 2002).
8.1 Foreground stars with mid–IR excess
A small fraction (less than 1%) of ISOGAL sources seem to display a mid-IR excess while their visible/near-IR colours (e.g. I–J) are relatively blue. The latter imply little or no interstellar extinction, and thus that such sources are relatively nearby (typically a few 102 pc), in the foreground with respect to the bulk of the ISOGAL sources in a given field. In a number of them, the value of I–J ( 1) points to early spectral types (B to G) which has been confirmed by optical spectroscopy for some of them (Schultheis et al. 2002, Schuller et al. in preparation).
The first question to address is the reality of the associations of the sources detected in the different bands, especially between DENIS and ISOCAM sources. A close inspection of the astrometric accuracy of the cross-identification and of the near-IR DENIS and 2MASS images shows that in many cases spurious associations between a foreground main–sequence star and a distant AGB star may not be excluded (Schultheis et al. 2002). However, there remains a number of cases where there is no direct evidence to doubt the associations. Visible spectroscopy has confirmed a few tens of such cases of apparently good associations of 15 m excess objects with early spectral types. It seems unlikely that the majority of them could be spurious associations, especially for the large fraction (50%) which display emission lines. These ISOGAL sources should thus belong in most of cases to one of the classes of early type objects which are known to display mid-IR excess.
It is known that such a combination of colours can correspond to a configuration with optically thin distant dust, such as a face–on disk (or a detached shell, or binary objects such as dusty symbiotic stars). The most frequent cases are young stars with such a disk, and the many cases of A or B stars with emission lines could be mostly Herbig Ae/Be stars. It is possible that a few other cases are older objects with debris disks such as Pic or Vega. However, it will be difficult to confirm such cases without further mid– to far–IR observations, in particular with SIRTF or ASTRO-F, complemented with deep near–IR imaging to confirm the reality of the mid/near-IR associations. A last obvious possibility is post–AGB stars or related classes of stars. However, such objects are known to be rare so that the probability of finding nearby ones, within the limited total area observed by ISOGAL, remains small. Finally, we note that Schultheis et al. (2002) have found in a couple of such B stars an intriguing bump between 5000 and 6000 which could be similar to the extended red emission (ERE) known in reflection nebulae and in the post–AGB Red Rectangle.
9 Summary
With the completion of the data reduction and processing of the ISOGAL mid-infrared observations on about 16 sq. degrees in the Galactic plane, and the subsequent detection of about 100000 cool stars in up to five infrared bands (ISO 7-15 m, DENIS I, J, Ks), the ISOGAL survey provides new insights into the stellar populations and interstellar mid-IR diffuse emission of the Central Galaxy, and how they are different from those in the vicinity of the solar system. High sensitivity (approaching 10-20 mJy in normal fields outside of star-forming regions) and good spatial resolution (6 or better) make the ISOGAL survey about two orders of magnitude deeper than IRAS in the central Galactic Disk, and more sensitive than the MSX survey by one or two magnitudes at 7–8 m, and by three or four magnitudes at 15 m, (although MSX observed an area two hundred times larger, but with a pixel size three times larger). The observed fields sample the Galactic Disk, mainly within 30∘, b 1∘, mostly avoiding regions of active star formation where bright sources could have saturated the detectors. Special observation modes were developed allowing the study of a few star-forming regions with data often of poorer quality; in particular a large fraction of the area within 1∘ of the Galactic Center was observed with 3 pixels.
Version 1 of the ISOGAL Point Source Catalogue (ISOGAL-PSC-V1) is being released at CDS/VizieR and on the ISOGAL web site, www-isogal.iap.fr/, simultaneously with the present paper and with the catalogue’s Explanatory Supplement (Schuller et al. 2003). The ISOGAL-PSC-V1 includes systematic cross-identifications with DENIS data, from special DENIS observations and data processing (Simon et al. in preparation), and detailed quality flags. Data processing and data quality are discussed in detail in Schuller et al. (2003). The released data have been conservatively selected to ensure well-defined reliability and photometric quality. The typical ISOGAL photometric accuracy is generally about 0.2 mag rms. The ISOGAL astrometry is tied to DENIS astrometry in most fields ; it is thus better than 0.5 for sources with DENIS counterparts (partly limited by the accuracy of the present DENIS reference Catalogue, USNO_A2).
The high spatial resolution information on diffuse mid-infrared emission in ISOGAL images provides a wealth of information about its carriers (PAHs and dust, Fig. 5), as well as about the interstellar radiation which ex s them. The ISOGAL survey identified a population of narrow (down to 10 in size) very dark filaments and globules, seen in absorption in front of diffuse galactic emission at 7 and 15 m, which are visible in practically all ISOGAL images. Such infrared dark clouds are similar to those detected by the MSX survey on larger scales, as well as by IRAS with a much lower angular resolution. Their typical properties – dimension a fraction of a parsec, density above 105 cm-3 and mass more than 103 M⊙ – have been confirmed by millimetre-wave observations.
The very low value of the interstellar extinction at mid-IR wavelenths means that ISOGAL data are useful complements to near-IR data in determining extinction along lines of sight with very large extinction, values of AV 20. One may use, e.g., either the value of the Ks–[7] colour along the line of sight of DENIS or 2MASS red giants without circumstellar dust, or the dimming of mid-IR diffuse emission by infrared dark clouds. However, such methods rely on well–established values for the mid–IR interstellar extinction law. Preliminary analysis of ISOGAL data tends to confirm that this extinction law is close to classical values (see e.g. Mathis 1990) in most of the Galactic Disk. However, continuing analyses may provide evidence that it differs in certain regions such as the vicinity of the Galactic Center.
The several colour–magnitude diagrams (CMD) and colour–colour diagrams that one can create with the diverse combinations of the five bands from ISOCAM and DENIS can effectively distinguish between intrinsic source properties and effects due to interstellar extinction. Most ISOGAL sources are red giants with luminosities within a couple of magnitudes of the tip of the first giant branch. Most 15 m sources are AGB stars above the first GB tip and are long–period or semi–regular variables. ISOGAL sources are useful tracers of the stellar populations of the central Galaxy, especially in the most obscured regions of the inner Galactic Bulge and Disk. Multi-wavelength data allow one to estimate the luminosity function in the inner Bulge where the distance is known. A preliminary analysis there confirms the presence of a relatively young component together with the Old Bulge population.
The 15 m excess, determined by multi-wavelength analysis and observed in a large fraction of 15 m ISOGAL AGB sources, allows a systematic analysis of AGB mass-loss in the inner Galactic Disk and Bulge from a sample of more than 104 sources. Mass-loss rates are determined from recent modeling of their circumstellar dust (Jeong et al. 2002), allowing a preliminary estimate of the total mass-loss returned to the interstellar medium. The few ISOCAM–CVF spectra (5–16 m) observed in the ISOGAL program will be useful for this purpose, together with theoretical modeling and SIRTF or ASTRO-F spectra.
ISOGAL has also detected a number of young stars of diverse types with circumstellar dust. They range from massive YSOs at large distances, up to that of the Galactic Center, to less massive stars mainly in nearby spiral arms at 1 or 2 kpc. Analysis is in progress from ISOGAL colours and additional information.
In addition to “normal” evolved and young stars, the very large ISOGAL sample also contains a variety of peculiar stars with circumstellar dust : supergiants, post-AGB stars, planetary nebulae, symbiotics, foreground early type stars, etc., with in particular diverse types of circumstellar disks. The ISOGAL data are thus a treasury, still little exploited, for follow-up observations especially by future mid-IR space missions such as SIRTF, ASTRO-F and NGST, and high–resolution ground–based studies, aimed at the circumstellar physics and evolution of such objects.
The present results derived from the ISOGAL survey are published or in advanced preparation in about 25 refereed papers. We are already considering a second release of ISOGAL products with improved quality and with extended associations : better-corrected images (Miville–Deschênes et al. 2000 and in preparation); a V2 point source catalogue with better photometry and sensitivity; associations with 2MASS, MSX and IRAS sources ; better astrometry with new DENIS astrometry and 2MASS, etc.
Acknowledgements
The ISOCAM data presented in this paper were analysed using ‘CIA’, a joint development by the ESA Astrophysics Division and the ISOCAM Consortium. The ISOCAM Consortium is led by the ISOCAM PI, C. Cesarsky. We thank T. Prusti, R. Siebenmorgen, H. Aussel, R. Gastaud, J.L. Starck and many other members of the ISOCAM team, of the ISO/ESA team at Villafranca and especially of the CIA team for their constant help in the ISOGAL observations and data reduction. We thank the ISO/SWS team and its PI, T. de Graauw, for providing the ISOCAM data of the GPSURVEY project for a joint analysis with ISOGAL data.
This work was carried out in the context of EARA, the European Association for Research in Astronomy.
S. Ganesh and D. Ojha were supported by a fellowship from the Ministère des Affaires Etrangères, France, and this project was supported by the Project 1910-1 of the Indo-French Center for the Promotion of Advanced Research (CEFIPRA), as well as by CNES. M. Schultheis acknowledges the receipt of an ESA fellowship. B. Aracil, T. August, X. Bertou, P. Hennebelle and A. Soive were posted to the ISOGAL Project by the Délégation Générale de l’Armement, France. The participation of I. Glass in the ISOGAL project was supported by a CNRS-NRF grant (NRF= National Research Foundation, South Africa).
We thank all the members of the DENIS team who allowed obtaining the DENIS data. The DENIS project is partially funded by European Commission through SCIENCE and Human Capital and Mobility plan grants. It is also supported, in France by the Institut National des Sciences de l’Univers, the Education Ministry and the Centre National de la Recherche Scientifique, in Germany by the State of Baden-Würtemberg, in Spain by the DG1CYT, in Italy by the Consiglio Nazionale delle Ricerche, in Austria by the Fonds zur Förderung der wissenschaftlichen Forschung und Bundesministerium für Wissenshaft und Forschung, in Brazil by the Foundation for the development of Scientific Research of the State of Sao Paulo (FAPESP), and in Hungary by an OTKA grant and an ESOC&EE grant.
References
- Alard (2001) Alard, C., 2001, A&A 552, 289
- Alard et al. (2001) Alard, C., and The ISOGAL & MACHO Collaborations, 2001, ApJ 522, 289
- Arendt et al. (1994) Arendt, R.G., Berriman, G.B., Boggess, N., et al., 1994, ApJ, 425, 85
- Becker, White, Helfand, & Zoonematkermani (1994) Becker, R. H., White, R. L., Helfand, D. J., & Zoonematkermani, S. 1994, ApJS, 91, 347
- Bertelli et al. (1994) Bertelli, G., Bressan, A., Chiosi, C., et al. 1994 A&AS, 106, 275
- Bontemps et al. (2001) Bontemps, S., André, P., Kaas, A.A., et al. 2001, A&A 372, 1; 372, 173
- Blommaert et al. (2000) Blommaert, J.A.D.L. & the ISOGAL Collaboration, 2000, Mem. Soc. Astron. Ital., 71, 623
- (8) Blommaert, J. A. D. L., Siebenmorgen R., Coulais A., et al. 2001, “The ISO Handbook, Volume III: CAM - The ISO Camera” http://www.iso.vilspa.esa.es/manuals/HANDBOOK/III /cam_hb/
- Boulanger & Pérault (1988) Boulanger, F., & Pérault, M., 1988, ApJ 330, 964
- Burgdorf et al. (2000) Burgdorf, M. J., Cohen, M., Price, S. D., et al., 2000, A&A 360, 111
- Cambrésy et al. (1999) Cambrésy, L., 1999, A&A 345, 965
- Carey et al. (1998) Carey, S. J., Clark, F. O., Egan, M. P., et al., 1998, ApJ, 508, 721
- Carey et al. (2000) Carey, S. J., Feldman, P. A., Redman, R. O., et al., 2000, ApJ 543, L157
- Catchpole, Whitelock, & Glass (1990) Catchpole, R. M., Whitelock, P. A., & Glass, I. S. 1990, MNRAS, 247, 479
- Cesarsky et al. (1996) Cesarsky, C., Abergel A., Agnesse P., et al. 1996 A&A, 315L, 32
- Cutri (1998) Cutri, R. M. 1998, BAAS, 30, No. 2,64.02.
- Draine & Lee (1984) Draine, B. & Lee, H., 1984, ApJ 285, 89
- Egan & Price (1996) Egan M. & Price S., 1996, AJ 112, 2862
- Egan et al. (1998) Egan, M.P., Shipman, R.F., Price, S.D. et al. 1998, ApJ 494, 199
- Egan et al. (1999) Egan, M.P., Price, S.D., Moshir, M.M., et al. 1999, AFRL-VS-TR-1999, 1522 http://www.ipac.caltech.edu/ipac/msx/msx.html
- Egan, Van Dyk, & Price (2001) Egan, M. P., Van Dyk, S. D., & Price, S. D. 2001, AJ 122, 1844
- Epchtein et al. (1997) Epchtein N. et al. 1997, Messenger 87, 27
- Felli et al. (2000) Felli, M., Comoretto, G., Testi, L., Omont, A. & Schuller, F. 2000, A&A 362, 199
- Felli et al. (2002) Felli, M., Testi, L., Schuller, F. et al., 2002, A&A 392, 971
- Frogel & Whitford (1987) Frogel, J.A. & Whitford, A.E., 1987, ApJ 320, 199
- Frogel et al. (1990) Frogel, J.A., Terndrup, D.M., Blanco, V.M. & Whitford, A.E., 1990, ApJ 353, 494
- Frogel et al. (1999) Frogel, J.A., Tiede, G.P. & Kuchinski, L.E., 1999, AJ 117, 2296
- Glass & Feast (1982) Glass, I.S., & Feast, M.W., 1982 MNRAS 199, 245
- Glass et al. (1987) Glass, I.S., Catchpole & R. M., Whitelock, P. A., 1987, MNRAS, 227, 373
- Glass et al. (1995) Glass, I.S., Whitelock, P.A., Catchpole & R.M., Feast, M.W., 1995, MNRAS 273, 383
- Glass (1999) Glass I.S., 1999, Handbook of Infrared Astronomy, Cambridge, Univ. Press
- Glass et al. (1999) Glass, I.S., Ganesh, S., Alard, C. et al. 1999, MNRAS 308, 127
- Glass & Alves (2000) Glass, I. S. & Alves, D. R. 2000, ISO Survey of a Dusty Universe, Proceedings of a Ringberg Workshop. Ed. by D. Lemke, M. Stickel, and K. Wilke, Lecture Notes in Physics, vol. 548, p.363
- Glass et al. (2001) Glass, I.S., Matsumoto, S., Carter, B.S. & Sekiguchi, K. 2001, MNRAS 321, 77
- Glass & Schultheis (2002) Glass, I.S. & Schultheis, M., 2002, MNRAS 337, 519
- Habing (96) Habing, H.J. 1996, A&A Rev. 7, 97
- Hennebelle et al. (2001) Hennebelle, P., Pérault, M., Teyssier, D. & Ganesh, S. 2001, A&A 365, 598
- (38) Jeong, K.S., Winters, J.M., Le Bertre, T., & Sedlmayr E. 2002, in Mass-losing Pulsating Stars and their Circumstellar Matter eds. Y.Nakada, M. Honma and M. Sekiin.
- Jiang et al. (2003) Jiang, B., Omont, A., Ganesh, S., Simon, G. & Schuller F., 2003, A&A in press
- Jura (1987) Jura, M. 1987, ApJ, 313, 743
- Kessler et al. (1996) Kessler, M. F. et al. 1996, A&A, 315, L27
- Le Bertre T. & Winters (1998) Le Bertre, T. & Winters, J.M., 1998, A&A 334, 173
- (43) Le Bertre, T., Matsuura, M., Winters, J.M., et. al. 2001, A&A, 376, 997
- (44) Lim, T. L., Vivares, F., Caux & E., King, K. J., 2000, in ISO Beyond Point Sources: Studies of Extended Infrared Emission. Ed. by R. J. Laureijs, K. Leech and M. F. Kessler, ESA-SP 455, p. 15.
- Lis, Menten, Serabyn, & Zylka (1994) Lis, D. C., Menten, K. M., Serabyn, E., & Zylka, R. 1994, ApJ 423, L39
- Lis, Serabyn, Zylka, & Li (2001) Lis, D. C., Serabyn, E., Zylka, R., & Li, Y. 2001, ApJ 550, 761
- Lloyd Evans (1976) Lloyd Evans, T. 1976, MNRAS, 174, 169
- Loup et al. (2003) Loup, C., Groenewegen, M.A.T., Cioni, M.R., et al. 2003, submitted to A&A
- Lutz et al. (1996) Lutz, D., Feuchtgruber H., Genzel R. et al. 1996, A&A 315, L272
- Mathis (1990) Mathis, J., 1990, ARA&A 28, 37
- Messineo et al. (2002) Messineo, M., Habing, H.J., Sjouwerman, L.O., Omont, A. & Menten, K.M., 2002, A&A 393, 115
- Miville-Desch ^enes, Boulanger, Abergel, & Bernard (2000) Miville-Deschênes, M.-A., Boulanger, F., Abergel, A. & Bernard, J.-P. 2000, A&AS 146, 519
- Moneti et al. (2001) Moneti, A., Stolovy, S., Blommaert, J. A. D. L., Figer, D. F. & Najarro, F. 2001, A&A 366, 106
- Nordh et al. (1996) Nordh, L., Olofsson, G., Bontemps, S., et al. 1996, A&A 315, L185
- Ojha et al. (2003) Ojha, D.K., Omont, A., Simon, G. et al. 2003, submitted to A&A
- Omont et al. (1993) Omont, A., Loup, C., Forveille, T., et al. 1993, A&A 267, 515
- Omont et al. (1999) Omont, A., Ganesh S., Alard C. et al. 1999, A&A 348, 755
- (58) Onaka, T., de Jong, T. & Willems, F.J., 1989, A&A 218, 169
- Ortiz et al. (2002) Ortiz, R., Blommaert, J.A.D.L., Copet, E., et al. 2002, A&A 388, 279
- Ott et al. (1997) Ott, S. et al. 1997, ASP Conf. Ser. 125: Astronomical Data Analysis Software and Systems VI, 6, 34
- Pérault et al. (1996) Pérault, M., Omont A., Simon G. et al. 1996, A&A 315, L165
- Philipp et al. (1999) Philipp, S., Zylka, R., Mezger, P. G., et al., 1999, A&A 348, 768; 348, 457
- Pierce-Price et al. (2000) Pierce-Price, D., Richer, J.S., Greaves, J.S., et al. 2000, ApJ 545, L121
- Price et al. (2001) Price, S.D., Egan, M.P., Carey, S.J., et al. 2001, AJ 121, 2819
- Rich (1996) Rich, M. 1996, IAU Symp. 171: New Light on Galaxy Evolution, 171, 19
- Rieke & Lebofsky (1985) Rieke G. & Lebofsky M, 1985, ApJ 288, 618
- Schuller (2002) Schuller, F., 2002, PhD Thesis, Université Paris 7
- Schuller et al. (2003) Schuller, F., Ganesh, S., Messineo, M., et al. 2003, A&A in this issue
- Schultheis et al. (1999) Schultheis, M., Ganesh, S., Simon, G. et al. 1999, A&A 349, L69
- Schultheis et al. (2000) Schultheis, M., Ganesh, S., Glass, I.S., et al. 2000, A&A 362, 215
- Schultheis & Glass (2001) Schultheis, M., & Glass, I.S. 2001, MNRAS, 327, 1193
- Schultheis et al. (2002) Schultheis, M., Parthasarathy, M., Omont, A. et al., 2002, A&A 386, 899
- Schultheis et al. (2003) Schultheis, M., Lançon, A., Schuller, F. et al. 2003, submitted to A&A
- Sharples, Walker, & Cropper (1990) Sharples, R., Walker, A., & Cropper, M. 1990, MNRAS, 246, 54
- Simon et al. (2001) Simon, R., Jackson, J. M., Bania, T. M., et al., 2001, American Astronomical Society Meeting, 199, #97.06
- (76) Sloan, G.C. & Price, S.D., 1995, ApJ 451, 758
- Skrutskie et al. (1997) Skrutskie, M.F. et al. 1997, in The Impact of Large Scale Near-IR Sky Surveys, p187-195, F. Garzon et al. (eds.), Kluwer (Netherlands).
- Testi et al. (1997) Testi L., Felli M., Omont A. et al. 1997, A&A 318, L13
- Testi, Felli, & Taylor (1999) Testi, L., Felli, M., & Taylor, G. B. 1999, A&AS, 138, 71
- Teyssier et al. (2002) Teyssier, D., Hennebelle & P., Pérault, M., 2002, A&A 382, 624
- Tiede et al. (1995) Tiede, G.P., Frogel, J.A. & Terndrup, D.M., 1995, AJ 110, 2788
- (82) van de Hulst, H.C., 1946, Rech. Astron. Obs. Utrecht, 11, 1
- van Loon et al. (2003) van Loon, J.T., Gilmore, G.F., Omont, A., et al. 2003, MNRAS 338, 857
- (84) Whitelock, P.A., Menzies, J., Feast, M.W., et al. 1994, MNRAS, 267, 711
- Wood, Habing, & McGregor (1998) Wood, P. R., Habing, H. J., & McGregor, P. J. 1998, A&A 336, 925