Observations of H i absorbing gas in compact radio sources at cosmological redshifts
We present an overview of the occurrence and properties of atomic gas associated with compact radio sources at redshifts up to . Searches for H i 21 cm absorption were made with the Westerbork Synthesis Radio Telescope at UHF-high frequencies (725–1200 MHz). Detections were obtained for 19 of the 57 sources with usable spectra (33%). We have found a large range in line depths, from to . There is a substantial variety of line profiles, including Gaussians of less than 10 km s-1, to more typically 150 km s-1, as well as irregular and multi-peaked absorption profiles, sometimes spanning several hundred km s-1. Assuming uniform coverage of the entire radio source, we obtain column depths of atomic gas between and ( K)() cm-2. There is evidence for significant gas motions, but in contrast to earlier results at low redshift, there are many sources in which the H i velocity is substantially negative (up to km s-1) with respect to the optical redshift, suggesting that in these sources the atomic gas, rather than falling into the centre, may be be flowing out, interacting with the jets, or rotating around the nucleus.
Key Words.:
Galaxies: active – Galaxies: evolution – Galaxies: ISM – Radio lines: galaxies1 Introduction
The energy output from AGN is commonly agreed to be powered by accretion onto a super-massive black hole, resulting from the infall of gas transported from the host galaxy down to the central regions (e.g., Rees rees84 (1984)). Recent detailed and statistical studies of Seyfert galaxies (e.g., Cid Fernandes et al. cid01 (2001)) are beginning to chart the evolutionary sequence that leads to the production of an active galactic nuclei in late-type (Sd through S0) galaxies and the effect of that evolution on the host galaxy (e.g., Storchi-Bergmann et al. storchi01 (2001)). The picture that is emerging is one of a close tie between the galaxy environment and galaxy-galaxy interactions leading to a temporal sequence of circumnuclear starbursts and accretion onto the nuclear black hole (e.g., Sanders et al. sanders88 (1988)).
However, while this picture is becoming well defined for Seyferts, very little is known regarding the situation in powerful radio galaxies. The mostly radio-quiet AGN in a large nearby galaxy sample studied by Ho et al. (ho97 (1997)) often reside in early-type disk galaxy hosts, many of which have spiral structures, and the amount of gas needed to sustain the low-luminosity activity for the expected lifetime is readily available. But looking at radio-loud AGN, Martel et al. (martel99 (1999)) have found that at least 89% of the hosts of 46 low-redshift () 3CR radio galaxies are ellipticals. At larger redshifts, Dunlop et al. (dunlop03 (2003)) have shown that the host galaxies of radio-quiet and radio-loud quasars, as well as radio galaxies, are massive ellipticals. These may of course themselves be merger products of late type galaxies. True spiral hosts of powerful radio galaxies seem to be very rare (see also Ledlow et al. ledlow98 (1998)).
The predominance of elliptical hosts is often thought to be puzzling, since these are usually assumed to be gas poor. It should be noted first that major galaxy merger products are likely places where gas has lost angular momentum and can feed into the central engine. Apart from that, Walsh et al. (walsh89 (1989)) have shown that in ellipticals the amount of long-wavelength IR emission, indicative of the presence of dust and gas, is correlated with the occurrence and strength of a central radio source. More recently, it has been shown that early-type galaxies can contain gas in both molecular form (see e.g. Rupen rupen97 (1997); Knapp & Rupen knapp96 (1996)), and in atomic form (see e.g. Bregman et al. bregman92 (1992); Oosterloo et al. oosterloo99 (1999)), and this gas could act as a fuel reservoir for the central engine. Indeed, central structures of gas are frequently observed in nearby radio sources; for instance, 17 of 19 nearby FRI radio galaxies observed with the HST by Verdoes Kleijn et al. (verdoes99 (1999)) have dust structures in their centres. Such dust disks are also reported in molecular (e.g in 4C12.50, Evans et al. evans99 (1999)) and atomic lines, e.g. in NGC 4261 (Van Langevelde et al. vanlangevelde00 (2000)) and NGC 1052 (Vermeulen et al. 2003a ). Furthermore, observations of nearby radio-loud AGN by van Gorkom et al. (vangorkom89 (1989)) have directly shown, in about 30% of the galaxies studied, the presence of cold gas visible through the H i cm line of neutral hydrogen in absorption towards the central radio source. In a recent study, Morganti et al. (morganti01 (2001)) have found evidence that in their radio galaxy sample the H i detections are related to circumnuclear tori.
At cosmological redshifts, the galactic medium is largely unexplored. But the recent upgrade of the Westerbork Synthesis Radio Telescopes (WSRT) has opened up a new avenue of research. The array of 14 telescopes, with its new multi-channel correlator (DZB), offers good sensitivity as well as a superior capability to reject external interference compared to single dish telescopes. The wide band UHF-high receivers, spanning 725–1200 MHz, enable studies of the occurrence and kinematics of atomic gas seen by means of the redshifted H i line in absorption against radio sources almost out to . We here present the combined results of a number of H i line searches performed at the WSRT. These projects had a variety of goals, all related to the properties of cold gas in compact radio sources with a total extent less than a few arcseconds, within the appropriate redshift range, in the Northern sky, and with a flux density above a few hundred mJy (in order to have a reasonable opacity detection threshold). A majority of the sources in this paper are classified as Gigahertz Peaked Spectrum (GPS) or Compact Steep Spectrum (CSS) sources, believed to be intrinsically compact (e.g. Fanti et al. fanti95 (1995), O’Dea odea98 (1998)). Further, a subset of the sources in this paper are end-on classical doubles (including both quasars and galaxies). As a result of coordination between the present authors, we here present the complete observational results for the sources in the original programmes for which usable spectra were obtained, plus some statistics on the absorber depth and kinematics. In a follow-up paper, using a more tightly defined sample of GPS and CSS sources including data from the literature, Pihlström et al. (pihlstrom03 (2003)) discuss H i absorption in the context of other properties, and show, for example, the existence of an anti-correlation between absorption depth and linear size of the radio source.
2 WSRT observations and data analysis
This paper presents the combined results of a number of different WSRT projects, performed between 1997 and 2001, using the UHF-high receivers. While there were slight variations in the observational and data reduction methods used, the description below adequately describes the essentials. The data reduction was carried out using the NRAO AIPS and Caltech DIFMAP packages, typically switching back-and-forth to make use of their respective strong points.
Typically, each target was first observed for a few hours, in each of two orthogonal linear polarisations, with 128 spectral channels covering a 10 MHz wide observing band (the maximum available when the surveys started), centred at the frequencies predicted for H i based on the optical redshifts (these have some uncertainty, as discussed in Section 3). Doppler tracking was used; it ensures that spectra taken separately at arbitrary times of the day and year can be directly combined pixel-by-pixel. Most spectra were Hanning smoothed online, chiefly to combat the spectral rippling effects of strong narrow-band interference somewhere in the observing band. As a result, the effective spectral resolution in the initial observations is about 150 kHz.
The combined initial target list incorporated about 80 sources. Despite the WSRT’s impressive ability to suppress external interference, by virtue of its being an interferometric array, and having a multi-channel correlator, we have encountered a number of frequency intervals in which the level of the interference was always too high to obtain any useful data, even after trying to observe at different times, with different telescope orientations (hour angles), or with slightly shifted frequency bands. In the end, we pursued the observations for 57 sources to the point where the spectra showed either a line detection or gave a reasonable upper limit. This often involved follow-up observations done with narrower, offset bandwidths and/or twice the number of frequency channels (at the price of fewer correlated baselines) in the pursuit of line candidates.
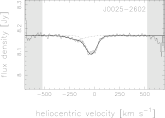
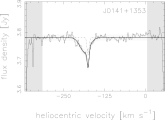
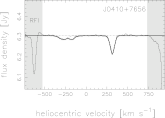
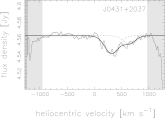
Bright external sources such as 3C48, 3C147, and 3C286 were used as calibrators. Time-limited or baseline specific interference was first removed, before using them for standard complex gain and bandpass-calibration. No attempt was made to obtain polarisation information; the data correlated in the two orthogonal linear polarisations were simply added after separate gain calibration, to increase the signal-to-noise of the final spectra. Furthermore, since our primary interest was on line optical depths, no particular care was expended on setting the overall flux density scale, but we believe that the flux densities shown in Figures 1 and 2 are accurate to better than 5%.
| Source | Name | Other | Optical | Radio11footnotemark: 1 | 22footnotemark: 2 | VHI,det | 33footnotemark: 3 | |||
|---|---|---|---|---|---|---|---|---|---|---|
| J2000 | B1950 | Name | ID | ID | MHz | km s-1 | km s-1 | 1020 cm-2 | ||
| J00252602 | 0023263 | OB238 | G | CSS | 0.322 | 1074.6 | 30 | 0.93 | 126 | 2.14 |
| 1075.1 | 174 | 0.20 | 39 | 0.14 | ||||||
| J0141+1353 | 0138+136 | 3C49 | G | CSS | 0.621 | 876.7 | 175 | 1.66 | 7 | 0.22 |
| 876.7 | 185 | 1.39 | 35 | 0.88 | ||||||
| J0410+7656 | 0403+768 | 4C76.03 | G | GPS | 0.5985 | 887.6 | 315 | 1.40 | 61 | 1.55 |
| 889.4 | 275 | 0.30 | 107 | 0.58 | ||||||
| 889.1 | 170 | 0.27 | 77 | 0.38 | ||||||
| J0431+2037 | 0428+205 | OF247 | G | GPS | 0.219 | 1164.1 | 318 | 0.46 | 297 | 2.52 |
| 1162.9 | 636 | 0.21 | 247 | 0.93 | ||||||
| J0834+5534 | 0831+557 | 4C55.16 | G | RG | 0.242 | 1145.1 | 399 | 0.28 | 207 | 1.07 |
| J0901+2901 | 0858+292 | 3C213.1 | G | CSS | 0.194 | 1189.7 | 14 | 0.05 | 115 | 0.11 |
| J0909+425344footnotemark: 4 | 0906+430 | 3C216 | Q | CSS | 0.670 | 850.2 | 102 | 0.38 | 177 | 1.23 |
| J1206+6413 | 1203+645 | 3C268.3 | G | CSS | 0.371 | 1035.1 | 258 | 1.00 | 101 | 1.85 |
| 1034.7 | 381 | 0.30 | 19 | 0.10 | ||||||
| J1326+3154 | 1323+321 | 4C32.44 | G | GPS | 0.370 | 1038.3 | 471 | 0.17 | 229 | 0.71 |
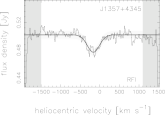
| J1357+4354 | 1355+441 | G | GPS | 0.64655footnotemark: 5 | 863.4 | 165 | 5.00 | 367 | 33.40 | |
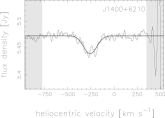
| J1400+6210 | 1358+624 | 4C62.22 | G | GPS | 0.4310 | 993.5 | 258 | 0.61 | 170 | 1.88 |
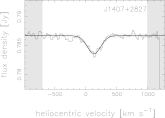
| J1407+2827 | 1404+286 | OQ208 | G | GPS | 0.07658 | 1318.9 | 131 | 0.39 | 256 | 1.83 |
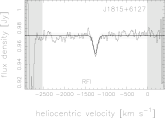
| J1815+6127 | 1815+614 | Q | GPS | 0.601 | 890.9 | 1258 | 2.03 | 118 | 4.35 | |
| J1821+3942 | 1819+396 | 4C39.56 | G | CSS | 0.798 | 792.3 | 869 | 1.00 | 44 | 0.80 |
| 792.0 | 742 | 0.76 | 61 | 0.85 | ||||||
| J1944+5448 | 1943+546 | OV573 | G | GPS | 0.263 | 1130.0 | 1420 | 0.86 | 315 | 4.91 |
| J2052+3635 | 2050+364 | G | GPS | 0.355 | 1048.6 | 95 | 16.11 | 16 | 4.69 | |
| 1048.7 | 130 | 4.40 | 32 | 2.56 | ||||||
| J2255+1313 | 2252+129 | 3C455 | Q | CSS | 0.543 | 920.4 | 30 | 0.16 | 140 | 0.42 |
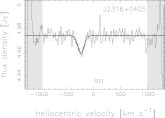
| J2316+0405 | 2314+038 | 3C459 | G | BLRG | 0.2199 | 1165.3 | 229 | 0.31 | 130 | 0.72 |
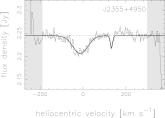
| J2355+4950 | 2352+495 | OZ488 | G | GPS | 0.2379 | 1147.5 | 12 | 1.72 | 82 | 2.56 |
| 1147.2 | 133 | 1.16 | 13 | 0.28 |
| 1 GPS = Gigahertz Peaked Spectrum source, CSS = Compact Steep Spectrum source, RG = Radio Galaxy, |
| BLRG = Broad Line Radio Galaxy. |
| 2 The radio band centre frequency used during the observations sometimes differed from that predicted by the optical |
| redshift, for example in order to avoid RFI or to pursue tentative lines. |
| 3 Derived from cm-2, using K. |
| 4 The detection of H i absorption in 3C 216, an integral part of our survey, was first published in Pihlström et al. (pihlstrom99 (1999).) |
| 5 Redshift based on Ca HK and G-band stellar absorption features in an unpublished spectrum obtained by some of us |
| (RCV and GBT) at the Palomar Observatory 200” Hale Telescope. |
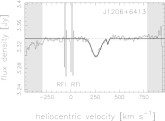

After external calibration, interference was removed from the target spectra to the extent possible. Figures 1 and 2 show that this was not always completely successful: some interfering signals, particularly when their strength did not dominate in the observing band, could not be adequately discriminated by their temporal or spatial characteristics. After editing to the extent possible, those spectral channels without any line features were averaged, and this continuum dataset was then used in iterative cycles of self-calibration alternated with image cleaning and/or model-fitting to the uv-data. The compact targets are all unresolved to the WSRT. Characterisation of the continuum sources in the field was not a goal in itself, and was pursued only to the level needed to find adequate self-calibration gain factors, and to ensure that confusing components would not disturb our spectral results. The self-calibration complex gains found for the continuum were subsequently applied to all spectral line channels. Final spectra were then produced by coherently integrating all phase-calibrated visibilities per spectral channel; this method produces an optimal signal-to-noise ratio given that in all cases the target, at the phase centre, is by far the dominant source in the field.
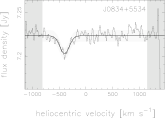
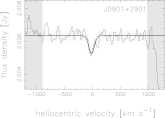
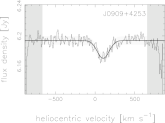
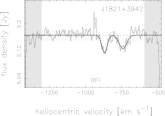
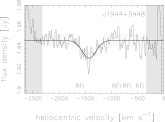
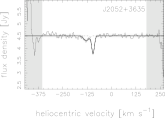
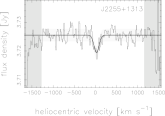
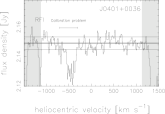
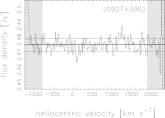
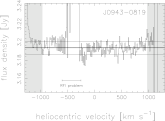
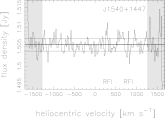
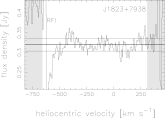
We find H i absorption to be present in the spectra of 19 of the 57 sources (33%); these are shown in Fig. 1. Table 1 gives the particulars of the detected absorption lines, determined by Gaussian profile fitting of the peak optical depths, , and FWHM line widths, ; the column densities were computed from these assuming uniform coverage of the entire radio source and a spin temperature K, using . Both assumptions mean that the listed column depths are lower limits: the covering factor might be below unity, and if the H i absorption were to arise in the pc-scale vicinity of the AGN, conditions might be such that K (Maloney et al. maloney96 (1996)). For the other 38 sources, we show the spectra in Fig. 2. For Table 2, we have used a FWHM of 100 km s-1 as a plausible width for an absorption line in these objects (see Section 4.1 and Fig. 5), in order to be able to derive upper limits to the line depths and H i column depths, based on the continuum flux densities and r.m.s. noise levels of the spectra.
3 Detection uncertainties
We expect that many of the optical redshifts used to centre the initial observing bands are uncertain at the level of a few hundred km s-1; particularly at the higher redshifts, they are typically based on emission lines which can be quite broad, and may have a velocity centroid which is offset from the systemic velocity of the host galaxy. With a 10 MHz wide band, we have spanned a velocity range of approximately km s-1 at , increasing to approximately km s-1 at . Also note that an uncertainty of in , which may be typical for the optical redshifts in the literature, corresponds to a frequency uncertainty for H i of nearly MHz at but only about MHz at . Thus, (optical) redshift uncertainties give the greatest (radio) frequency uncertainties at the lowest redshifts. In view also of interpreting the offsets discussed in Section 4.2, it would be valuable to obtain accurate systemic redshifts from high sensitivity, high resolution optical spectroscopy, for all of the sources we have detected in H i. Nevertheless, Fig. 6, discussed in Section 4.2, shows that in the 19 sources with detections, the H i velocity distribution around the optical redshift tails off rapidly towards km s-1. We therefore believe that our spanned bandwidth was adequate to cover the vast majority of the potential lines, and quite likely all of them.
In view of the large range in flux densities amongst the targets, it was impractical to achieve a uniform sensitivity to line optical depth (opacity). It is difficult to quantify what this means for an individual non-detection, but the following limited statistical analysis is indicative. Figure 3 shows the individual upper limits plotted along with the line opacities for the detected lines, while Fig. 4 shows their cumulative distributions. Firstly, we point out that from Fig. 3 there appears to be no evidence for a strong correlation of optical depth with FWHM, which means that adopting a somewhat arbitrary width of 100 km s-1 in order to compute upper limits is reasonable (the limits would have been somewhat tighter had we adopted a larger width). It is also clear that the distribution of detected line strengths is different from that of the upper limits: many of the limits are below most of the actual detections, meaning that these limits are tight enough to be very significant. A KS test shows that the cumulative distribution of the detections is different from that of the 2 limits at the 98% confidence level. It is also clear from Fig. 3, however, that about half of the 2 limits leave something to be desired: while they rule out the presence of prominent absorption (roughly: above %), they still allow the presence of shallower lines analoguous to those seen in some of the weaker detections (roughly: below %). A significant investment in telescope time would be needed in most cases in order to constrain this potential incompleteness.
Nevertheless, the detections that we do have are already an important next step in studying the cold neutral medium in cosmologically distant radio sources. Below, we briefly discuss some of the line properties. In a follow-up paper (Pihlström et al. pihlstrom03 (2003)), the line properties are related to other source parameters. VLBI observations in order to image the neutral gas distribution are already being pursued for some of the most prominent absorbers (e.g., Vermeulen rcviau (2003), Vermeulen et al. 2003b ).
4 Line Properties
4.1 Line widths
Figure 5 shows the distribution of the FWHM of the Gaussians fitted to the absorption lines. This plot confirms that H i lines in these sources often are broad, with a FWHM of 100–200 km s-1 or even more. We find that the primary lines (i.e. the deepest Gaussians, with the highest optical depth in each source) are probably somewhat broader than the secondary lines; the mean FWHMs, of 156 km s-1and 72 km s-1, respectively, differ at a confidence level of 97%, according to a Student’s -test.
Often, H i absorption is interpreted as being due to a circumnuclear disk; for example VLA 21 cm H i absorption imaging of a sample of Seyfert and starbursts displayed almost exclusively sub kpc scale rotating disks aligned with the outer galaxy disk (Gallimore et al. gallimore99 (1999)). Data for radio loud sources are also consistent with disks on sub kpc scales, for example in Cygnus A (Conway conway99 (1999)) and 1946+708 (Peck & Taylor peck01 (2001)). Those examples all have line widths of the order of 100 km s-1, comparable to the detections reported in this paper. If the wide lines arise on sub kpc scales close to the nucleus, the narrower lines could be additional absorption occurring on larger scales within the galaxy, provided that the line of sight does not cross a substantial amount of differential rotation. Alternatively, the narrower lines could be from single cohesive clouds, with only moderate internal velocity dispersion, as is observed in 3C236 (Conway & Schilizzi conway00 (2000)).
| Source | Name | Other | Optical | Radio11footnotemark: 1 | 22footnotemark: 2 | 33footnotemark: 3 | |
|---|---|---|---|---|---|---|---|
| J2000 | B1950 | name | ID | ID | 1020 cm-2 | ||
| J01571043 | 0155109 | OC192 | Q | EORQ | 0.616 | 0.35 | 0.63 |
| J02011132 | 0159117 | 3C57 | Q | EORQ | 0.669 | 0.24 | 0.43 |
| J0224+2750 | 0221+276 | 3C67 | G | CSS | 0.3102 | 0.50 | 0.91 |
| J0348+3353 | 0345+337 | 3C93.1 | G | CSS | 0.243 | 0.48 | 0.87 |
| J0401+0036 | 0358+004 | 3C99 | G | EORG | 0.426 | 0.39 | 0.71 |
| J0521+1638 | 0518+165 | 3C138 | Q | CSS | 0.759 | 0.17 | 0.30 |
| J0542+4951 | 0538+498 | 3C147 | Q | CSS | 0.545 | 0.11 | 0.19 |
| J05560241 | 0554026 | G | GPS | 0.235 | 2.17 | 3.94 | |
| J0609+4804 | 0605+480 | 3C153 | G | EORG | 0.2769 | 0.23 | 0.41 |
| J0709+7449 | 0702+749 | 3C173.1 | G | FRII | 0.2921 | 0.74 | 1.34 |
| J0741+3112 | 0738+313 | OI363 | Q | GPS | 0.635 | 0.34 | 0.62 |
| J08150308 | 0812029 | 3C196.1 | G | EORG | 0.198 | 0.53 | 0.96 |
| J0840+1312 | 0838+133 | 3C207 | Q | RQ | 0.6808 | 0.18 | 0.33 |
| J0927+3902 | 0923+392 | 4C39.25 | Q | EORG | 0.6948 | 0.34 | 0.62 |
| J0939+8315 | 0931+834 | 3C220.3 | G | EORG | 0.685 | 0.17 | 0.31 |
| J09430819 | 0941080 | G | GPS | 0.228 | 0.44 | 0.80 | |
| J0954+7435 | 0950+748 | G | RG | 0.69544footnotemark: 4 | 0.87 | 1.58 | |
| J1035+5628 | 1031+567 | OL553 | G | GPS | 0.459 | 0.48 | 0.87 |
| J1120+1420 | 1117+146 | 4C14.41 | G | GPS | 0.362 | 0.21 | 0.38 |
| J1159+2914 | 1156+295 | 4C29.45 | Q | EORG | 0.729 | 0.66 | 1.20 |
| J1252+5634 | 1250+568 | 3C277.1 | Q | CSS | 0.321 | 0.25 | 0.45 |
| J13080950 | 1306095 | OP010 | G | CSS | 0.464 | 0.47 | 0.85 |
| J1313+5458 | 1311+552 | Q | RQ | 0.613 | 0.62 | 1.13 | |
| J1421+4144 | 1419+419 | 3C299 | G | CSS | 0.367 | 0.24 | 0.44 |
| J1443+7707 | 1443+773 | 3C303.1 | G | CSS | 0.267 | 0.52 | 0.94 |
| J1540+1447 | 1538+149 | 4C14.60 | Q | EORG | 0.605 | 0.22 | 0.39 |
| J1546+0026 | 1543+005 | G | GPS | 0.550 | 0.36 | 0.66 | |
| J1642+6856 | 1642+690 | 4C69.21 | Q | EORG | 0.751 | 0.46 | 0.84 |
| J1658+0741 | 1655+077 | OS092 | Q | EORG | 0.621 | 0.54 | 0.98 |
| J1823+7938 | 1826+796 | G | GPS | 0.224 | 10.05 | 18.29 | |
| J1829+4844 | 1828+487 | 3C380 | Q | CSS | 0.692 | 0.07 | 0.12 |
| J1831+2907 | 1829+290 | 4C29.56 | G | CSS | 0.842 | 0.59 | 1.07 |
| J1845+3541 | 1843+356 | OU373 | G | GPS | 0.764 | 3.80 | 6.92 |
| J2022+6136 | 2021+614 | OW637 | Q | GPS | 0.227 | 0.13 | 0.24 |
| J21372042 | 2135209 | OX258 | G | CSS | 0.635 | 0.41 | 0.74 |
| J2250+1419 | 2247+140 | 4C14.82 | Q | CSS | 0.237 | 0.45 | 0.82 |
| J2321+2346 | 2318+235 | 3C460 | G | EORG | 0.268 | 0.70 | 1.28 |
| J2344+8226 | 2342+821 | Q | GPS | 0.735 | 0.26 | 0.47 |
| 1 GPS = Gigahertz Peaked Spectrum source, CSS = Compact Steep Spectrum source, RG = Radio Galaxy, |
| RQ = Radio Quasar, BLRG = Broad Line Radio Galaxy, FRII = Fanaroff-Riley Type 2, |
| EORG = End On Radio Galaxy and EORQ = End On Radio Quasar. |
| 2 The radio band centre frequency used during the observations sometimes differed from that predicted by the optical |
| redshift, for example in order to avoid RFI or to pursue tentative lines. |
| 3 Derived from cm-2, using K and km s-1. |
| 4 Redshift based on MgII, [OII], and [OIII] emission lines in an unpublished spectrum obtained by some of us (RCV |
| and GBT) at the Palomar Observatory 200” Hale Telescope. |


4.2 Inflowing and outflowing gas ?
It was pointed out by van Gorkom et al. (1989) that in all 4 out of 29 nearby radio galaxies () with detected H i absorption, and also in 4 other nearby systems, the H i velocity is positive, i.e. infalling with respect to the systemic velocity of the galaxy. The radio structure (or, in the case of 3C236, at least the absorbed part) of those nearby galaxies with H i absorption is very compact, and many of these objects are now classified as GPS or CSS sources. Thus, they potentially match well with the types of sources that constitute the majority of our sample.
As Figure 6 shows, we now find H i lines at both positive and negative velocities with respect to the optical redshift. Also, while typical velocities in the lower redshift sources of van Gorkom (1989) were in the range 0 to km s-1, with only 1 value around km s-1, 10 of our 19 main (highest opacity) lines have a velocity more than 200 km s-1 different from the optical redshift; the main line velocities range between km s-1 and km s-1. While, as already discussed in Section 3, inaccuracies in the optical redshift may play a role in causing some of the scatter, we believe the larger H i velocities are likely to be significant. We see an intriguing hint that the velocity distribution may be skewed towards outflow rather than infall. This effect can be stated more dramatically than it appears through the binning of Fig. 6: 13 of the main line velocities are negative as compared to 6 positive; of these, 7 have km s-1 as compared to 3 having km s-1, and of these, 3 have km s-1 as compared to none at km s-1. The mean centroid velocities are km s-1 for the main lines and km s-1 for the secondary lines, respectively. However, Student’s tests at a confidence level of 95% show that the mean velocities of the main lines and the secondary lines indeed do not differ significantly from zero, and also not from each other, possibly only because the sample size is too small.

Thus, we find the opposite of the results obtained for nearby radio sources by van Gorkom et al. (vangorkom89 (1989)) in both the sign and the magnitude of the velocities. Speculatively, we think that in these higher luminosity sources, interaction between the radio jets and the surrounding inner galactic medium could lead to significant motions of the gas, such as found in 3C236 by Conway & Schilizzi (conway00 (2000)). Other evidence for such interactions is often seen as the so-called radio-optical alignment effect. The kinematics of the aligned gas seen in CSS sources shows velocity offsets of a few hundred km s-1 (both positive and negative) with respect to the nuclear velocity (e.g., O’Dea et al. odea02 (2002)). Alternatively, in some cases we may be looking at the line-of-sight rotational motion of a neutral component of broad-line gas, seen in front of a parsec-scale radio source, as has been discussed for lower redshift galaxies for example by Morganti et al. (morganti01 (2001)).
5 Summary
H i absorption searches have been carried out with the WSRT for a sample of mostly compact radio sources with redshifts out to nearly , giving observing frequencies which fall in the UHF-high band (725–1200 MHz). Out of 57 sources for which adequate spectra could be obtained, 19 are found to have associated H i in absorption, with opacities ranging from 16% down to 0.2%; below 1% opacity, our statistics may well be incomplete. The typical line width is km s-1, but the lines can also be several times narrower or wider. Column densities ranging from to are obtained by assuming uniform coverage of the radio source and a spin temperature K. In contrast to nearby radio sources, we find not only positive but even more negative H i velocities, up to more than 1000 km s-1(as compared to the optical redshifts). Perhaps, inflow and outflow can both occur, or there is interaction with the radio source, or we are seeing rotating broad-line gas.
Acknowledgements.
The WSRT is operated by ASTRON (The Netherlands Foundation for Research in Astronomy) with support from the Netherlands Foundation for Scientific Research (NWO). We are very grateful for the dedication of the ASTRON staff who worked on the WSRT upgrade, as well as those who assisted in performing the survey observations. This research has made use of the NASA/IPAC Extragalactic Database (NED), which is operated by the Jet Propulsion Laboratory, California Institute of Technology, under contract with the National Aeronautics and Space Administration in the United States of America.References
- (1) Bregman, J. N., Hogg, D. E., & Roberts, M. S. 1992, ApJ, 387, 484
- (2) Cid Fernandes, R., Heckman, T., Schmitt, H., González Delgado, R. M. & Storchi-Bergmann, T. 2001, ApJ, 558, 81
- (3) Conway J.E., 1999, in ’Highly Redshifted Radio Lines’, eds. C. Carilli, S. Radford, K. Menten & G. Langston, 1999, ASP Conf. Ser., Vol 156, 259
- (4) Conway, J. E., & Schilizzi, R.T. 2000, in ’Proceedings of the 5th European VLBI Network Symposium’, eds. J. E. Conway, A. G. Polatidis, R. S. Booth & Y. M. Pihlström, p. 123
- (5) Dunlop, J. S., McLure, R. J., Kukula, M. J., Baum, S. A., O’Dea, C. P., & Hughes, D. H. 2003, MNRAS in press, see astro-ph/0108397
- (6) Evans A.S., Kim D.C., Mazzarella J.M., Scoville N.Z. & Sanders D.B. 1999. ApJL, 521, L107
- (7) Fanti, C., Fanti, R., Dallacasa, D., Schilizzi, R. T., Spencer, R. E., & Stanghellini, C. 1995, A&A, 302, 317
- (8) Gallimore, J. F., Baum, S. A., O’Dea, C. P., Pedlar, A., & Brinks, E. 1999, ApJ, 524, 684
- (9) van Gorkom, J. H., Knapp, G. R., Ekers, R. D., Ekers, D. D., Lang, R. A., & Polk, K. S. 1989, AJ, 97, 708
- (10) Ho, L. C., Filippenko, A. V., & Sargent, W. L. W. 1997, ApJ, 487, 568
- (11) Knapp, G. R., & Rupen, M. P. 1996, ApJ, 460, 271
- (12) Ledlow, M. J., Owen, F. N., & Keel, W. C. 1998, ApJ, 495, 227
- (13) Maloney, P. R., Hollenbach, D. J., & Tielens A. G. G. M. 1996, ApJ, 466, 561
- (14) Martel, A. R., Baum, S. A., Sparks, W. B., Wyckoff, E., Biretta, J. A., Golombek, D., Macchetto, F. D., de Koff, S., McCarthy, P. J., & Miley, G. K. 1999, ApJS, 122, 81
- (15) Morganti R., Oosterloo T.A., Tadhunter C.N., van Moorsel G., Killeen N. & Wills K.A., 2001, MNRAS, 323, 331
- (16) O’Dea, C. P. 1998, PASP, 110, 493
- (17) O’Dea, C. P., de Vries, W. H., Koekemoer, A. M., Baum, S. A., Morganti, R., Fanti, R., Capetti, A., Tadhunter, C. N., Barthel, P. D., Axon, D. J. & Gelderman, R. 2002, AJ, 123, 2333
- (18) Oosterloo, T. A., Morganti, R., & Sadler, E., 1999, PASA, 16, 28
- (19) Peck, A. B., & Taylor, G. B. 2001, ApJ, 554, L147
- (20) Pihlström, Y. M., Vermeulen, R. C., Taylor, G. B., & Conway, J. E. 1999, ApJ, 525, L13
- (21) Pihlström, Y. M., Conway, J. E., & Vermeulen, R. C., 2003, accepted A&A
- (22) Rees, M. J. 1984, ARA&A, 22, 471
- (23) Rupen, M. P., in “The Nature of Elliptical Galaxies”, 2nd Stromlo Symposium, ASP Conference Series, Vol. 116, 1997, ed. M. Arnaboldi, G. S. Da Costa & P. Saha, p.322
- (24) Sanders, D. B., Soifer, B. T., Elias, J. H., Madore, B. F., Matthews, K., Neugebauer, G., & Scoville, N. Z. 1988, ApJ, 325, 74
- (25) Storchi-Bergmann, T., González Delgado, R. M., Schmitt, H. R., Cid Fernandes, R., Heckman, T. 2001, ApJ, 559, 147
- (26) van Langevelde, H. J., Pihlström, Y. M., Conway, J. E., Jaffe, W., & Schilizzi, R. T. 2000, A&A, 354, L45
- (27) Verdoes Kleijn, G. A., Baum, S. A., de Zeeuw, P. T., & O’Dea, C. P. 1999, AJ, 118, 2592
- (28) Vermeulen, R. C. 2003, Associated HI in absorbers at high redshift, in The Universe at Low Radio Frequencies, IAU Symposium 199, ASP Conf. Ser., ed. A. Pramesh Rao, G. Swarup, Gopal-Krishna (San Francisco: ASP), in press, see astro-ph/0012352
- (29) Vermeulen, R. C., Ros, E., Kellermann, K. I., Cohen, M. H., Zensus, J. A., & van Langevelde, H. J. 2003a, A&A, in press, see astro-ph/0212030
- (30) Vermeulen, R. C., Labiano, A., O’Dea, C. P., Barthel, P. D., Baum, S. A., Braun, R., & de Vries, W. H. 2003b, in preparation
- (31) Walsh, D. E. P., Knapp, G. R., Wrobel, J. M., Kim, D.-W. 1989, ApJ, 337, 209